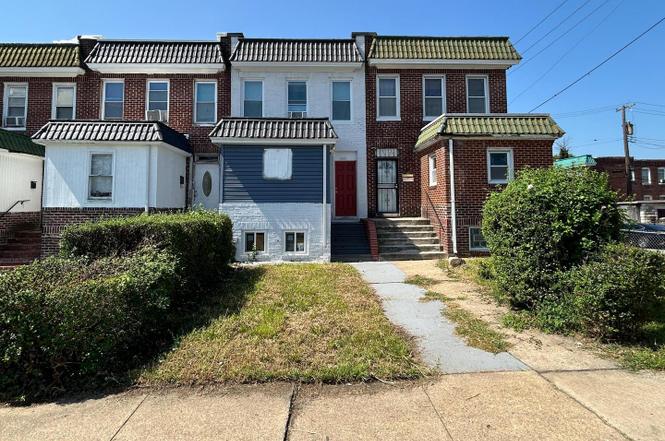
4140 Reisterstown Rd · Baltimore, MD
Flood risk 1/10 · Minimal
- FEMA flood zone
- X (unshaded)
- Chance of flooding over 30 yrs
- 0.0%
- Est. flood insurance / yr
- $473 – $860
Fire risk 1/10 · Minimal
- Est. fire insurance / yr
- $755 – $1,403
Heat risk 7/10 · Major
- Hot days now (above 104°F)
- 7 days/yr
- Hot days in 30 yrs
- 15 days/yr
Wind risk 6/10 · Moderate
- Chance of severe wind over 30 yrs
- 27.0%
Air-quality risk 3/10 · Minor
- Unhealthy air days now
- 3 days/yr
- Unhealthy air days in 30 yrs
- 4 days/yr
Risk factors via First Street. Map © Google.
Why this score? — see what drove the B- grade
The composite is a weighted blend of 9 inputs, each scored 0–100. Each bar is that input's sub-score; the figure is the points it added to the 100-point composite (weight × sub-score).
- Cash flow +30.0/30.0
- 1% rule +10.0/10.0
- DSCR +10.0/10.0
- ARV discount +7.5/15.0
- Livability +3.8/5.0
- Rent growth +3.1/5.0
- Condition / age +2.5/5.0
- Schools +1.0/10.0
- Appreciation +0.0/10.0
$112,500
🖨 Deal sheet (PDF) 📄 Offer letter ✓ Due diligence
Listing remarks
Welcome to this updated townhome in the neighborhood of Towanda-Grantley. Step inside and you will be greeted with an open concept floor plan with luxury vinyl plank flooring and conferred ceiling. The kitchen features stainless steel appliances, nice backsplash, quartz countertops and white shaker cabinetry. When you venture to the upper level, you will find a primary bedroom with accent wall, a full bath with quartz stone walls & flooring and two more bedrooms. The walkout lower level is finished and consists of a spacious recreation room with carpet floors, a utility room and full bathroom with a stall shower. The concrete private backyard is perfect for outdoor entertainment and
Key facts
- Quartz countertops
- Finished lower level
- Built 1920
Tags
Neighborhood map
What this means for you Summary
Snapshot
- This is a 3-bed/2.5-bath townhouse listed at $112k.
Deal economics
- At list price, monthly cash flow is $815 ($10k/yr) — positive.
- The deal already cash-flows at list — no discount required.
- Meets the 1% rule at list price ($2k rent vs $112k).
- Recommended offer: $99k (12.0% below list) — sets the bar for market timing.
- Cap rate 15.0% vs local median 6.0% in Baltimore — top-decile yield for the area; either an underpriced asset or a hidden risk that comps aren't pricing in. Stress-test before assuming the spread holds.
Location & tenants
- Location reads 76/100 on livability (#90 in MD, #3,396 nationally) — a middle-class / working-renter tenant base. Strengths: amenities A+, commute A+, housing A+; Watch: schools D, crime F.
- Baltimore City Public Schools (urban): math 7% / reading 16% proficiency, ranked #24 of 24 in MD (top 100%) — low school quality limits family demand, transient renter base, plan for 1-2y turnover; 79% free/reduced lunch — lower-income household profile, screen leases tightly.
- Market conditions: Rents rising (+2.4%/yr); 351 active listings in the ZIP; 21 comparable units currently listed for rent nearby; rentals at typical pace (median 25d on market — plan ~3-4 weeks tenant-placement turnaround); 1,273 units permitted in Baltimore city in 2024 (1,104 in 5+ unit buildings).
- At $1,999/mo this rent would consume 46% of the median local household income ($52k/yr) (locally 3644% of renters already pay >50% of income on rent) — very limited rent-growth headroom before tenants either downsize or default.
Forward outlook
- Local home prices are declining (-3.0%/yr); year-one equity from $778 of loan paydown is wiped out by about $3k of value loss. Plan a longer hold.
- Baltimore County population projected to shrink 4% by 2050 — rents likely to lag national; underwrite the cash flow, not the appreciation.
- At projected returns (-3.0% appreciation + 2.4% rent growth), your $32k cash investment doubles in ~4 years — after that, you're playing with house money.
Negotiation context
- It's been on market 234 days — a 12% lower offer ($99k) is reasonable based on typical stale-listing flexibility.
- 6 sale attempts since 26y ago; this cycle's ask has dropped $47k (30%) from the opening price — seller is motivated, your offer sets the floor, not the list.
Risks & watch-outs
- Watch-outs: built in 1920 — expect roof / HVAC / electrical / plumbing capex.
- Climate carrying-cost: major wind risk, 27% chance of damaging wind over 30y; extreme-heat days projected 7→15/yr by 2055 (HVAC capex compounding) — expect insurance premiums to compound above CPI over the hold.
Questions for the listing agent
- It's been on market 234 days. Have you received any prior offers? Is the seller open to a 12% concession, seller financing, or rate buy-down credit?
- Built in 1920 — when were the roof, HVAC, electrical panel, plumbing, and water heater last replaced?
- Why hasn't it sold? Are there any deal-killer items the seller is aware of (foundation, flood, title, zoning, code violations)?
- Is there a deadline driving the sale (1031 exchange, divorce, estate, relocation)? That informs how much negotiation room exists.
- Schools are D-rated, which usually means shorter tenancies and higher turnover. Who's the typical renter profile here, and what's been the actual vacancy rate?
- Crime grade is F in this area — have there been break-ins, vandalism, or insurance claims at this property in the last 3 years? What carrier currently insures it and at what premium?
- What's the average days-on-market for RENTAL listings here right now (not sales)? A rising rental-DOM trend means longer vacancies and softer asking-rent achievability than the comps imply.
- What's the recent tenant-quality profile in this submarket — average credit score on applications, eviction rate, late-payment / NSF rate, and stable-employment percentage? A property-management company in the area should have these aggregated.
- How much new for-sale + rental construction is in the pipeline within 1–3 miles? Heavy new supply typically softens prices + rents 12–24 months out; constrained supply supports both.
Investment metrics
- 1% rule
- 1.78% ✓
- Cap rate
- 14.99%
- Cash-on-cash
- 31.05%
- DSCR
- 2.38
- GRM
- 4.7
CMA / ARV
- ARV (on-the-fly)
- $230,050
- Comps found
- 12
Show comp detail 12 sales within ~0.75 mi
| Address | Dist | Beds/Ba | Sqft | Sold | Price | $/sf | Match |
|---|---|---|---|---|---|---|---|
| 3304 Dorithan Rd | 0.35mi | 4/2.0 (+1) | 2,178 (+1%) | 11mo | $106,000 | $49 | 66 |
| 4043 Cedardale Rd | 0.21mi | 4/3.5 (+1) | 1,997 (-7%) | 6mo | $257,900 | $129 | 64 |
| 4668 Pimlico Rd | 0.61mi | 3/2.5 | 2,100 (-2%) | 4mo | $185,000 | $88 | 64 |
| 2627 Loyola Northway | 0.27mi | 4/3.5 (+1) | 1,900 (-12%) | 2mo | $250,000 | $132 | 57 |
| 4333 Pimlico Rd | 0.26mi | 4/2.5 (+1) | 2,430 (+13%) | 7mo | $245,000 | $101 | 55 |
| 2629 Loyola Southway | 0.24mi | 4/3.5 (+1) | 1,950 (-9%) | 12mo | $275,000 | $141 | 55 |
| 3512 Reisterstown Rd | 0.63mi | 4/1.0 (+1) | 2,145 (-0%) | 7mo | $59,900 | $28 | 53 |
| 3324 Dolfield Ave | 0.42mi | 4/2.5 (+1) | 1,952 (-9%) | 12mo | $301,000 | $154 | 50 |
| 3706 Overview Rd | 0.47mi | 4/3.5 (+1) | 1,870 (-13%) | 0mo | $220,000 | $118 | 47 |
| 4002 Ayrdale Ave | 0.71mi | 4/3.0 (+1) | 2,345 (+9%) | 2mo | $250,000 | $107 | 43 |
| 3701 Manchester Ave | 0.73mi | 4/2.5 (+1) | 1,900 (-12%) | 4mo | $170,000 | $89 | 38 |
| 2800 Suffolk Ave | 0.70mi | 4/2.0 (+1) | 1,881 (-12%) | 2mo | $37,500 | $20 | 38 |
Match score weights: distance 35% · size 25% · config 20% · recency 20%. Top-matched comps best support the ARV.
Projected returns pro-forma
-3.0% appreciation · 2.41% rent growth · sell at horizon
- IRR
- 25.2%
- Equity multiple
- 2.03×
- Total profit
- $32,516
- Equity at exit
- $16,774
- IRR
- 32.6%
- Equity multiple
- 3.87×
- Total profit
- $90,455
- Equity at exit
- $9,727
Cash invested: $31,500 (down + closing). Projections, not guarantees.
Landlord ↔ Tenant lean methodology
- Overall (CITY)
- 12 Strongly Tenant-Friendly
- State Maryland
- 27 Tenant-Leaning · D+14
- County
- — inherits STATE
- City Baltimore
- 12 Strongly Tenant-Friendly · D+58
ZIP-level market 21215
- Rents YoY
- 2.4%
- Active inventory
- 351
- Price-to-rent
- 4.7×
Monthly cashflow live
- Estimated rent
- $1,999 high interval (Pro) →
- Mortgage (P&I)
- −$590
- Tax from tax record
- −$127 /mo · $1,529/yr
- Insurance
- −$47
- HOA
- −$0
- Vacancy / Maint / Mgmt
- −$420
- Net cashflow
- $815
Break-even live
Sensitivity live
| Price | -10% $879 | -5% $847 | +0% $815 | +5% $783 | +10% $751 |
|---|---|---|---|---|---|
| Rent | -10% $657 | -5% $736 | +0% $815 | +5% $894 | +10% $973 |
| Rate | -1.0pp $872 | -0.5pp $844 | base $815 | +0.5pp $786 | +1.0pp $756 |
UW: 25.0% down · 7.5% · 30yr · 1.5% tax · 5.0% vac · 8.0% maint · 8.0% mgmt
Financing live
Cash to close
- Down payment
- $28,125
- Closing costs
- $3,375
- Reserves months
- —
- Total cash needed
- —
Loan-product check · same deal, 3 products live
Conventional
25% down · 7.5% · 30yr
- Down + closing
- —
- Monthly P&I
- —
- Monthly cashflow
- —
- DSCR
- —
- Eligible?
- —
Personal DTI + credit; lowest rate.
DSCR
20% down · 8.5% · 30yr
- Down + closing
- —
- Monthly P&I
- —
- Monthly cashflow
- —
- DSCR
- —
- Eligible?
- —
No personal income docs; deal must DSCR.
Hard money
10% down · 12.0% · 12mo
- Down + closing
- —
- Monthly P&I
- —
- Monthly cashflow
- —
- DSCR
- —
- Eligible?
- —
Short-term bridge; refi at stabilization.
Rent comps 21 comps
| Address | Beds | Baths | Sqft | Rent | $/sqft | DOM | Units | Dist |
|---|---|---|---|---|---|---|---|---|
| 4230 Towanda Ave Baltimore, MD | 3.0 | 2.0 | 1400 | $1,800 | $1.29 | 18d | 1 | 0.10mi |
| 2619 Loyola Northway Baltimore, MD | 3.0 | 2.0 | 1400 | $1,995 | $1.43 | 24d | 1 | 0.28mi |
| 3204 Sequoia Ave Baltimore, MD | 4.0 | 2.5 | 1791 | $2,600 | $1.45 | 44d | 1 | 0.51mi |
| 4704 Pimlico Rd Baltimore, MD | 3.0 | 1.5 | 2006 | $1,800 | $0.90 | 24d | 1 | 0.67mi |
| 3213 Dorchester Rd Baltimore, MD | 2.0 | 1.0 | 2640 | $1,850 | $0.70 | 24d | 1 | 0.76mi |
| 3600 Malden Ave Baltimore, MD | 2.0 | 1.0 | 2256 | $1,999 | $0.89 | 44d | 1 | 0.86mi |
| 2805 Oakley Ave Baltimore, MD | 2.0 | 1.0 | 2400 | $1,500 | $0.62 | 15d | 1 | 0.87mi |
| 3632 Parkdale Ave Baltimore, MD | 3.0 | 1.0 | 1400 | $3,000 | $2.14 | 44d | 1 | 0.94mi |
| 2078 Druid Park Dr Baltimore, MD | 2.0 | 3.0 | 1500 | $2,500 | $1.67 | 44d | 1 | 0.98mi |
| 2078 Druid Park Dr Unit 4 Baltimore, MD | 2.0 | 2.5 | 1500 | $2,500 | $1.67 | 44d | 1 | 0.99mi |
| 2001 W Cold Spring Ln Baltimore, MD | 1.0–3.0 | 1.0–2.0 | 1154 | $3,505 | $3.04 | 2d | 31 | 1.04mi |
| 4320 Roland Heights Ave Baltimore, MD | 3.0 | 2.5 | 1800 | $3,300 | $1.83 | 18d | 1 | 1.08mi |
| 4322 Roland Heights Ave Baltimore, MD | 3.0 | 3.0 | 1800 | $3,000 | $1.67 | 44d | 1 | 1.08mi |
| 2305 Wichita Ave Unit 1 Baltimore, MD | 3.0 | 1.0 | 1950 | $1,300 | $0.67 | 24d | 1 | 1.09mi |
| 3411 Fairview Ave Baltimore, MD | 2.0 | 1.0 | 2949 | $1,600 | $0.54 | 18d | 1 | 1.10mi |
| 4319 Medfield Ave Baltimore, MD | 3.0 | 2.5 | 1800 | $3,100 | $1.72 | 44d | 1 | 1.13mi |
| 3914 Maine Ave Unit 3 Baltimore, MD | 2.0 | 1.0 | 2127 | $1,150 | $0.54 | 44d | 1 | 1.18mi |
| 3213 Vickers Rd Unit 1 Baltimore, MD | 2.0 | 1.0 | 2568 | $1,700 | $0.66 | 24d | 1 | 1.30mi |
| 3104 Tioga Pkwy Baltimore, MD | 3.0 | 2.0 | 1640 | $2,050 | $1.25 | 22d | 1 | 1.31mi |
| 3414 Alto Rd Unit 1ST Baltimore, MD | 2.0 | 1.0 | 2824 | $1,850 | $0.66 | 24d | 1 | 1.38mi |
| 3414 Alto Rd Unit 2ND Baltimore, MD | 3.0 | 1.0 | 2824 | $2,000 | $0.71 | 24d | 1 | 1.38mi |
Listing history 19 events
-
2026-03-20status Pending
-
2026-01-21price $112,500
-
2025-12-15status Active
-
2025-10-28status Pending
-
2025-10-01price $119,500
-
2025-08-15price $133,500
-
2025-07-16price $148,850
-
2025-06-11$159,850 Active
-
2024-01-12status Pending
-
2024-01-12historical
-
2024-01-01price $205,000
-
2023-11-22$219,000 Active
-
2023-06-26historical
-
2023-06-17price $249,000
-
2023-05-23$270,000 Active
-
2018-07-10historical Withdrawn
-
2018-06-08Active
-
2001-04-01historical
-
2000-09-15
ⓘ Source: listings_history table (triggers on properties + properties_extension) + one-shot
backfill from property_details.listing_events for pre-trigger history.
Tax reassessment forecast MD · Partial reset (capped growth)
- Current annual tax
- $1,529 · $127/mo
- Projected year-2 tax
- $1,529 · $127/mo
- Expected delta
- $0/yr ($0/mo · 0.0%)
ⓘ Screening estimate from a state-policy table — verify with the county assessor before closing.
Climate risk First Street
- Flood 1/10 Low FEMA zone X (unshaded) · 0% chance over 30 yrs
- Wildfire 1/10 Low
- Heat 7/10 Severe 7 d/yr ≥104°F today · 15 d/yr by 30 yrs out
- Wind 6/10 Major 27% chance of damaging wind over 30 yrs
- Air quality 3/10 Moderate 3 unhealthy d/yr today · 4 by 30 yrs out
Nearby sold comps map
Loading sold comps map…
Walkable amenities ~0.75 mi
Loading nearby amenities…
Taxation est. · year 1
- Rental income
- $23,988
- − Mortgage interest
- −$6,302
- − Property taxes
- −$1,529
- − Insurance
- −$562
- − Repairs & maintenance
- −$1,919
- − Management
- −$1,919
- − Depreciation
- −$3,273
- Taxable income
- $8,484
- Est. tax owed @ 24.0%
- −$2,036
- After-tax cash flow
- $7,743/yr
For passive investors: Depreciation is non-cash, so a rental often shows a tax loss while cash-flowing — sheltering income. Rental losses are passive: they offset passive income freely, and up to $25,000/yr can offset ordinary (W-2) income if you actively participate and your MAGI is under $100k (phasing out to $0 by $150k); unused losses carry forward. On sale, claimed depreciation is recaptured at up to 25%, and gains may owe capital-gains tax (a 1031 exchange can defer both). Figures are a year-1 estimate at your 24.0% rate — not tax advice; consult a CPA.
Schools (NCES district)
- District
- Baltimore City Public Schools
- NCES district ID
- 2400090
- Math proficiency
- 7% ▼ -9.00%
- Reading proficiency
- 16% ▼ -5.00%
- Median HH income
- $42,108
- Composite
- 10.08/100
- National rank
- #9805
- State rank
- #24 of 24 in MD
Livability — Baltimore
- Score
- 76/100
- State rank
- #90
- US rank
- #3396
Category grades
Schools grade is shown separately in the Schools card above.
Census & demographics
- Census place
- Baltimore, MD
- County
- Baltimore City · 558,601 people
- City population
- 588,727
- Metro
- Baltimore-Columbia-Towson, MD
- Population (ZIP)
- 52,229
- Household income
- $51,587
- Rent vs Own
- Severe rent burden
- 3644.0
Population outlook (Baltimore County) Hauer SSP2
- Today (2025)
- 624,249 people
- By 2030
- 621,541 · -0.4%
- By 2040
- 609,756 · -2.3%
- By 2050
- 597,249 · -4.3%
- By 2075
- 552,236 · -11.5%
- By 2100
- 513,934 · -17.7%
Race, ethnicity, and origin ACS 2023
- Neighborhood character
- Predominantly Black (73%)
- Race & ethnicity
- Black 73% White 17% Hispanic / Latino 5% Two or more races 4% Asian 1%
- Common ancestry
- Scotch-Irish 2% Romanian 2% Italian 1%
- Foreign-born
- 9% · Canada, South Korea
- Languages at home
- 91% English-only · Spanish 4% French/Haitian/Cajun 1% Other Indo-European 1%
Political lean MEDSL · Baltimore
- 2024 margin
- Solid D (+73.0) · D 85.2% · R 12.2% · Other 2.6%
- 2008→2024 swing
- -2.5pp toward R · 2008: 75.5pp · 2024: 73.0pp
- All cycles
- 2024: D+73.0 2020: D+76.6 2016: D+74.6 2012: D+76.4 2008: D+75.5
Not yet ingested
- Civics
- —
Market trends
- HPI YoY
- ▼ -318.58%
- Current HPI
- 291.4926
- Rent YoY
- ▲ 2.41%
- Metro
- Baltimore-Columbia-Towson, MD
- State GDP YoY
- ▲ 2.97%
- F500 in state
- 12
Industry mix (Fortune 500 HQ in MD)
| Industry | F500 HQs | Revenue |
|---|---|---|
| Aerospace / Defense | 1 | $71B |
|
||
| Utilities | 1 | $25B |
|
||
| Hotels | 1 | $24B |
|
||
| Consumer Goods | 1 | $7B |
|
||
| Real Estate | 1 | $6B |
|
||
| Chemicals | 1 | $2B |
|
||
Price history
-58.3% since first listed19 events — show timeline
- 2026-03-20 Pending — BRIGHT MLS
- 2026-01-21 Price Changed $112,500 BRIGHT MLS
- 2025-12-15 Relisted — BRIGHT MLS
- 2025-10-28 Pending — BRIGHT MLS
- 2025-10-01 Price Changed $119,500 BRIGHT MLS
- 2025-08-15 Price Changed $133,500 BRIGHT MLS
- 2025-07-16 Price Changed $148,850 BRIGHT MLS
- 2025-06-11 Listed $159,850 BRIGHT MLS
- 2024-01-12 Pending — BRIGHT MLS
- 2024-01-12 Listing Removed — BRIGHT MLS
- 2024-01-01 Price Changed $205,000 BRIGHT MLS
- 2023-11-22 Listed $219,000 BRIGHT MLS
- 2023-06-26 Listing Removed — BRIGHT MLS
- 2023-06-17 Price Changed $249,000 BRIGHT MLS
- 2023-05-23 Listed $270,000 BRIGHT MLS
- 2018-07-10 Delisted — MRIS
- 2018-06-08 Listed — MRIS
- 2001-04-01 Delisted — MRIS
- 2000-09-15 Listed — MRIS
Property tax history
+6.3%/yrLatest (2025): $1,529 · +21.2% YoY. Source: county tax records.
Cash-flow waterfall
monthlySold comps — $/sqft
last 12 mo · ≤1 miLoading sold comps…