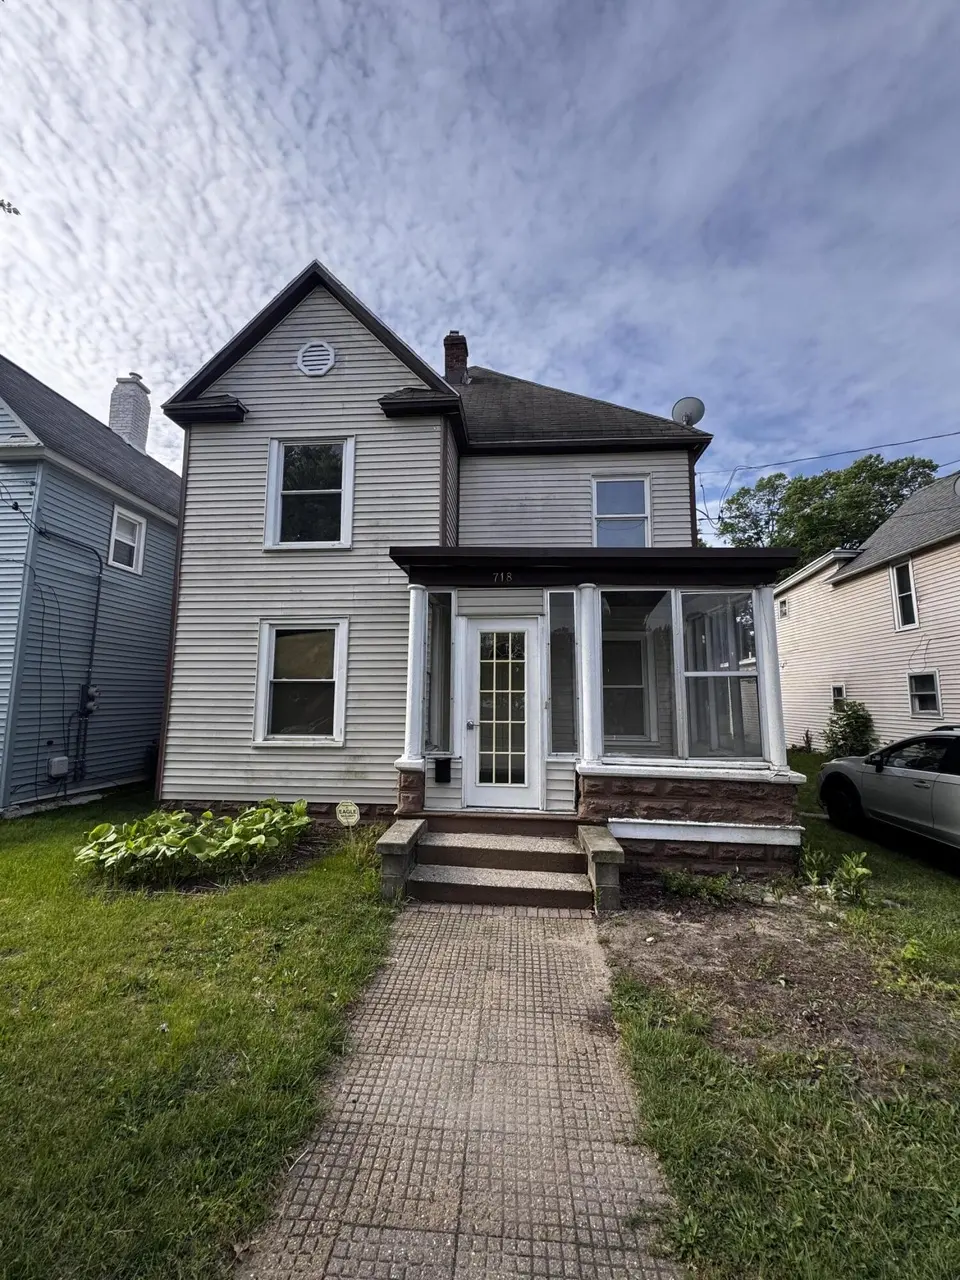
718 Sherman Street SE #1, #2 St · Grand Rapids, MI
Flood risk 6/10 · Moderate
- FEMA flood zone
- X (unshaded)
- Chance of flooding over 30 yrs
- 0.74%
- Est. flood insurance / yr
- $473 – $860
Fire risk 1/10 · Minimal
- Est. fire insurance / yr
- $784 – $1,456
Heat risk 2/10 · Minimal
- Hot days now (above 96°F)
- 7 days/yr
- Hot days in 30 yrs
- 16 days/yr
Wind risk 2/10 · Minimal
- Chance of severe wind over 30 yrs
- —
Air-quality risk 3/10 · Minor
- Unhealthy air days now
- 2 days/yr
- Unhealthy air days in 30 yrs
- 3 days/yr
Risk factors via First Street. Map © Google.
Why this score? — see what drove the B- grade
The composite is a weighted blend of 9 inputs, each scored 0–100. Each bar is that input's sub-score; the figure is the points it added to the 100-point composite (weight × sub-score).
- Cash flow +29.0/30.0
- DSCR +10.0/10.0
- 1% rule +8.0/10.0
- ARV discount +7.5/15.0
- Livability +4.2/5.0
- Rent growth +3.2/5.0
- Condition / age +2.5/5.0
- Schools +1.9/10.0
- Appreciation +0.0/10.0
$199,500
🖨 Deal sheet 📄 Offer letter ✓ Due diligence
Listing remarks MLS
Handy Holiday Special on this lovely property located just 1 1/2 blocks from Heritage Hill. This home offers 2 spacious units with 3/1 each, Dining room, Living Room, kitchen, and 2 balconies, separate utilities, separate entrances, 3 season front porch, washer/dryer hook up in basement, separate entrance to basement, and shared water meter. Enjoy spacious back yard with plenty of off street parking. Property needs minimal work, all hardwood floors have been stripped to the bare wood, and is waiting for your finishing touches. All construction materials stay for your added convenience. Close to bus lines, parks, schools, churches and less than 2 blocks from Wealthy shopping. The property faces a beautiful community garden. Seller is happy to answer any questions. There is instant equity in this gem! Seller has suffered declining health and property is in redemption period. Sold As IS! Seller is licensed Agent in the State of MI Contact Cyndi with any questions or offers 616-634-2766
Key facts
- Separate utilities
- Washer dryer hook up
- 3 season front porch
Tags
Property features AI
Finance
- Other: Lot dimensions approximately 45' x 118' (5,314 sq ft / 0.12 acres)
- Financial info: Unit 1 reported rent: $2,000; Unit 2 reported rent: $1,800
Exterior
- Parking: 4 total parking spaces
- Utilities: Public water; Public sewer / sewer available; Electricity connected; Natural gas connected
- Home design: Multi-family residential income property
- Construction: Vinyl siding; Composition roof
- Exterior features: Paved road access; Residential zoning
Interior
- Kitchen: Each unit includes a kitchen
- Bedrooms: Two 3-bedroom units (each unit with 3 bedrooms)
- Bathrooms: Each unit has 1 bathroom
- Heating & cooling: Forced-air heating; Natural gas heating
- Interior features: Full basement
Neighborhood map
What this means for you Summary
Snapshot
- This is a 6-bed/2.0-bath single-family listed at $200k.
Deal economics
- At list price, monthly cash flow is $681 ($8k/yr) — positive.
- The deal already cash-flows at list — no discount required.
- Meets the 1% rule at list price ($3k rent vs $200k).
- Cap rate 10.4% vs local median 4.5% in Grand Rapids — top-decile yield for the area; either an underpriced asset or a hidden risk that comps aren't pricing in. Stress-test before assuming the spread holds.
Location & tenants
- Location reads 83/100 on livability (#44 in MI, #939 nationally) — a professional / high-income tenant draw. Strengths: amenities A+, commute A+, cost of living A+; Watch: employment C-, crime F.
- Grand Rapids Public Schools (urban): math 15% / reading 29% proficiency, ranked #451 of 540 in MI (top 84%) — low school quality limits family demand, transient renter base, plan for 1-2y turnover; 80% free/reduced lunch — lower-income household profile, screen leases tightly.
- Market conditions: Rents rising (+2.8%/yr); 181 active listings in the ZIP; 2 comparable units currently listed for rent nearby; 2,253 units permitted in Kent County in 2024 (969 in 5+ unit buildings).
- At $2,599/mo this rent would consume 48% of the median local household income ($65k/yr) (locally 1891% of renters already pay >50% of income on rent) — very limited rent-growth headroom before tenants either downsize or default.
Forward outlook
- Local home prices are declining (-3.0%/yr); year-one equity from $1k of loan paydown is wiped out by about $6k of value loss. Plan a longer hold.
- Kent County population projected at +22% by 2050 — long-run rental-demand tailwind backs the buy-and-hold thesis.
- At projected returns (-3.0% appreciation + 2.8% rent growth), your $56k cash investment doubles in ~9 years — after that, you're playing with house money.
Negotiation context
- Only 2 days on market — expect competitive offers; lowballing is unlikely to land.
- 10 sale attempts since 24y ago with the ask held roughly flat each time — persistent listings suggest the price (not the market) is what's stuck; bring a comps-based counter.
- Current owner paid $17k; list at $200k implies a 1074% gain — meaningful room to come down on a strong offer.
Risks & watch-outs
- Watch-outs: built in 1890 — expect roof / HVAC / electrical / plumbing capex.
- Climate carrying-cost: major flood risk — expect insurance premiums to compound above CPI over the hold.
Questions for the listing agent
- Built in 1890 — when were the roof, HVAC, electrical panel, plumbing, and water heater last replaced?
- Is there a deadline driving the sale (1031 exchange, divorce, estate, relocation)? That informs how much negotiation room exists.
- Crime grade is F in this area — have there been break-ins, vandalism, or insurance claims at this property in the last 3 years? What carrier currently insures it and at what premium?
- What's the average days-on-market for RENTAL listings here right now (not sales)? A rising rental-DOM trend means longer vacancies and softer asking-rent achievability than the comps imply.
- What's the recent tenant-quality profile in this submarket — average credit score on applications, eviction rate, late-payment / NSF rate, and stable-employment percentage? A property-management company in the area should have these aggregated.
- How much new for-sale + rental construction is in the pipeline within 1–3 miles? Heavy new supply typically softens prices + rents 12–24 months out; constrained supply supports both.
Investment metrics
- 1% rule
- 1.30% ✓
- Cap rate
- 10.39%
- Cash-on-cash
- 14.64%
- DSCR
- 1.65
- GRM
- 6.4
CMA / ARV
No comps found within radius.
Projected returns pro-forma
-3.0% appreciation · 2.82% rent growth · sell at horizon
- IRR
- 4.9%
- Equity multiple
- 1.19×
- Total profit
- $10,639
- Equity at exit
- $29,746
- IRR
- 14.2%
- Equity multiple
- 2.13×
- Total profit
- $63,371
- Equity at exit
- $17,249
Cash invested: $55,860 (down + closing). Projections, not guarantees.
Landlord ↔ Tenant lean methodology
- Overall (STATE)
- 62 Landlord-Friendly
- State Michigan
- 62 Landlord-Friendly · EVEN
- County
- — inherits STATE
- City
- — inherits STATE
ZIP-level market 49503
- Rents YoY
- 2.8%
- Active inventory
- 181
- Price-to-rent
- 6.4×
Monthly cashflow live
- Estimated rent
- $2,599 medium interval (Pro) →
- Mortgage (P&I)
- −$1,046
- Tax from tax record
- −$242 /mo · $2,910/yr
- Insurance
- −$83
- HOA
- −$0
- Vacancy / Maint / Mgmt
- −$546
- Net cashflow
- $681
Break-even live
UW: 25.0% down · 7.5% · 30yr · 1.5% tax · 5.0% vac · 8.0% maint · 8.0% mgmt
Financing live
Cash to close
- Down payment
- $49,875
- Closing costs
- $5,985
- Reserves months
- —
- Total cash needed
- —
Loan-product check · same deal, 3 products live
Conventional
25% down · 7.5% · 30yr
- Down + closing
- —
- Monthly P&I
- —
- Monthly cashflow
- —
- DSCR
- —
- Eligible?
- —
Personal DTI + credit; lowest rate.
DSCR
20% down · 8.5% · 30yr
- Down + closing
- —
- Monthly P&I
- —
- Monthly cashflow
- —
- DSCR
- —
- Eligible?
- —
No personal income docs; deal must DSCR.
Hard money
10% down · 12.0% · 12mo
- Down + closing
- —
- Monthly P&I
- —
- Monthly cashflow
- —
- DSCR
- —
- Eligible?
- —
Short-term bridge; refi at stabilization.
Rent comps 2 comps
| Address | Beds | Baths | Sqft | Rent | $/sqft | DOM | Units | Dist |
|---|---|---|---|---|---|---|---|---|
| 1154 Prospect Ave SE Grand Rapids, MI | 5.0 | 2.0 | 1800 | $2,300 | $1.28 | 43d | 1 | 0.82mi |
| 117 Fuller Ave NE Grand Rapids, MI | 6.0 | 2.5 | 2160 | $3,150 | $1.46 | 43d | 1 | 1.09mi |
Listing history 20 events
-
2026-05-22$199,500 Active 997-char remark
Show marketing remark (997 chars)
Handy Holiday Special on this lovely property located just 1 1/2 blocks from Heritage Hill. This home offers 2 spacious units with 3/1 each, Dining room, Living Room, kitchen, and 2 balconies, separate utilities, separate entrances, 3 season front porch, washer/dryer hook up in basement, separate entrance to basement, and shared water meter. Enjoy spacious back yard with plenty of off street parking. Property needs minimal work, all hardwood floors have been stripped to the bare wood, and is waiting for your finishing touches. All construction materials stay for your added convenience. Close to bus lines, parks, schools, churches and less than 2 blocks from Wealthy shopping. The property faces a beautiful community garden. Seller is happy to answer any questions. There is instant equity in this gem! Seller has suffered declining health and property is in redemption period. Sold As IS! Seller is licensed Agent in the State of MI Contact Cyndi with any questions or offers 616-634-2766
-
2026-05-22$199,500 Active
Show marketing remark (997 chars)
Handy Holiday Special on this lovely property located just 1 1/2 blocks from Heritage Hill. This home offers 2 spacious units with 3/1 each, Dining room, Living Room, kitchen, and 2 balconies, separate utilities, separate entrances, 3 season front porch, washer/dryer hook up in basement, separate entrance to basement, and shared water meter. Enjoy spacious back yard with plenty of off street parking. Property needs minimal work, all hardwood floors have been stripped to the bare wood, and is waiting for your finishing touches. All construction materials stay for your added convenience. Close to bus lines, parks, schools, churches and less than 2 blocks from Wealthy shopping. The property faces a beautiful community garden. Seller is happy to answer any questions. There is instant equity in this gem! Seller has suffered declining health and property is in redemption period. Sold As IS! Seller is licensed Agent in the State of MI Contact Cyndi with any questions or offers 616-634-2766
-
2015-02-13historical
-
2015-02-13historical
-
2015-02-13historical
-
2015-02-13historical
-
2015-02-13historical
-
2015-02-13historical
-
2009-05-20$33,900
-
2008-12-31soldstatus $17,000
-
2008-10-17$19,900
-
2008-02-15$26,870
-
2007-11-05$99,900
-
2007-05-11$99,900
-
2005-11-01soldstatus $115,360
-
2005-08-15soldstatus $40,400
-
2004-09-10soldstatus $40,400
-
2004-08-10$39,900
-
2003-09-19$49,900
-
2002-01-11$64,900
ⓘ Source: listings_history table (triggers on properties + properties_extension) + one-shot
backfill from property_details.listing_events for pre-trigger history.
Tax reassessment forecast MI · Partial reset (capped growth)
- Current annual tax
- $2,910 · $242/mo
- Projected year-2 tax
- $2,991 · $249/mo
- Expected delta
- +$81/yr (+$7/mo · 2.8%)
ⓘ Screening estimate from a state-policy table — verify with the county assessor before closing.
Climate risk First Street
- Flood 6/10 Major FEMA zone X (unshaded) · 74% chance over 30 yrs
- Wildfire 1/10 Low
- Heat 2/10 Low 7 d/yr ≥96°F today · 16 d/yr by 30 yrs out
- Wind 2/10 Low
- Air quality 3/10 Moderate 2 unhealthy d/yr today · 3 by 30 yrs out
Nearby sold comps map
Loading sold comps map…
Walkable amenities ~0.75 mi
Loading nearby amenities…
Taxation est. · year 1
- Rental income
- $31,188
- − Mortgage interest
- −$11,175
- − Property taxes
- −$2,910
- − Insurance
- −$998
- − Repairs & maintenance
- −$2,495
- − Management
- −$2,495
- − Depreciation
- −$5,804
- Taxable income
- $5,312
- Est. tax owed @ 24.0%
- −$1,275
- After-tax cash flow
- $6,902/yr
For passive investors: Depreciation is non-cash, so a rental often shows a tax loss while cash-flowing — sheltering income. Rental losses are passive: they offset passive income freely, and up to $25,000/yr can offset ordinary (W-2) income if you actively participate and your MAGI is under $100k (phasing out to $0 by $150k); unused losses carry forward. On sale, claimed depreciation is recaptured at up to 25%, and gains may owe capital-gains tax (a 1031 exchange can defer both). Figures are a year-1 estimate at your 24.0% rate — not tax advice; consult a CPA.
Schools (NCES district)
- District
- Grand Rapids Public Schools
- NCES district ID
- 2616440
- Math proficiency
- 15% ▼ -5.00%
- Reading proficiency
- 29% ▼ -1.00%
- Median HH income
- $40,612
- Composite
- 18.62/100
- National rank
- #8899
- State rank
- #451 of 540 in MI
Livability — Grand Rapids
- Score
- 83/100
- State rank
- #44
- US rank
- #939
Category grades
Schools grade is shown separately in the Schools card above.
Census & demographics
- Census place
- Grand Rapids, MI
- County
- Kent County · 533,805 people
- City population
- 181,325
- Metro
- Grand Rapids-Kentwood, MI
- Population (ZIP)
- 39,489
- Household income
- $64,661
- Rent vs Own
- Severe rent burden
- 1891.0
Population outlook (Kent County) Hauer SSP2
- Today (2025)
- 712,484 people
- By 2030
- 748,618 · +5.1%
- By 2040
- 814,777 · +14.4%
- By 2050
- 868,556 · +21.9%
- By 2075
- 966,487 · +35.7%
- By 2100
- 967,975 · +35.9%
Race, ethnicity, and origin ACS 2023
- Neighborhood character
- Diverse neighborhood (Simpson 0.60)
- Race & ethnicity
- White 59% Hispanic / Latino 19% Two or more races 14% Black 14% Asian 3%
- Hispanic origin (detail)
- Mexican 11% Puerto Rican 1%
- Common ancestry
- Iranian 10% Romanian 7% Slovak 2%
- Foreign-born
- 11% · Canada, South Korea, China
- Languages at home
- 82% English-only · Spanish 15% Chinese 1%
Political lean MEDSL · Kent
- 2024 margin
- Lean D (+5.4) · D 51.8% · R 46.5% · Other 1.7%
- 2008→2024 swing
- +4.8pp toward D · 2008: 0.5pp · 2024: 5.4pp
- All cycles
- 2024: D+5.4 2020: D+6.1 2016: R+3.1 2012: R+7.9 2008: D+0.5
Not yet ingested
- Civics
- —
Market trends
- HPI YoY
- ▼ -347.22%
- Current HPI
- 312.3878
- Rent YoY
- ▲ 2.82%
- Metro
- Grand Rapids-Kentwood, MI
- State GDP YoY
- ▲ 1.37%
- F500 in state
- 28
Industry mix (Fortune 500 HQ in MI)
| Industry | F500 HQs | Revenue |
|---|---|---|
| Automotive Parts | 3 | $48B |
|
||
| Automotive | 2 | $372B |
|
||
| Chemicals | 1 | $45B |
|
||
| Automotive Retail | 1 | $29B |
|
||
| Healthcare / Medical Devices | 1 | $23B |
|
||
| Automotive Technology | 1 | $20B |
|
||
Price history
+207.4% since first listed20 events — show timeline
- 2026-05-22 Listed $199,500 REALCOMP
- 2026-05-22 Listed $199,500 MiRealSource-MiMLS
- 2015-02-13 Listing Removed — SW Michigan MLS
- 2015-02-13 Listing Removed — SW Michigan MLS
- 2015-02-13 Listing Removed — SW Michigan MLS
- 2015-02-13 Listing Removed — SW Michigan MLS
- 2015-02-13 Listing Removed — SW Michigan MLS
- 2015-02-13 Listing Removed — SW Michigan MLS
- 2009-05-20 Listed $33,900 SW Michigan MLS
- 2008-12-31 Sold (MLS) $17,000 SW Michigan MLS
- 2008-10-17 Listed $19,900 SW Michigan MLS
- 2008-02-15 Listed $26,870 SW Michigan MLS
- 2007-11-05 Listed $99,900 SW Michigan MLS
- 2007-05-11 Listed $99,900 SW Michigan MLS
- 2005-11-01 Sold (Public Records) $115,360 Public Records
- 2005-08-15 Sold (Public Records) $40,400 Public Records
- 2004-09-10 Sold (MLS) $40,400 SW Michigan MLS
- 2004-08-10 Listed $39,900 SW Michigan MLS
- 2003-09-19 Listed $49,900 SW Michigan MLS
- 2002-01-11 Listed $64,900 SW Michigan MLS
Property tax history
+6.8%/yrLatest (2025): $2,910 · -1.2% YoY. Source: county tax records.
Cash-flow waterfall
monthlySold comps — $/sqft
last 12 mo · ≤1 miLoading sold comps…