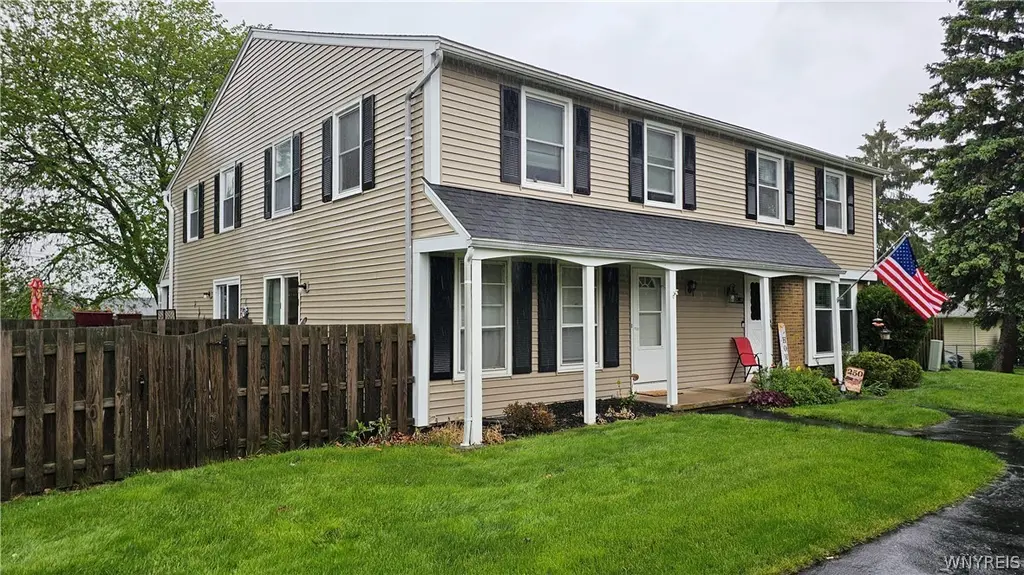
61 Springwood Dr · Webster, NY
Flood risk 1/10 · Minimal
- FEMA flood zone
- X (unshaded)
- Chance of flooding over 30 yrs
- 0.0%
- Est. flood insurance / yr
- $473 – $860
Fire risk 2/10 · Minimal
- Est. fire insurance / yr
- $691 – $1,283
Heat risk 2/10 · Minimal
- Hot days now (above 95°F)
- 7 days/yr
- Hot days in 30 yrs
- 16 days/yr
Wind risk 1/10 · Minimal
- Chance of severe wind over 30 yrs
- —
Air-quality risk 2/10 · Minimal
- Unhealthy air days now
- 1 days/yr
- Unhealthy air days in 30 yrs
- 2 days/yr
Risk factors via First Street. Map © Google.
Why this score? — see what drove the D grade
The composite is a weighted blend of 9 inputs, each scored 0–100. Each bar is that input's sub-score; the figure is the points it added to the 100-point composite (weight × sub-score).
- Cash flow +10.4/30.0
- ARV discount +7.3/15.0
- Schools +5.5/10.0
- 1% rule +5.3/10.0
- Livability +3.8/5.0
- Rent growth +3.1/5.0
- DSCR +3.0/10.0
- Condition / age +2.5/5.0
- Appreciation +0.0/10.0
$189,900
🖨 Deal sheet 📄 Offer letter ✓ Due diligence
Listing remarks
Enjoy low-maintenance living in this 2-bed / 1.5 bath townhouse in Webster, NY. Complete with the convenience of attached garage parking and a comfortable, easy-flow, 2-story layout. Bright living spaces, generous room sizes, and full basement with laundry hookups and space for storage. The private outdoor side yard space is fully-fenced with private access to/from your garage. Ideally located near Irondequoit Bay, marinas, waterfront dining, shopping, schools, and Webster’s parks and trails, this location is a sought-after choice for buyers looking for value, comfort, and convenience.
Key facts
- Full basement
- Near irondequoit bay
- Private access
Tags
Property features AI
Finance
- Financial info: Pets allowed: cats and dogs
- HOA & community: HOA with a $250 monthly fee covering common area maintenance, snow removal and trash
Exterior
- Parking: Detached garage; Open parking; 1 garage space
- Utilities: Public water connected; Sewer connected
- Home design: Two-story home; Existing/resale property
- Construction: Vinyl siding
- Exterior features: Irregular residential lot; Road frontage on city street and private road
Interior
- Kitchen: Dishwasher; Microwave
- Bedrooms: Total of 4 rooms (includes bedrooms and living spaces)
- Flooring: Carpet; Laminate; Varies by room
- Bathrooms: 1 full bathroom; 1 half bathroom; One main-level bathroom
- Heating & cooling: Gas heating with forced air; Central air conditioning
- Interior features: Dining area; Eat-in kitchen; Combined living and dining room
- Laundry & utility: Gas water heater
Neighborhood map
What this means for you Summary
Snapshot
- This is a 2-bed/1.5-bath townhouse listed at $190k.
Deal economics
- At list price, monthly cash flow is $-102 ($-1k/yr) — negative.
- To cash-flow at today's rent, offer at most $172k (9.5% below list).
- Meets the 1% rule at list price ($2k rent vs $190k).
- Recommended offer: $172k (9.5% below list) — sets the bar for cash-flow.
- Cap rate 5.7% vs local median 2.9% in Webster — top-decile yield for the area; either an underpriced asset or a hidden risk that comps aren't pricing in. Stress-test before assuming the spread holds.
Location & tenants
- Location reads 76/100 on livability (#221 in NY, #3,471 nationally) — a middle-class / working-renter tenant base. Strengths: commute A+, housing A+, health & safety A; Watch: crime D+, amenities F.
- Webster Central School District (suburban): math 62% / reading 63% proficiency, ranked #184 of 590 in NY (top 31%) — acceptable for families but not a draw, mixed tenant base, ~2y average lease; only 12% free/reduced lunch — higher-income household profile.
- Market conditions: Rents rising (+2.4%/yr); 243 active listings in the ZIP; 3 comparable units currently listed for rent nearby; rentals leasing fast (median 3d on market — plan ~1-2 weeks tenant-placement turnaround); solid renter incomes; 1,169 units permitted in Monroe County in 2024 (591 in 5+ unit buildings).
Forward outlook
- Local home prices are declining (-3.0%/yr); year-one equity from $1k of loan paydown is wiped out by about $6k of value loss. Plan a longer hold.
- Monroe County population projected to shrink 6% by 2050 — rents likely to lag national; underwrite the cash flow, not the appreciation.
Negotiation context
- It's been on market 21 days — a 2% lower offer ($187k) is reasonable based on typical stale-listing flexibility.
- Current owner paid $79k; list at $190k implies a 140% gain — meaningful room to come down on a strong offer.
Questions for the listing agent
- What do current leases actually rent for vs. the listed asking? Can we see a recent rent roll and the last 12 months of T-12 income?
- Built in 1977 — when were the roof, HVAC, electrical panel, plumbing, and water heater last replaced?
- What does the HOA fee cover, when was the last increase, and are there any pending special assessments or reserve-fund shortfalls?
- Is there a deadline driving the sale (1031 exchange, divorce, estate, relocation)? That informs how much negotiation room exists.
- Schools are B-rated — typically a magnet for longer-tenancy family renters. What's the average tenant stay here, and is there a school-zone premium baked into asking?
- Crime grade is D in this area — have there been break-ins, vandalism, or insurance claims at this property in the last 3 years? What carrier currently insures it and at what premium?
- The area grade is low — what's the realistic commute time and amenity access for the typical tenant pool here? Any planned neighborhood developments (good or bad) we should know about?
- What's the average days-on-market for RENTAL listings here right now (not sales)? A rising rental-DOM trend means longer vacancies and softer asking-rent achievability than the comps imply.
- What's the recent tenant-quality profile in this submarket — average credit score on applications, eviction rate, late-payment / NSF rate, and stable-employment percentage? A property-management company in the area should have these aggregated.
- How much new for-sale + rental construction is in the pipeline within 1–3 miles? Heavy new supply typically softens prices + rents 12–24 months out; constrained supply supports both.
Investment metrics
- 1% rule
- 1.03% ✓
- Cap rate
- 5.65%
- Cash-on-cash
- -2.30%
- DSCR
- 0.90
- GRM
- 8.1
CMA / ARV
- ARV (on-the-fly)
- $189,090
- Comps found
- 12
Show comp detail 12 sales within ~0.75 mi
| Address | Dist | Beds/Ba | Sqft | Sold | Price | $/sf | Match |
|---|---|---|---|---|---|---|---|
| 63 Springwood Dr | 0.00mi | 2/1.5 | 990 (0%) | 9mo | $199,000 | $201 | 92 |
| 4 Clearfield Dr | 0.14mi | 2/1.5 | 1,125 (+14%) | 2mo | $206,000 | $183 | 70 |
| 37 Springwood Dr | 0.06mi | 2/1.5 | 1,125 (+14%) | 7mo | $221,000 | $196 | 69 |
| 22 Springwood Dr | 0.09mi | 2/1.5 | 1,125 (+14%) | 7mo | $215,000 | $191 | 67 |
| 16 Springwood Dr | 0.10mi | 3/1.5 (+1) | 1,125 (+14%) | 2mo | $235,000 | $209 | 66 |
| 24 Springwood Dr | 0.09mi | 2/1.5 | 1,125 (+14%) | 10mo | $210,000 | $187 | 65 |
| 11 Springwood Dr | 0.13mi | 2/1.5 | 1,125 (+14%) | 8mo | $168,900 | $150 | 65 |
| 75 Southfield Dr | 0.53mi | 2/1.5 | 1,054 (+6%) | 0mo | $219,000 | $208 | 64 |
| 37 Southfield Dr | 0.58mi | 2/1.5 | 1,054 (+6%) | 3mo | $176,000 | $167 | 60 |
| 173 S Estate Dr | 0.35mi | 2/1.5 | 1,100 (+11%) | 7mo | $200,000 | $182 | 59 |
| 27 Southfield Dr | 0.59mi | 2/1.5 | 1,054 (+6%) | 5mo | $170,000 | $161 | 57 |
| 24 Huntsman | 0.31mi | 2/1.5 | 1,127 (+14%) | 10mo | $215,000 | $191 | 54 |
Match score weights: distance 35% · size 25% · config 20% · recency 20%. Top-matched comps best support the ARV.
Projected returns pro-forma
-3.0% appreciation · 2.38% rent growth · sell at horizon
- IRR
- -20.8%
- Equity multiple
- 0.28×
- Total profit
- $-38,228
- Equity at exit
- $28,315
- IRR
- -15.7%
- Equity multiple
- 0.14×
- Total profit
- $-45,587
- Equity at exit
- $16,419
Cash invested: $53,172 (down + closing). Projections, not guarantees.
Landlord ↔ Tenant lean methodology
- Overall (STATE)
- 15 Strongly Tenant-Friendly
- State New York
- 15 Strongly Tenant-Friendly · D+10
- County
- — inherits STATE
- City
- — inherits STATE
ZIP-level market 14580
- Rents YoY
- 2.4%
- Active inventory
- 243
- Price-to-rent
- 8.1×
Monthly cashflow live
- Estimated rent
- $1,948 medium interval (Pro) →
- Mortgage (P&I)
- −$996
- Tax from tax record
- −$315 /mo · $3,785/yr
- Insurance
- −$79
- HOA
- −$250
- Vacancy / Maint / Mgmt
- −$409
- Net cashflow
- $-102
Break-even live
UW: 25.0% down · 7.5% · 30yr · 1.5% tax · 5.0% vac · 8.0% maint · 8.0% mgmt
Financing live
Cash to close
- Down payment
- $47,475
- Closing costs
- $5,697
- Reserves months
- —
- Total cash needed
- —
Loan-product check · same deal, 3 products live
Conventional
25% down · 7.5% · 30yr
- Down + closing
- —
- Monthly P&I
- —
- Monthly cashflow
- —
- DSCR
- —
- Eligible?
- —
Personal DTI + credit; lowest rate.
DSCR
20% down · 8.5% · 30yr
- Down + closing
- —
- Monthly P&I
- —
- Monthly cashflow
- —
- DSCR
- —
- Eligible?
- —
No personal income docs; deal must DSCR.
Hard money
10% down · 12.0% · 12mo
- Down + closing
- —
- Monthly P&I
- —
- Monthly cashflow
- —
- DSCR
- —
- Eligible?
- —
Short-term bridge; refi at stabilization.
Rent comps 3 comps
| Address | Beds | Baths | Sqft | Rent | $/sqft | DOM | Units | Dist |
|---|---|---|---|---|---|---|---|---|
| 77 Deerhurst Ln Webster, NY | 1.0–2.0 | 1.0–1.5 | 1070 | $2,000 | $1.87 | 3d | 21 | 0.29mi |
| 1205 Rousseau Dr Webster, NY | 1.0–3.0 | 1.0–2.0 | 1143 | $2,206 | $1.93 | 3d | 3 | 0.37mi |
| 1017 Waverton Cir Webster, NY | 1.0 | 1.0 | 850 | $1,712 | $2.01 | 3d | 2 | 1.17mi |
HOA detail
- Monthly dues
- $250 · $3,000/yr
- Likely covers
- water
Listing history 18 events
-
2026-06-18days on market $189,900 Active 21 DOM
-
2026-06-17days on market $189,900 Active 20 DOM
-
2026-06-16days on market $189,900 Active 19 DOM
-
2026-06-15days on market $189,900 Active 18 DOM
-
2026-06-13days on market $189,900 Active 16 DOM
-
2026-06-10days on market $189,900 Active 13 DOM
-
2026-06-09days on market $189,900 Active 12 DOM
-
2026-06-09days on market $189,900 Active 11 DOM
-
2026-06-07days on market $189,900 Active 10 DOM
-
2026-06-05days on market $189,900 Active 7 DOM
-
2026-06-03days on market $189,900 Active 6 DOM
-
2026-06-03days on market $189,900 Active 5 DOM
-
2026-06-01days on market $189,900 Active 4 DOM
-
2026-05-31days on market $189,900 Active 3 DOM
-
2026-05-27$189,900 Active
-
2004-08-02soldstatus $79,000
-
2003-10-29soldstatus $75,000
-
2001-06-28soldstatus $60,500
ⓘ Source: listings_history table (triggers on properties + properties_extension) + one-shot
backfill from property_details.listing_events for pre-trigger history.
Tax reassessment forecast NY · Partial reset (capped growth)
- Current annual tax
- $3,785 · $315/mo
- Projected year-2 tax
- $3,785 · $315/mo
- Expected delta
- $0/yr ($0/mo · -0.0%)
ⓘ Screening estimate from a state-policy table — verify with the county assessor before closing.
Climate risk First Street
- Flood 1/10 Low FEMA zone X (unshaded) · 0% chance over 30 yrs
- Wildfire 2/10 Low
- Heat 2/10 Low 7 d/yr ≥95°F today · 16 d/yr by 30 yrs out
- Wind 1/10 Low
- Air quality 2/10 Low 1 unhealthy d/yr today · 2 by 30 yrs out
Nearby sold comps map
Loading sold comps map…
Walkable amenities ~0.75 mi
Loading nearby amenities…
Taxation est. · year 1
- Rental income
- $23,372
- − Mortgage interest
- −$10,637
- − Property taxes
- −$3,785
- − Insurance
- −$950
- − Repairs & maintenance
- −$1,870
- − Management
- −$1,870
- − HOA
- −$3,000
- − Depreciation
- −$5,524
- Taxable loss
- −$4,264
- Est. tax savings @ 24.0%
- +$1,023
- After-tax cash flow
- $-198/yr
For passive investors: Depreciation is non-cash, so a rental often shows a tax loss while cash-flowing — sheltering income. Rental losses are passive: they offset passive income freely, and up to $25,000/yr can offset ordinary (W-2) income if you actively participate and your MAGI is under $100k (phasing out to $0 by $150k); unused losses carry forward. On sale, claimed depreciation is recaptured at up to 25%, and gains may owe capital-gains tax (a 1031 exchange can defer both). Figures are a year-1 estimate at your 24.0% rate — not tax advice; consult a CPA.
Schools (NCES district)
- District
- Webster Central School District
- NCES district ID
- 3630360
- Math proficiency
- 62% ▼ -3.00%
- Reading proficiency
- 63% ▲ 6.00%
- Median HH income
- $71,221
- Composite
- 55.18/100
- National rank
- #1273
- State rank
- #184 of 590 in NY
Livability — Webster
- Score
- 76/100
- State rank
- #221
- US rank
- #3471
Category grades
Schools grade is shown separately in the Schools card above.
Census & demographics
- County
- Monroe County · 674,131 people
- City population
- 54,180
- Metro
- Rochester, NY
- Population (ZIP)
- 54,180
- Household income
- $98,310
- Rent vs Own
- Severe rent burden
- 1325.0
Population outlook (Monroe County) Hauer SSP2
- Today (2025)
- 759,460 people
- By 2030
- 757,154 · -0.3%
- By 2040
- 740,644 · -2.5%
- By 2050
- 714,443 · -5.9%
- By 2075
- 645,883 · -15.0%
- By 2100
- 547,084 · -28.0%
Race, ethnicity, and origin ACS 2023
- Neighborhood character
- Predominantly White (88%)
- Race & ethnicity
- White 88% Two or more races 5% Hispanic / Latino 3% Asian 3% Black 2%
- Common ancestry
- Romanian 4% Iranian 3% Subsaharan African 3%
- Foreign-born
- 8% · Canada, China
- Languages at home
- 91% English-only · Other Indo-European 3% Russian/Polish/Slavic 2% Spanish 2%
Political lean MEDSL · Monroe
- 2024 margin
- D (+19.1) · D 59.5% · R 40.5%
- 2008→2024 swing
- +1.4pp toward D · 2008: 17.7pp · 2024: 19.1pp
- All cycles
- 2024: D+19.1 2020: D+21.0 2016: D+14.1 2012: D+17.4 2008: D+17.7
Not yet ingested
- Civics
- —
Market trends
- HPI YoY
- ▼ -154.52%
- Current HPI
- 266.2145
- Rent YoY
- ▲ 2.38%
- Metro
- Rochester, NY
- State GDP YoY
- ▲ 2.60%
- F500 in state
- 92
Industry mix (Fortune 500 HQ in NY)
| Industry | F500 HQs | Revenue |
|---|---|---|
| Financial Services | 10 | $950B |
|
||
| Consumer Goods | 9 | $162B |
|
||
| Insurance | 4 | $225B |
|
||
| Telecommunications | 2 | $144B |
|
||
| Pharmaceuticals | 2 | $112B |
|
||
| Media / Entertainment | 2 | $69B |
|
||
Price history
+213.9% since first listed4 events — show timeline
- 2026-05-27 Listed $189,900 WNYREIS
- 2004-08-02 Sold (Public Records) $79,000 Public Records
- 2003-10-29 Sold (Public Records) $75,000 Public Records
- 2001-06-28 Sold (Public Records) $60,500 Public Records
Property tax history
+1.8%/yrLatest (2025): $3,785 · +0.2% YoY. Source: county tax records.
Cash-flow waterfall
monthlySold comps — $/sqft
last 12 mo · ≤1 miLoading sold comps…