None · Ocala Estates, FL
Flood risk 1/10 · Minimal
- FEMA flood zone
- X (unshaded)
- Chance of flooding over 30 yrs
- 0.0%
- Est. flood insurance / yr
- $507 – $1,088
Fire risk 4/10 · Minor
- Est. fire insurance / yr
- $947 – $1,759
Heat risk 8/10 · Major
- Hot days now (above 107°F)
- 7 days/yr
- Hot days in 30 yrs
- 22 days/yr
Wind risk 9/10 · Severe
- Chance of severe wind over 30 yrs
- 99.0%
Air-quality risk 3/10 · Minor
- Unhealthy air days now
- 3 days/yr
- Unhealthy air days in 30 yrs
- 3 days/yr
Risk factors via First Street. Map © Google.
Why this score? — see what drove the C+ grade
The composite is a weighted blend of 9 inputs, each scored 0–100. Each bar is that input's sub-score; the figure is the points it added to the 100-point composite (weight × sub-score).
- Cash flow +30.0/30.0
- DSCR +10.0/10.0
- 1% rule +8.5/10.0
- Rent growth +5.0/5.0
- Schools +3.6/10.0
- Livability +2.5/5.0
- Condition / age +2.5/5.0
- ARV discount +0.0/15.0
- Appreciation +0.0/10.0
$120,000
🖨 Deal sheet (PDF) 📄 Offer letter ✓ Due diligence
Listing remarks MLS
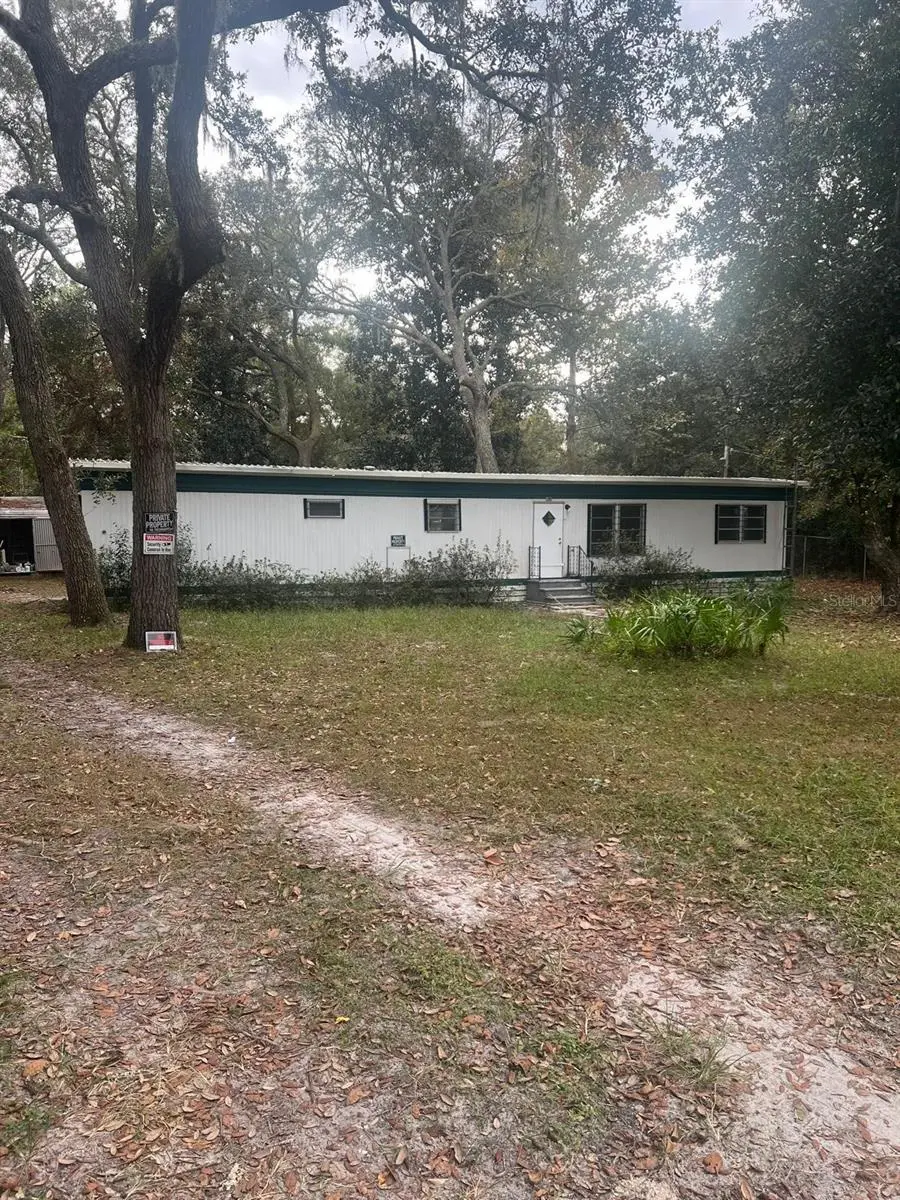
Investor opportunity in desirable Northwest Ocala! This unique offering includes a total of 3 combined lots, providing exceptional space, flexibility, and future potential. The 2-bedroom, 2-bathroom manufactured home features a large open living area filled with abundant natural light, a functional kitchen layout, and an oversized yard shaded by mature trees. With three lots included in the sale, there is plenty of room to expand, build additional structures (subject to county approval), create outdoor living spaces, or design your own private garden retreat. Whether you’re looking to renovate and add value, hold as a long-term investment, or maximize the land potential, this property offers multiple possibilities. Conveniently located near Silver Springs State Park, local springs, scenic trails, and natural attractions, while still just minutes from shopping, dining, and major roadways. Enjoy a peaceful setting with easy access to everyday conveniences. Priced to reflect cosmetic updates needed. Sold AS-IS. Cash or conventional financing preferred.
Key facts
- Oversized yard
- Open living area
- Combined lots
Tags
Neighborhood map
What this means for you Summary
Snapshot
- This is a 2-bed/1.5-bath manufactured listed at $120k.
Deal economics
- At list price, monthly cash flow is $461 ($6k/yr) — positive.
- The deal already cash-flows at list — no discount required.
- Meets the 1% rule at list price ($2k rent vs $120k).
- Recommended offer: $106k (12.0% below list) — sets the bar for market timing.
Location & tenants
- Location reads: area grade C — affects rentability + tenant quality, not the cash-flow math above.
- Marion (rural): math 42% / reading 43% proficiency, ranked #61 of 73 in FL (top 84%) — families likely to look elsewhere, expect single-tenant / working-renter base with shorter leases; 61% free/reduced lunch — lower-income household profile, screen leases tightly.
- Market conditions: Rents rising fast (+11.1%/yr); 663 active listings in the ZIP; 7,071 units permitted in Marion County in 2024 (534 in 5+ unit buildings).
Forward outlook
- Local home prices are declining (-3.0%/yr); year-one equity from $830 of loan paydown is wiped out by about $4k of value loss. Plan a longer hold.
- Marion County population projected at +13% by 2050 — modest demand growth; plan on rents tracking national, not racing it.
- At projected returns (-3.0% appreciation + 8.0% rent growth), your $34k cash investment doubles in ~6 years — after that, you're playing with house money.
Negotiation context
- It's been on market 124 days — a 12% lower offer ($106k) is reasonable based on typical stale-listing flexibility.
- 3 sale attempts since 2y ago; this cycle's ask has dropped $15k (11%) from the opening price — seller is motivated, your offer sets the floor, not the list.
- Current owner paid $89k; 35% above their basis — modest negotiation headroom, anchor on the comps not their cost.
Risks & watch-outs
- Climate carrying-cost: severe wind risk, 99% chance of damaging wind over 30y; extreme-heat days projected 7→22/yr by 2055 (HVAC capex compounding) — expect insurance premiums to compound above CPI over the hold.
Questions for the listing agent
- It's been on market 124 days. Have you received any prior offers? Is the seller open to a 12% concession, seller financing, or rate buy-down credit?
- Built in 1972 — when were the roof, HVAC, electrical panel, plumbing, and water heater last replaced?
- Why hasn't it sold? Are there any deal-killer items the seller is aware of (foundation, flood, title, zoning, code violations)?
- Is there a deadline driving the sale (1031 exchange, divorce, estate, relocation)? That informs how much negotiation room exists.
- What's the average days-on-market for RENTAL listings here right now (not sales)? A rising rental-DOM trend means longer vacancies and softer asking-rent achievability than the comps imply.
- What's the recent tenant-quality profile in this submarket — average credit score on applications, eviction rate, late-payment / NSF rate, and stable-employment percentage? A property-management company in the area should have these aggregated.
- How much new for-sale + rental construction is in the pipeline within 1–3 miles? Heavy new supply typically softens prices + rents 12–24 months out; constrained supply supports both.
Investment metrics
- 1% rule
- 1.35% ✓
- Cap rate
- 10.90%
- Cash-on-cash
- 16.46%
- DSCR
- 1.73
- GRM
- 6.2
CMA / ARV
- ARV (median comp)
- $94,193
- List price
- $120,000
- Delta
- 27.40%
- Verdict
- OVERPRICED
- Comps
- 1 within 2.0 mi
Show comp detail 1 sale within ~0.75 mi
| Address | Dist | Beds/Ba | Sqft | Sold | Price | $/sf | Match |
|---|---|---|---|---|---|---|---|
| 956 NW 110th Ct | 0.66mi | 2/1.0 | 782 (+9%) | 7mo | $95,000 | $121 | 47 |
Match score weights: distance 35% · size 25% · config 20% · recency 20%. Top-matched comps best support the ARV.
Projected returns pro-forma
-3.0% appreciation · 8.0% rent growth · sell at horizon
- IRR
- 13.0%
- Equity multiple
- 1.55×
- Total profit
- $18,507
- Equity at exit
- $17,892
- IRR
- 25.5%
- Equity multiple
- 3.77×
- Total profit
- $93,039
- Equity at exit
- $10,375
Cash invested: $33,600 (down + closing). Projections, not guarantees.
Landlord ↔ Tenant lean methodology
- Overall (STATE)
- 87 Strongly Landlord-Friendly
- State Florida
- 87 Strongly Landlord-Friendly · R+3
- County
- — inherits STATE
- City
- — inherits STATE
ZIP-level market 34482
- Rents YoY
- 11.1%
- Active inventory
- 663
- Price-to-rent
- 6.2×
Monthly cashflow live
- Estimated rent
- $1,623 medium interval (Pro) →
- Mortgage (P&I)
- −$629
- Tax from tax record
- −$142 /mo · $1,708/yr
- Insurance
- −$50
- HOA
- −$0
- Vacancy / Maint / Mgmt
- −$341
- Net cashflow
- $461
Break-even live
Sensitivity live
| Price | -10% $529 | -5% $495 | +0% $461 | +5% $427 | +10% $393 |
|---|---|---|---|---|---|
| Rent | -10% $333 | -5% $397 | +0% $461 | +5% $525 | +10% $589 |
| Rate | -1.0pp $521 | -0.5pp $491 | base $461 | +0.5pp $430 | +1.0pp $398 |
UW: 25.0% down · 7.5% · 30yr · 1.5% tax · 5.0% vac · 8.0% maint · 8.0% mgmt
Financing live
Cash to close
- Down payment
- $30,000
- Closing costs
- $3,600
- Reserves months
- —
- Total cash needed
- —
Loan-product check · same deal, 3 products live
Conventional
25% down · 7.5% · 30yr
- Down + closing
- —
- Monthly P&I
- —
- Monthly cashflow
- —
- DSCR
- —
- Eligible?
- —
Personal DTI + credit; lowest rate.
DSCR
20% down · 8.5% · 30yr
- Down + closing
- —
- Monthly P&I
- —
- Monthly cashflow
- —
- DSCR
- —
- Eligible?
- —
No personal income docs; deal must DSCR.
Hard money
10% down · 12.0% · 12mo
- Down + closing
- —
- Monthly P&I
- —
- Monthly cashflow
- —
- DSCR
- —
- Eligible?
- —
Short-term bridge; refi at stabilization.
Listing history 25 events
-
2026-06-18days on market $120,000 Active 124 DOM
-
2026-06-17days on market $120,000 Active 123 DOM
-
2026-06-16days on market $120,000 Active 122 DOM
-
2026-06-15days on market $120,000 Active 121 DOM
-
2026-06-14days on market $120,000 Active 119 DOM
-
2026-06-13days on market $120,000 Active 118 DOM
-
2026-06-10days on market $120,000 Active 116 DOM
-
2026-06-09days on market $120,000 Active 115 DOM
-
2026-06-08days on market $120,000 Active 114 DOM
-
2026-06-07days on market $120,000 Active 113 DOM
-
2026-06-03pricedays on market $120,000 Active 109 DOM
-
2026-06-02days on market $130,000 Active 108 DOM
-
2026-06-01days on market $130,000 Active 107 DOM
-
2026-05-31days on market $130,000 Active 106 DOM
-
2026-05-30days on market $130,000 Active 105 DOM
-
2026-02-17price $130,000 1074-char remark
Show marketing remark (1074 chars)
Investor opportunity in desirable Northwest Ocala! This unique offering includes a total of 3 combined lots, providing exceptional space, flexibility, and future potential. The 2-bedroom, 2-bathroom manufactured home features a large open living area filled with abundant natural light, a functional kitchen layout, and an oversized yard shaded by mature trees. With three lots included in the sale, there is plenty of room to expand, build additional structures (subject to county approval), create outdoor living spaces, or design your own private garden retreat. Whether you’re looking to renovate and add value, hold as a long-term investment, or maximize the land potential, this property offers multiple possibilities. Conveniently located near Silver Springs State Park, local springs, scenic trails, and natural attractions, while still just minutes from shopping, dining, and major roadways. Enjoy a peaceful setting with easy access to everyday conveniences. Priced to reflect cosmetic updates needed. Sold AS-IS. Cash or conventional financing preferred.
-
2026-02-14$135,000 Active 1074-char remark
Show marketing remark (1074 chars)
Investor opportunity in desirable Northwest Ocala! This unique offering includes a total of 3 combined lots, providing exceptional space, flexibility, and future potential. The 2-bedroom, 2-bathroom manufactured home features a large open living area filled with abundant natural light, a functional kitchen layout, and an oversized yard shaded by mature trees. With three lots included in the sale, there is plenty of room to expand, build additional structures (subject to county approval), create outdoor living spaces, or design your own private garden retreat. Whether you’re looking to renovate and add value, hold as a long-term investment, or maximize the land potential, this property offers multiple possibilities. Conveniently located near Silver Springs State Park, local springs, scenic trails, and natural attractions, while still just minutes from shopping, dining, and major roadways. Enjoy a peaceful setting with easy access to everyday conveniences. Priced to reflect cosmetic updates needed. Sold AS-IS. Cash or conventional financing preferred.
-
2025-04-10historical
-
2024-12-13price $110,000
-
2024-11-11$120,000 Active
-
2024-09-04soldstatus $89,000
-
2024-08-30soldstatus $89,000 Closed
-
2024-08-17status Pending
-
2024-08-09$89,900 Active
-
1984-02-01soldstatus $20,000
ⓘ Source: listings_history table (triggers on properties + properties_extension) + one-shot
backfill from property_details.listing_events for pre-trigger history.
Tax reassessment forecast FL · Resets to sale price
- Current annual tax
- $1,708 · $142/mo
- Projected year-2 tax
- $1,708 · $142/mo
- Expected delta
- $0/yr ($0/mo · 0.0%)
ⓘ Screening estimate from a state-policy table — verify with the county assessor before closing.
Climate risk First Street
- Flood 1/10 Low FEMA zone X (unshaded) · 0% chance over 30 yrs
- Wildfire 4/10 Moderate
- Heat 8/10 Severe 7 d/yr ≥107°F today · 22 d/yr by 30 yrs out
- Wind 9/10 Extreme 99% chance of damaging wind over 30 yrs
- Air quality 3/10 Moderate 3 unhealthy d/yr today · 3 by 30 yrs out
Nearby sold comps map
Loading sold comps map…
Walkable amenities ~0.75 mi
Loading nearby amenities…
Taxation est. · year 1
- Rental income
- $19,480
- − Mortgage interest
- −$6,722
- − Property taxes
- −$1,708
- − Insurance
- −$600
- − Repairs & maintenance
- −$1,558
- − Management
- −$1,558
- − Depreciation
- −$3,491
- Taxable income
- $3,843
- Est. tax owed @ 24.0%
- −$922
- After-tax cash flow
- $4,608/yr
For passive investors: Depreciation is non-cash, so a rental often shows a tax loss while cash-flowing — sheltering income. Rental losses are passive: they offset passive income freely, and up to $25,000/yr can offset ordinary (W-2) income if you actively participate and your MAGI is under $100k (phasing out to $0 by $150k); unused losses carry forward. On sale, claimed depreciation is recaptured at up to 25%, and gains may owe capital-gains tax (a 1031 exchange can defer both). Figures are a year-1 estimate at your 24.0% rate — not tax advice; consult a CPA.
Schools (NCES district)
- District
- Marion
- NCES district ID
- 1201260
- Math proficiency
- 42% ▼ -7.00%
- Reading proficiency
- 43% ▼ -4.00%
- Median HH income
- $40,015
- Composite
- 35.61/100
- National rank
- #4890
- State rank
- #61 of 73 in FL
Livability — Ocala Estates
No livability data for this city. (Only ~50 U.S. cities are tracked.)
Census & demographics
- Census place
- Ocala Estates, FL
- County
- Marion County · 315,796 people
- Metro
- Ocala, FL
- Population (ZIP)
- 22,807
- Household income
- $65,901
- Rent vs Own
- Severe rent burden
- 282.0
Population outlook (Marion County) Hauer SSP2
- Today (2025)
- 365,905 people
- By 2030
- 376,768 · +3.0%
- By 2040
- 396,555 · +8.4%
- By 2050
- 412,723 · +12.8%
- By 2075
- 446,090 · +21.9%
- By 2100
- 436,193 · +19.2%
Race, ethnicity, and origin ACS 2023
- Neighborhood character
- Majority White (63%)
- Race & ethnicity
- White 63% Hispanic / Latino 19% Black 14% Two or more races 12%
- Hispanic origin (detail)
- Mexican 6% Puerto Rican 9% Cuban 2%
- Common ancestry
- Lithuanian 2% Romanian 2% Slovak 2%
- Foreign-born
- 10% · Canada
- Languages at home
- 81% English-only · Spanish 16% Other Indo-European 1%
Political lean MEDSL · Marion
- 2024 margin
- Solid R (+31.6) · D 33.8% · R 65.5%
- 2008→2024 swing
- -20.0pp toward R · 2008: -11.6pp · 2024: -31.6pp
- All cycles
- 2024: R+31.6 2020: R+25.9 2016: R+26.2 2012: R+16.2 2008: R+11.6
Not yet ingested
- Civics
- —
Market trends
- HPI YoY
- ▼ -133.62%
- Current HPI
- 194.3857
- Rent YoY
- ▲ 11.12%
- Metro
- Ocala, FL
- State GDP YoY
- ▲ 3.28%
- F500 in state
- 36
Industry mix (Fortune 500 HQ in FL)
| Industry | F500 HQs | Revenue |
|---|---|---|
| Industrial Technology | 2 | $29B |
|
||
| Insurance | 2 | $17B |
|
||
| Retail | 1 | $60B |
|
||
| Technology Distribution | 1 | $58B |
|
||
| Homebuilding | 1 | $35B |
|
||
| Technology Manufacturing | 1 | $35B |
|
||
Price history
+550.0% since first listed10 events — show timeline
- 2026-02-17 Price Changed $130,000 Stellar MLS as Distributed by MLS Grid
- 2026-02-14 Listed $135,000 Stellar MLS as Distributed by MLS Grid
- 2025-04-10 Listing Removed — Stellar MLS as Distributed by MLS Grid
- 2024-12-13 Price Changed $110,000 Stellar MLS as Distributed by MLS Grid
- 2024-11-11 Listed $120,000 Stellar MLS as Distributed by MLS Grid
- 2024-09-04 Sold (Public Records) $89,000 Public Records
- 2024-08-30 Sold (MLS) $89,000 Stellar MLS as Distributed by MLS Grid
- 2024-08-17 Pending — Stellar MLS as Distributed by MLS Grid
- 2024-08-09 Listed $89,900 Stellar MLS as Distributed by MLS Grid
- 1984-02-01 Sold (Public Records) $20,000 Public Records
Property tax history
+11.1%/yrLatest (2025): $1,708 · +70.1% YoY. Source: county tax records.
Cash-flow waterfall
monthlySold comps — $/sqft
last 12 mo · ≤1 miLoading sold comps…