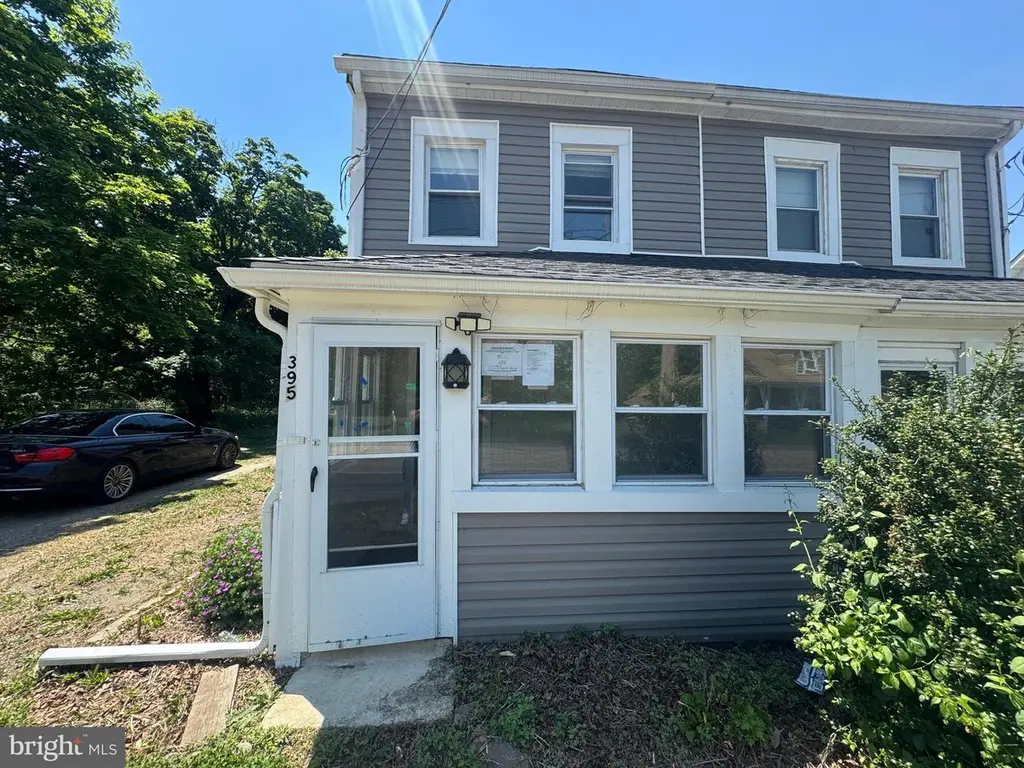
395 Tansboro Rd · Atco, NJ
Flood risk 1/10 · Minimal
- FEMA flood zone
- X (unshaded)
- Chance of flooding over 30 yrs
- 0.0%
- Est. flood insurance / yr
- $507 – $1,088
Fire risk 6/10 · Moderate
- Est. fire insurance / yr
- $526 – $976
Heat risk 6/10 · Moderate
- Hot days now (above 103°F)
- 7 days/yr
- Hot days in 30 yrs
- 14 days/yr
Wind risk 6/10 · Moderate
- Chance of severe wind over 30 yrs
- 67.0%
Air-quality risk 4/10 · Minor
- Unhealthy air days now
- 4 days/yr
- Unhealthy air days in 30 yrs
- 6 days/yr
Risk factors via First Street. Map © Google.
Why this score? — see what drove the C- grade
The composite is a weighted blend of 9 inputs, each scored 0–100. Each bar is that input's sub-score; the figure is the points it added to the 100-point composite (weight × sub-score).
- Cash flow +22.3/30.0
- ARV discount +7.5/15.0
- DSCR +7.1/10.0
- 1% rule +6.7/10.0
- Rent growth +2.5/5.0
- Livability +2.5/5.0
- Condition / age +2.5/5.0
- Schools +2.3/10.0
- Appreciation +0.0/10.0
$165,000
🖨 Deal sheet 📄 Offer letter ✓ Due diligence
Listing remarks MLS
395 Tansboro is Newly renovated and ready for sale! 397 is also for sale, right side of this twin, currently rented for 1500/mo. 395 Features: Bread New Well - New Kitchen - New Bath - Possible Subdivision to add 2 more units - LVP Flooring - New carpet - Freshly painted - New EE Windows - New 6 panel doors - Hi-Hat Lightening (1 hi-hat costs $4/year if left on every day of the year) - New baseboards/Trim throughout - New Frigidaire appliance pack - Level II Granite- New 30 year roof and so much more! Thanks for checking us out!
Key facts
- Built 1890
- Listed 19 days
Property features AI
Finance
- Other: Ownership: fee simple
Exterior
- Parking: Driveway; On-street parking
- Utilities: Well water; On-site septic; Electric-powered cooling
- Home design: Semi-detached home; Above-grade finished area reported as 777 (per assessor)
- Construction: Frame construction; Block foundation; Above- and below-grade structures noted
- Exterior features: Lot dimensions approximately 47 x 226; No tidal water on the lot
Interior
- Bedrooms: Two bedrooms on the main level
- Bathrooms: One full bathroom on the main level; One full bathroom total
- Heating & cooling: 90% forced air heating; Heating fuel: natural gas and oil; Central air conditioning (electric); Natural gas hot water
- Interior features: Basement with connecting stairway; Two or more exit points for accessibility
Neighborhood map
What this means for you Summary
Snapshot
- This is a 2-bed/1.0-bath townhouse listed at $165k.
Deal economics
- At list price, monthly cash flow is $272 ($3k/yr) — positive.
- The deal already cash-flows at list — no discount required.
- Meets the 1% rule at list price ($2k rent vs $165k).
- Recommended offer: $163k (1.5% below list) — sets the bar for market timing.
- Cap rate 8.3% vs local median 4.0% in Atco — top-decile yield for the area; either an underpriced asset or a hidden risk that comps aren't pricing in. Stress-test before assuming the spread holds.
Location & tenants
- Location reads: area grade C — affects rentability + tenant quality, not the cash-flow math above.
- Winslow Township School District (suburban): math 11% / reading 36% proficiency, ranked #387 of 472 in NJ (top 82%) — low school quality limits family demand, transient renter base, plan for 1-2y turnover.
- Market conditions: 125 active listings in the ZIP; 2 comparable units currently listed for rent nearby; 1,018 units permitted in Camden County in 2024 (509 in 5+ unit buildings).
Forward outlook
- Local home prices are declining (-3.0%/yr); year-one equity from $1k of loan paydown is wiped out by about $5k of value loss. Plan a longer hold.
- Camden County population projected to shrink 8% by 2050 — rents likely to lag national; underwrite the cash flow, not the appreciation.
Negotiation context
- It's been on market 20 days — a 2% lower offer ($163k) is reasonable based on typical stale-listing flexibility.
- 4 sale attempts since 26y ago with the ask held roughly flat each time — persistent listings suggest the price (not the market) is what's stuck; bring a comps-based counter.
Risks & watch-outs
- Watch-outs: built in 1890 — expect roof / HVAC / electrical / plumbing capex.
- Climate carrying-cost: major wind risk, 67% chance of damaging wind over 30y; major wildfire risk; extreme-heat days projected 7→14/yr by 2055 (HVAC capex compounding) — expect insurance premiums to compound above CPI over the hold.
Questions for the listing agent
- Built in 1890 — when were the roof, HVAC, electrical panel, plumbing, and water heater last replaced?
- Is there a deadline driving the sale (1031 exchange, divorce, estate, relocation)? That informs how much negotiation room exists.
- What's the average days-on-market for RENTAL listings here right now (not sales)? A rising rental-DOM trend means longer vacancies and softer asking-rent achievability than the comps imply.
- What's the recent tenant-quality profile in this submarket — average credit score on applications, eviction rate, late-payment / NSF rate, and stable-employment percentage? A property-management company in the area should have these aggregated.
- How much new for-sale + rental construction is in the pipeline within 1–3 miles? Heavy new supply typically softens prices + rents 12–24 months out; constrained supply supports both.
Investment metrics
- 1% rule
- 1.17% ✓
- Cap rate
- 8.27%
- Cash-on-cash
- 7.08%
- DSCR
- 1.31
- GRM
- 7.1
CMA / ARV
No comps found within radius.
Projected returns pro-forma
-3.0% appreciation · 3.0% rent growth · sell at horizon
- IRR
- -5.4%
- Equity multiple
- 0.80×
- Total profit
- $-9,284
- Equity at exit
- $24,602
- IRR
- 4.3%
- Equity multiple
- 1.32×
- Total profit
- $14,669
- Equity at exit
- $14,266
Cash invested: $46,200 (down + closing). Projections, not guarantees.
Landlord ↔ Tenant lean methodology
- Overall (STATE)
- 21 Tenant-Leaning
- State New Jersey
- 21 Tenant-Leaning · D+6
- County
- — inherits STATE
- City
- — inherits STATE
ZIP-level market 08009
- Home prices YoY
- -23.1%
- Active inventory
- 125
- Price-to-rent
- 7.1×
Monthly cashflow live
- Estimated rent
- $1,936 medium interval (Pro) →
- Mortgage (P&I)
- −$865
- Tax from tax record
- −$323 /mo · $3,875/yr
- Insurance
- −$69
- HOA
- −$0
- Vacancy / Maint / Mgmt
- −$407
- Net cashflow
- $272
Break-even live
UW: 25.0% down · 7.5% · 30yr · 1.5% tax · 5.0% vac · 8.0% maint · 8.0% mgmt
Financing live
Cash to close
- Down payment
- $41,250
- Closing costs
- $4,950
- Reserves months
- —
- Total cash needed
- —
Loan-product check · same deal, 3 products live
Conventional
25% down · 7.5% · 30yr
- Down + closing
- —
- Monthly P&I
- —
- Monthly cashflow
- —
- DSCR
- —
- Eligible?
- —
Personal DTI + credit; lowest rate.
DSCR
20% down · 8.5% · 30yr
- Down + closing
- —
- Monthly P&I
- —
- Monthly cashflow
- —
- DSCR
- —
- Eligible?
- —
No personal income docs; deal must DSCR.
Hard money
10% down · 12.0% · 12mo
- Down + closing
- —
- Monthly P&I
- —
- Monthly cashflow
- —
- DSCR
- —
- Eligible?
- —
Short-term bridge; refi at stabilization.
Rent comps 2 comps
| Address | Beds | Baths | Sqft | Rent | $/sqft | DOM | Units | Dist |
|---|---|---|---|---|---|---|---|---|
| 10 Taylor Woods Blvd Berlin, NJ | 1.0 | 1.0 | 825 | $1,699 | $2.06 | 1d | 1 | 0.58mi |
| 1 Sunrise Rd Berlin, NJ | 1.0–2.0 | 1.0–2.0 | 973 | $2,577 | $2.65 | 1d | 19 | 1.33mi |
Listing history 13 events
-
2026-06-18days on market $165,000 Active 20 DOM
-
2026-06-17days on market $165,000 Active 19 DOM
-
2026-06-16days on market $165,000 Active 18 DOM
-
2026-06-15days on market $165,000 Active 17 DOM
-
2026-06-13days on market $165,000 Active 15 DOM
-
2026-06-09days on market $165,000 Active 11 DOM
-
2026-06-08days on market $165,000 Active 10 DOM
-
2026-06-07days on market $165,000 Active 9 DOM
-
2026-06-04days on market $165,000 Active 6 DOM
-
2026-06-03days on market $165,000 Active 5 DOM
-
2026-06-02days on market $165,000 Active 4 DOM
-
2026-06-01days on market $165,000 Active 3 DOM
-
2026-05-31days on market $165,000 Active 2 DOM
ⓘ Source: listings_history table (triggers on properties + properties_extension) + one-shot
backfill from property_details.listing_events for pre-trigger history.
Tax reassessment forecast NJ · Partial reset (capped growth)
- Current annual tax
- $3,875 · $323/mo
- Projected year-2 tax
- $3,992 · $333/mo
- Expected delta
- +$117/yr (+$10/mo · 3.0%)
ⓘ Screening estimate from a state-policy table — verify with the county assessor before closing.
Climate risk First Street
- Flood 1/10 Low FEMA zone X (unshaded) · 0% chance over 30 yrs
- Wildfire 6/10 Major
- Heat 6/10 Major 7 d/yr ≥103°F today · 14 d/yr by 30 yrs out
- Wind 6/10 Major 67% chance of damaging wind over 30 yrs
- Air quality 4/10 Moderate 4 unhealthy d/yr today · 6 by 30 yrs out
Nearby sold comps map
Loading sold comps map…
Walkable amenities ~0.75 mi
Loading nearby amenities…
Taxation est. · year 1
- Rental income
- $23,231
- − Mortgage interest
- −$9,243
- − Property taxes
- −$3,875
- − Insurance
- −$825
- − Repairs & maintenance
- −$1,858
- − Management
- −$1,858
- − Depreciation
- −$4,800
- Taxable income
- $772
- Est. tax owed @ 24.0%
- −$185
- After-tax cash flow
- $3,084/yr
For passive investors: Depreciation is non-cash, so a rental often shows a tax loss while cash-flowing — sheltering income. Rental losses are passive: they offset passive income freely, and up to $25,000/yr can offset ordinary (W-2) income if you actively participate and your MAGI is under $100k (phasing out to $0 by $150k); unused losses carry forward. On sale, claimed depreciation is recaptured at up to 25%, and gains may owe capital-gains tax (a 1031 exchange can defer both). Figures are a year-1 estimate at your 24.0% rate — not tax advice; consult a CPA.
Schools (NCES district)
- District
- Winslow Township School District
- NCES district ID
- 3418060
- Math proficiency
- 11% ▼ -17.00%
- Reading proficiency
- 36% ▼ -5.00%
- Median HH income
- $70,254
- Composite
- 22.65/100
- National rank
- #8057
- State rank
- #387 of 472 in NJ
Livability — Atco
No livability data for this city. (Only ~50 U.S. cities are tracked.)
Census & demographics
- City population
- 10,946
- Population (ZIP)
- 14,967
Population outlook (Camden County) Hauer SSP2
- Today (2025)
- 507,964 people
- By 2030
- 502,182 · -1.1%
- By 2040
- 485,602 · -4.4%
- By 2050
- 465,630 · -8.3%
- By 2075
- 419,986 · -17.3%
- By 2100
- 369,492 · -27.3%
Race, ethnicity, and origin ACS 2023
- Neighborhood character
- Predominantly White (71%)
- Race & ethnicity
- White 71% Black 13% Two or more races 9% Hispanic / Latino 9% Asian 2%
- Hispanic origin (detail)
- Mexican 2% Puerto Rican 2%
- Common ancestry
- Romanian 6% Lithuanian 2% Italian 1%
- Foreign-born
- 8% · Canada, South Korea
- Languages at home
- 89% English-only · Spanish 8% Other Indo-European 2% Russian/Polish/Slavic 1%
Political lean MEDSL · Camden
- 2024 margin
- Strong D (+27.4) · D 63.0% · R 35.5% · Other 1.5%
- 2008→2024 swing
- -8.8pp toward R · 2008: 36.2pp · 2024: 27.4pp
- All cycles
- 2024: D+27.4 2020: D+33.5 2016: D+32.4 2012: D+36.6 2008: D+36.2
Not yet ingested
- Civics
- —
Market trends
- HPI YoY
- ▼ -91.29%
- Current HPI
- 304.7423
- Rent YoY
- —
- Metro
- —
- State GDP YoY
- ▲ 2.05%
- F500 in state
- 34
Industry mix (Fortune 500 HQ in NJ)
| Industry | F500 HQs | Revenue |
|---|---|---|
| Consumer Goods | 3 | $31B |
|
||
| Pharmaceuticals | 2 | $153B |
|
||
| Technology | 2 | $21B |
|
||
| Insurance | 2 | $20B |
|
||
| Healthcare | 2 | $19B |
|
||
| Financial Services | 1 | $70B |
|
||
Price history
+870.6% since first listed19 events — show timeline
- 2026-05-30 Listed $165,000 BRIGHT MLS
- 2026-05-29 Coming Soon $165,000 BRIGHT MLS
- 2026-03-06 Listing Removed — BRIGHT MLS
- 2025-01-25 Price Changed $187,000 BRIGHT MLS
- 2024-07-30 Contingent — BRIGHT MLS
- 2024-05-29 Price Changed $175,000 BRIGHT MLS
- 2024-01-29 Price Changed $200,000 BRIGHT MLS
- 2023-11-29 Listed $250,000 BRIGHT MLS
- 2023-02-15 Sold (Public Records) $180,000 Public Records
- 2023-01-11 Sold (MLS) $180,000 BRIGHT MLS
- 2022-12-05 Pending — BRIGHT MLS
- 2022-12-05 Listing Removed — BRIGHT MLS
- 2022-11-05 Price Changed $164,923 BRIGHT MLS
- 2022-10-14 Listed $174,923 BRIGHT MLS
- 2001-06-13 Sold (Public Records) $35,000 Public Records
- 2000-09-25 Sold (Public Records) $17,000 Public Records
- 2000-09-07 Sold (MLS) $17,000 BRIGHT MLS
- 2000-08-11 Listing Removed — BRIGHT MLS
- 2000-04-10 Listed $17,000 BRIGHT MLS
Property tax history
+5.7%/yrLatest (2025): $3,875 · +1.9% YoY. Source: county tax records.
Cash-flow waterfall
monthlySold comps — $/sqft
last 12 mo · ≤1 miLoading sold comps…