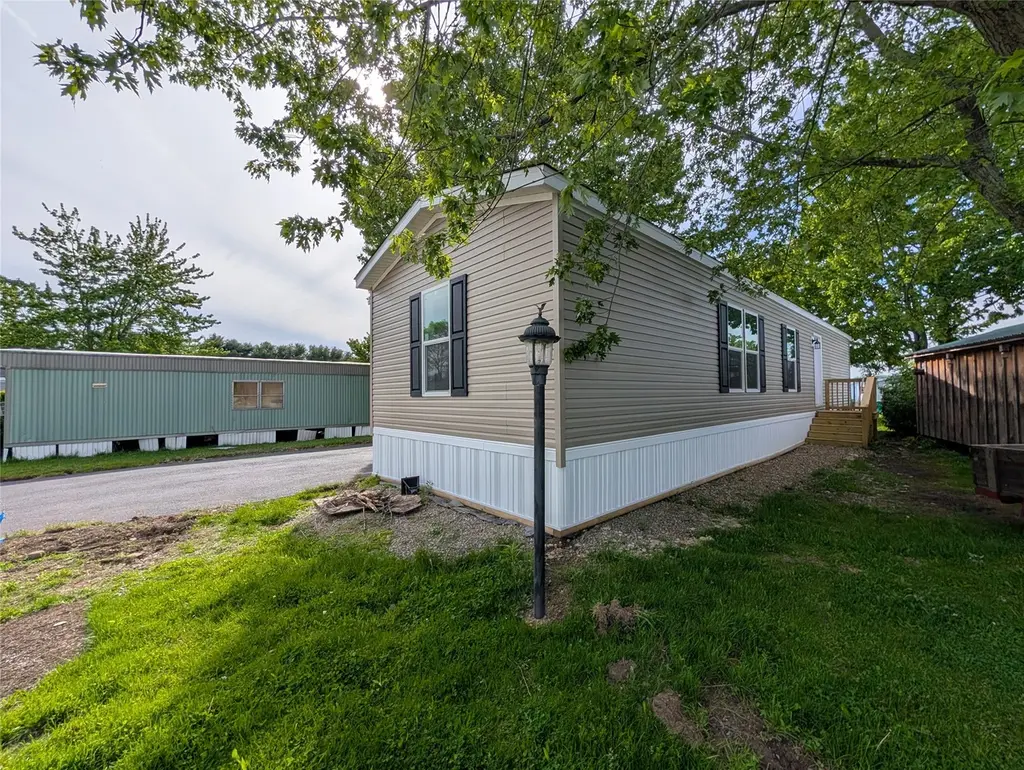
5149 Henderson Rd #63 · Erie, PA
Flood risk 1/10 · Minimal
- FEMA flood zone
- X (unshaded)
- Chance of flooding over 30 yrs
- 0.0%
- Est. flood insurance / yr
- $507 – $1,088
Fire risk 1/10 · Minimal
- Est. fire insurance / yr
- $511 – $949
Heat risk 2/10 · Minimal
- Hot days now (above 89°F)
- 7 days/yr
- Hot days in 30 yrs
- 16 days/yr
Wind risk 1/10 · Minimal
- Chance of severe wind over 30 yrs
- —
Air-quality risk 4/10 · Minor
- Unhealthy air days now
- 3 days/yr
- Unhealthy air days in 30 yrs
- 7 days/yr
Risk factors via First Street. Map © Google.
Why this score? — see what drove the F grade
The composite is a weighted blend of 9 inputs, each scored 0–100. Each bar is that input's sub-score; the figure is the points it added to the 100-point composite (weight × sub-score).
- 1% rule +10.0/10.0
- Cash flow +6.2/30.0
- Schools +4.8/10.0
- Livability +4.2/5.0
- Condition / age +4.0/5.0
- Rent growth +2.5/5.0
- DSCR +0.5/10.0
- ARV discount +0.0/15.0
- Appreciation +0.0/10.0
$73,000
🖨 Deal sheet 📄 Offer letter ✓ Due diligence
Listing remarks
Welcome to this brand new and beautiful mobile home located in Millcreek! This is the definition of affordable and low maintenance living Right across the street from belle valley this home has never been lived in yet. This community is well kept and well maintained!
Key facts
- Built 2026
- Listed 7 days
Property features AI
Finance
- Other: Approximately 7 total rooms
- HOA & community: Homeowners association with $500 annual fee; Association covers snow removal and trash
Exterior
- Utilities: Public water; Public sewer
- Home design: Single family residence (Residential); Zoned R-1
- Exterior features: Asphalt roof; Home warranty included
Interior
- Kitchen: Gas oven, gas range, refrigerator
- Flooring: Carpet; Laminate
- Bathrooms: 2 full bathrooms
- Heating & cooling: Forced air heating
- Interior features: Gas oven, gas range, refrigerator; Crawl space basement
Neighborhood map
What this means for you Summary
Snapshot
- This is a 2-bed/2.0-bath single-family listed at $73k. Condition is rated good.
Deal economics
- At list price, monthly cash flow is $-133 ($-2k/yr) — negative.
- To cash-flow at today's rent, offer at most $54k (26.4% below list).
- Meets the 1% rule at list price ($1k rent vs $73k).
- Recommended offer: $54k (26.4% below list) — sets the bar for cash-flow.
- Cap rate 4.1% vs local median 5.2% in Erie — below-typical yield; the buyer is paying a premium for something (appreciation thesis, condition, location) that the cap rate doesn't capture.
Location & tenants
- Location reads 83/100 on livability (#109 in PA, #840 nationally) — a professional / high-income tenant draw. Strengths: amenities A+, commute A+, cost of living A+; Watch: crime D+, employment F.
- Millcreek Township SD (suburban): math 46% / reading 65% proficiency, ranked #105 of 539 in PA (top 20%) — acceptable for families but not a draw, mixed tenant base, ~2y average lease.
- Market conditions: 116 active listings in the ZIP; 364 units permitted in Erie County in 2024 (188 in 5+ unit buildings).
Forward outlook
- Local home prices are declining (-3.0%/yr); year-one equity from $505 of loan paydown is wiped out by about $2k of value loss. Plan a longer hold.
- Erie County population projected at -14% by 2050 — secular population decline; favor cash flow + early exit over multi-decade hold.
Negotiation context
- Only 7 days on market — expect competitive offers; lowballing is unlikely to land.
Risks & watch-outs
- Watch-outs: HOA is 45% of rent.
Questions for the listing agent
- What do current leases actually rent for vs. the listed asking? Can we see a recent rent roll and the last 12 months of T-12 income?
- What does the HOA fee cover, when was the last increase, and are there any pending special assessments or reserve-fund shortfalls?
- Is there a deadline driving the sale (1031 exchange, divorce, estate, relocation)? That informs how much negotiation room exists.
- Crime grade is D in this area — have there been break-ins, vandalism, or insurance claims at this property in the last 3 years? What carrier currently insures it and at what premium?
- The area grade is low — what's the realistic commute time and amenity access for the typical tenant pool here? Any planned neighborhood developments (good or bad) we should know about?
- What's the average days-on-market for RENTAL listings here right now (not sales)? A rising rental-DOM trend means longer vacancies and softer asking-rent achievability than the comps imply.
- What's the recent tenant-quality profile in this submarket — average credit score on applications, eviction rate, late-payment / NSF rate, and stable-employment percentage? A property-management company in the area should have these aggregated.
- How much new for-sale + rental construction is in the pipeline within 1–3 miles? Heavy new supply typically softens prices + rents 12–24 months out; constrained supply supports both.
Investment metrics
- 1% rule
- 1.51% ✓
- Cap rate
- 4.11%
- Cash-on-cash
- -7.81%
- DSCR
- 0.65
- GRM
- 5.5
CMA / ARV
- ARV (on-the-fly)
- $49,280
- Comps found
- 12
Show comp detail 12 sales within ~0.75 mi
| Address | Dist | Beds/Ba | Sqft | Sold | Price | $/sf | Match |
|---|---|---|---|---|---|---|---|
| 5149 Henderson Rd #146 | 0.00mi | 2/1.5 | 924 (+3%) | 2mo | $29,000 | $31 | 91 |
| 5149 Henderson Lot 60 Rd | 0.04mi | 2/2.0 | 924 (+3%) | 4mo | $29,000 | $31 | 90 |
| 5149 Henderson Rd #139 | 0.00mi | 3/1.5 (+1) | 924 (+3%) | 7mo | $39,000 | $42 | 82 |
| 5149 Henderson Rd #117 | 0.03mi | 2/2.0 | 960 (+7%) | 14mo | $60,000 | $63 | 75 |
| 5149 Henderson Rd #120 | 0.03mi | 2/2.0 | 960 (+7%) | 15mo | $60,000 | $63 | 75 |
| 5149 Henderson Rd Lot 66 | 0.03mi | 2/2.0 | 990 (+10%) | 9mo | $54,900 | $55 | 74 |
| 5149 Henderson Rd #84 | 0.03mi | 2/1.5 | 960 (+7%) | 16mo | $45,000 | $47 | 71 |
| 5149 Henderson Rd #85 | 0.03mi | 2/1.5 | 960 (+7%) | 18mo | $45,000 | $47 | 70 |
| 5149 Henderson Rd Lot 113 | 0.03mi | 2/1.5 | 990 (+10%) | 16mo | $50,000 | $51 | 66 |
| 1175 E Arlington Rd | 0.69mi | 3/1.0 (+1) | 948 (+6%) | 4mo | $150,000 | $158 | 46 |
| 1710 E Grandview Blvd | 0.69mi | 3/1.0 (+1) | 998 (+11%) | 15mo | $105,000 | $105 | 27 |
| 2108 Delphos Dr | 0.73mi | 3/1.5 (+1) | 1,028 (+15%) | 11mo | $199,900 | $194 | 25 |
Match score weights: distance 35% · size 25% · config 20% · recency 20%. Top-matched comps best support the ARV.
Projected returns pro-forma
-3.0% appreciation · 3.0% rent growth · sell at horizon
- IRR
- -29.2%
- Equity multiple
- 0.02×
- Total profit
- $-19,978
- Equity at exit
- $10,885
- IRR
- -27.1%
- Equity multiple
- -0.32×
- Total profit
- $-26,991
- Equity at exit
- $6,312
Cash invested: $20,440 (down + closing). Projections, not guarantees.
Landlord ↔ Tenant lean methodology
- Overall (STATE)
- 62 Landlord-Friendly
- State Pennsylvania
- 62 Landlord-Friendly · EVEN
- County
- — inherits STATE
- City
- — inherits STATE
ZIP-level market 16509
- Home prices YoY
- -30.7%
- Active inventory
- 116
- Price-to-rent
- 5.5×
Monthly cashflow live
- Estimated rent
- $1,103 medium interval (Pro) →
- Mortgage (P&I)
- −$383
- Tax est. 1.5%
- −$91 /mo · $1,095/yr
- Insurance
- −$30
- HOA
- −$500
- Vacancy / Maint / Mgmt
- −$232
- Net cashflow
- $-133
Break-even live
UW: 25.0% down · 7.5% · 30yr · 1.5% tax · 5.0% vac · 8.0% maint · 8.0% mgmt
Financing live
Cash to close
- Down payment
- $18,250
- Closing costs
- $2,190
- Reserves months
- —
- Total cash needed
- —
Loan-product check · same deal, 3 products live
Conventional
25% down · 7.5% · 30yr
- Down + closing
- —
- Monthly P&I
- —
- Monthly cashflow
- —
- DSCR
- —
- Eligible?
- —
Personal DTI + credit; lowest rate.
DSCR
20% down · 8.5% · 30yr
- Down + closing
- —
- Monthly P&I
- —
- Monthly cashflow
- —
- DSCR
- —
- Eligible?
- —
No personal income docs; deal must DSCR.
Hard money
10% down · 12.0% · 12mo
- Down + closing
- —
- Monthly P&I
- —
- Monthly cashflow
- —
- DSCR
- —
- Eligible?
- —
Short-term bridge; refi at stabilization.
HOA detail
- Monthly dues
- $500 · $6,000/yr
Listing history 7 events
-
2026-06-19days on market $73,000 Active 7 DOM
-
2026-06-18days on market $73,000 Active 6 DOM
-
2026-06-17days on market $73,000 Active 5 DOM
-
2026-06-16days on market $73,000 Active 4 DOM
-
2026-06-15days on market $73,000 Active 3 DOM
-
2026-06-13remarks 267-char remark
-
2026-06-13$73,000 Active 1 DOM
ⓘ Source: listings_history table (triggers on properties + properties_extension) + one-shot
backfill from property_details.listing_events for pre-trigger history.
Climate risk First Street
- Flood 1/10 Low FEMA zone X (unshaded) · 0% chance over 30 yrs
- Wildfire 1/10 Low
- Heat 2/10 Low 7 d/yr ≥89°F today · 16 d/yr by 30 yrs out
- Wind 1/10 Low
- Air quality 4/10 Moderate 3 unhealthy d/yr today · 7 by 30 yrs out
Nearby sold comps map
Loading sold comps map…
Walkable amenities ~0.75 mi
Loading nearby amenities…
Taxation est. · year 1
- Rental income
- $13,237
- − Mortgage interest
- −$4,089
- − Property taxes
- −$1,095
- − Insurance
- −$365
- − Repairs & maintenance
- −$1,059
- − Management
- −$1,059
- − HOA
- −$6,000
- − Depreciation
- −$2,124
- Taxable loss
- −$2,553
- Est. tax savings @ 24.0%
- +$613
- After-tax cash flow
- $-984/yr
For passive investors: Depreciation is non-cash, so a rental often shows a tax loss while cash-flowing — sheltering income. Rental losses are passive: they offset passive income freely, and up to $25,000/yr can offset ordinary (W-2) income if you actively participate and your MAGI is under $100k (phasing out to $0 by $150k); unused losses carry forward. On sale, claimed depreciation is recaptured at up to 25%, and gains may owe capital-gains tax (a 1031 exchange can defer both). Figures are a year-1 estimate at your 24.0% rate — not tax advice; consult a CPA.
Condition & rehab AI · 10 photos
This brand new and beautifully renovated mobile home is move-in ready with no visible repairs or maintenance needed. It offers a great combination of curb appeal and interior updates, making it an attractive option for both resale and rental markets.
Value-add opportunities
- Both Painting exterior and interior — Enhances curb appeal and interior aesthetics
- Both Landscaping and curb appeal improvements — Enhances curb appeal and property value
- Both New flooring in living areas — Improves aesthetics and durability
- Both New lighting fixtures — Enhances interior aesthetics and safety
Renovation cost estimate screening
Value-add ROI direction
- Both Painting exterior and interior — Enhances curb appeal and interior aesthetics ↑
- Both Landscaping and curb appeal improvements — Enhances curb appeal and property value ↑
- Both New flooring in living areas — Improves aesthetics and durability ↑
- Both New lighting fixtures — Enhances interior aesthetics and safety ↑
ⓘ Cost ranges are severity-bucket heuristics (US national rule-of-thumb). Get contractor quotes + a written scope before underwriting a rehab budget.
Schools (NCES district)
- District
- Millcreek Township SD
- NCES district ID
- 4215330
- Math proficiency
- 46% ▼ -13.00%
- Reading proficiency
- 65% ▼ -9.00%
- Median HH income
- $55,734
- Composite
- 47.82/100
- National rank
- #2224
- State rank
- #105 of 539 in PA
Livability — Erie
- Score
- 83/100
- State rank
- #109
- US rank
- #840
Category grades
Schools grade is shown separately in the Schools card above.
Census & demographics
- County
- Erie County · 92,215 people
- City population
- 92,215
- Metro
- Erie, PA
- Population (ZIP)
- 28,595
- Household income
- $68,846
- Rent vs Own
- Severe rent burden
- 870.0
Population outlook (Erie County) Hauer SSP2
- Today (2025)
- 272,159 people
- By 2030
- 266,299 · -2.2%
- By 2040
- 250,987 · -7.8%
- By 2050
- 234,925 · -13.7%
- By 2075
- 199,164 · -26.8%
- By 2100
- 162,985 · -40.1%
Race, ethnicity, and origin ACS 2023
- Neighborhood character
- Predominantly White (87%)
- Race & ethnicity
- White 87% Two or more races 6% Black 4% Hispanic / Latino 3% Asian 1%
- Common ancestry
- Romanian 14% Slovak 4% Scotch-Irish 2%
- Foreign-born
- 6% · Canada
- Languages at home
- 92% English-only · Russian/Polish/Slavic 3% German/W. Germanic 1% Spanish 1%
Political lean MEDSL · Erie
- 2024 margin
- Toss-up / Even · D 49.0% · R 50.0%
- 2008→2024 swing
- -20.9pp toward R · 2008: 19.9pp · 2024: -1.0pp
- All cycles
- 2024: R+1.0 2020: D+1.0 2016: R+2.0 2012: D+16.9 2008: D+19.9
Not yet ingested
- Civics
- —
Market trends
- HPI YoY
- ▼ -106.54%
- Current HPI
- 240.361
- Rent YoY
- —
- Metro
- Erie, PA
- State GDP YoY
- ▲ 1.68%
- F500 in state
- 34
Industry mix (Fortune 500 HQ in PA)
| Industry | F500 HQs | Revenue |
|---|---|---|
| Healthcare | 2 | $309B |
|
||
| Insurance | 2 | $27B |
|
||
| Telecommunications / Media | 1 | $124B |
|
||
| Industrial Distribution | 1 | $22B |
|
||
| Financial Services | 1 | $20B |
|
||
| Chemicals / Materials | 1 | $18B |
|
||
Price history
1 event — show timeline
- 2026-06-12 Listed $73,000 GEBOR
Cash-flow waterfall
monthlySold comps — $/sqft
last 12 mo · ≤1 miLoading sold comps…