2607 Avenue O Unit 6C · New York, NY
Flood risk 7/10 · Major
- FEMA flood zone
- X (unshaded)
- Chance of flooding over 30 yrs
- 0.78%
- Est. flood insurance / yr
- $507 – $1,088
Fire risk 1/10 · Minimal
- Est. fire insurance / yr
- $691 – $1,283
Heat risk 7/10 · Major
- Hot days now (above 97°F)
- 7 days/yr
- Hot days in 30 yrs
- 16 days/yr
Wind risk 6/10 · Moderate
- Chance of severe wind over 30 yrs
- 77.0%
Air-quality risk 5/10 · Moderate
- Unhealthy air days now
- 6 days/yr
- Unhealthy air days in 30 yrs
- 8 days/yr
Risk factors via First Street. Map © Google.
Why this score? — see what drove the C- grade
The composite is a weighted blend of 9 inputs, each scored 0–100. Each bar is that input's sub-score; the figure is the points it added to the 100-point composite (weight × sub-score).
- Cash flow +19.2/30.0
- ARV discount +7.5/15.0
- DSCR +6.1/10.0
- 1% rule +5.1/10.0
- Schools +5.0/10.0
- Livability +3.8/5.0
- Rent growth +3.0/5.0
- Condition / age +2.5/5.0
- Appreciation +0.0/10.0
$225,000
🖨 Deal sheet (PDF) 📄 Offer letter ✓ Due diligence
Listing remarks
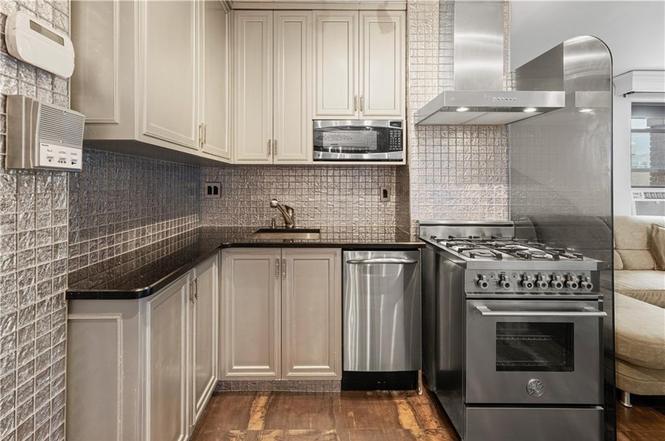
Welcome home to your luxury-renovated One bedroom, One and a Half bathroom Coop, top floor unit that faces South & West, amazing views of Midwood and more… Featuring: high-end renovation throughout, luxury bathrooms with shower, optional parking, laundry, open gourmet kitchen with full package SS appliances, granite countertops, exhaust-out vent, designer backsplash, open living room with oversized windows, pocket doors, plenty of custom made closets, large master suite bedroom with its own bathroom and oversized windows. Building features: updated elevator, central laundry, garage parking rental available, live-in super, controlled lobby, intercom system, bike room, good neigh
Key facts
- High-end renovation
- Luxury bathrooms
- Open gourmet kitchen
Tags
Neighborhood map
What this means for you Summary
Snapshot
- This is a 1-bed/1.5-bath condo listed at $225k.
Deal economics
- At list price, monthly cash flow is $176 ($2k/yr) — positive.
- The deal already cash-flows at list — no discount required.
- Meets the 1% rule at list price ($2k rent vs $225k).
- Recommended offer: $205k (9.0% below list) — sets the bar for market timing.
- Cap rate 7.6% vs local median 2.6% in New York — top-decile yield for the area; either an underpriced asset or a hidden risk that comps aren't pricing in. Stress-test before assuming the spread holds.
Location & tenants
- Location reads 75/100 on livability (#268 in NY, #4,188 nationally) — a middle-class / working-renter tenant base. Strengths: amenities A+, commute A+, health & safety A; Watch: crime F, cost of living F.
- Zoned schools: Ps 197 Kings Highway Academy (The) (math 62% / reading 62%, grade B, #675 of 2,108 statewide, top 35%, 963 students, 73% FRL); Jhs 383 Philippa Schuyler (math 32% / reading 67%, grade C, #280 of 729 statewide, top 40%, 822 students, 85% FRL); Midwood High School (math 94% / reading 96%, grade A+, #83 of 1,100 statewide, top 8%, 4,062 students, 73% FRL).
- Market conditions: Rents rising (+2.1%/yr); 167 active listings in the ZIP; solid renter incomes; 10,063 units permitted in Kings County in 2024 (9,789 in 5+ unit buildings).
- This rent runs 33% of the median local income ($84k/yr) — at the standard rent-burdened threshold; future hikes will face affordability resistance.
Forward outlook
- Local home prices are declining (-3.0%/yr); year-one equity from $2k of loan paydown is wiped out by about $7k of value loss. Plan a longer hold.
- Kings County population projected at +13% by 2050 — modest demand growth; plan on rents tracking national, not racing it.
Negotiation context
- It's been on market 95 days — a 9% lower offer ($205k) is reasonable based on typical stale-listing flexibility.
Risks & watch-outs
- Watch-outs: flood insurance adds $66/mo.
- Climate carrying-cost: major flood risk; major wind risk, 77% chance of damaging wind over 30y; extreme-heat days projected 7→16/yr by 2055 (HVAC capex compounding) — expect insurance premiums to compound above CPI over the hold.
Questions for the listing agent
- It's been on market 95 days. Have you received any prior offers? Is the seller open to a 9% concession, seller financing, or rate buy-down credit?
- What's the actual annual flood-insurance premium (NFIP or private), and is the property in a SFHA with mandatory coverage?
- Any open or pending special assessments — roof, HVAC, plumbing, elevator, façade? What's the per-unit balance and payoff schedule, and is the seller paying it off at close or rolling it to the buyer?
- Why hasn't it sold? Are there any deal-killer items the seller is aware of (foundation, flood, title, zoning, code violations)?
- Is there a deadline driving the sale (1031 exchange, divorce, estate, relocation)? That informs how much negotiation room exists.
- Schools are B-rated — typically a magnet for longer-tenancy family renters. What's the average tenant stay here, and is there a school-zone premium baked into asking?
- Crime grade is F in this area — have there been break-ins, vandalism, or insurance claims at this property in the last 3 years? What carrier currently insures it and at what premium?
- What's the average days-on-market for RENTAL listings here right now (not sales)? A rising rental-DOM trend means longer vacancies and softer asking-rent achievability than the comps imply.
- What's the recent tenant-quality profile in this submarket — average credit score on applications, eviction rate, late-payment / NSF rate, and stable-employment percentage? A property-management company in the area should have these aggregated.
- How much new apartment / multifamily construction is in the pipeline within 1–3 miles? Heavy new supply (>2% of stock underway) typically softens rents 12–24 months out; light construction supports rent growth.
Investment metrics
- 1% rule
- 1.01% ✓
- Cap rate
- 7.58%
- Cash-on-cash
- 4.61%
- DSCR
- 1.21
- GRM
- 8.2
CMA / ARV
No comps found within radius.
Projected returns pro-forma
-3.0% appreciation · 2.11% rent growth · sell at horizon
- IRR
- -12.0%
- Equity multiple
- 0.57×
- Total profit
- $-27,207
- Equity at exit
- $33,548
- IRR
- -4.3%
- Equity multiple
- 0.73×
- Total profit
- $-17,108
- Equity at exit
- $19,454
Cash invested: $63,000 (down + closing). Projections, not guarantees.
Landlord ↔ Tenant lean methodology
- Overall (CITY)
- 0 Strongly Tenant-Friendly
- State New York
- 15 Strongly Tenant-Friendly · D+10
- County
- — inherits STATE
- City New York
- 0 Strongly Tenant-Friendly · D+34
ZIP-level market 11210
- Rents YoY
- 2.1%
- Active inventory
- 167
- Price-to-rent
- 8.2×
Monthly cashflow live
- Estimated rent
- $2,275 medium interval (Pro) →
- Mortgage (P&I)
- −$1,180
- Tax est. 1.5%
- −$281 /mo · $3,375/yr
- Insurance
- −$94
- Flood insurance flood zone
- −$66 /mo · $798/yr
- HOA
- −$0
- Vacancy / Maint / Mgmt
- −$478
- Net cashflow
- $176
Break-even live
Sensitivity live
| Price | -10% $331 | -5% $254 | +0% $176 | +5% $98 | +10% $20 |
|---|---|---|---|---|---|
| Rent | -10% $-4 | -5% $86 | +0% $176 | +5% $266 | +10% $356 |
| Rate | -1.0pp $289 | -0.5pp $233 | base $176 | +0.5pp $117 | +1.0pp $58 |
UW: 25.0% down · 7.5% · 30yr · 1.5% tax · 5.0% vac · 8.0% maint · 8.0% mgmt
Financing live
Cash to close
- Down payment
- $56,250
- Closing costs
- $6,750
- Reserves months
- —
- Total cash needed
- —
Loan-product check · same deal, 3 products live
Conventional
25% down · 7.5% · 30yr
- Down + closing
- —
- Monthly P&I
- —
- Monthly cashflow
- —
- DSCR
- —
- Eligible?
- —
Personal DTI + credit; lowest rate.
DSCR
20% down · 8.5% · 30yr
- Down + closing
- —
- Monthly P&I
- —
- Monthly cashflow
- —
- DSCR
- —
- Eligible?
- —
No personal income docs; deal must DSCR.
Hard money
10% down · 12.0% · 12mo
- Down + closing
- —
- Monthly P&I
- —
- Monthly cashflow
- —
- DSCR
- —
- Eligible?
- —
Short-term bridge; refi at stabilization.
HOA detail condo
- Monthly dues
- $0 · $0/yr
- Assessments
- None detected in remarks — confirm with the listing agent.
Listing history 23 events
-
2025-12-30status Pending
-
2025-12-06price $225,000
-
2025-11-23price $235,000
-
2025-11-11price $239,000
-
2025-09-26$249,000 Active
-
2022-09-07price $278,888
-
2022-07-29price $280,000
-
2022-07-18price $288,000
-
2022-06-24price $290,000
-
2022-06-08price $293,000
-
2022-05-23price $294,000
-
2022-05-17price $295,000
-
2021-12-20price $329,000
-
2021-11-30price $339,000
-
2021-10-21price $300,000
-
2021-09-24price $320,000
-
2021-09-13price $325,000
-
2021-09-11price $335,000
-
2021-08-24price $345,000
-
2021-08-17price $353,000
-
2021-07-30price $354,000
-
2021-07-16price $355,000
-
2021-07-13price $378,000
ⓘ Source: listings_history table (triggers on properties + properties_extension) + one-shot
backfill from property_details.listing_events for pre-trigger history.
Climate risk First Street
- Flood 7/10 Severe FEMA zone X (unshaded) · 78% chance over 30 yrs
- Wildfire 1/10 Low
- Heat 7/10 Severe 7 d/yr ≥97°F today · 16 d/yr by 30 yrs out
- Wind 6/10 Major 77% chance of damaging wind over 30 yrs
- Air quality 5/10 Major 6 unhealthy d/yr today · 8 by 30 yrs out
Nearby sold comps map
Loading sold comps map…
Walkable amenities ~0.75 mi
Loading nearby amenities…
Taxation est. · year 1
- Rental income
- $27,299
- − Mortgage interest
- −$12,603
- − Property taxes
- −$3,375
- − Insurance
- −$1,922
- − Repairs & maintenance
- −$2,184
- − Management
- −$2,184
- − Depreciation
- −$6,545
- Taxable loss
- −$1,515
- Est. tax savings @ 24.0%
- +$364
- After-tax cash flow
- $2,473/yr
For passive investors: Depreciation is non-cash, so a rental often shows a tax loss while cash-flowing — sheltering income. Rental losses are passive: they offset passive income freely, and up to $25,000/yr can offset ordinary (W-2) income if you actively participate and your MAGI is under $100k (phasing out to $0 by $150k); unused losses carry forward. On sale, claimed depreciation is recaptured at up to 25%, and gains may owe capital-gains tax (a 1031 exchange can defer both). Figures are a year-1 estimate at your 24.0% rate — not tax advice; consult a CPA.
Schools (NCES district)
No district data.
Livability — New York
- Score
- 75/100
- State rank
- #268
- US rank
- #4188
Category grades
Schools grade is shown separately in the Schools card above.
Census & demographics
- Census place
- New York, NY
- County
- Kings County · 2,614,986 people
- City population
- 7,731,280
- Metro
- New York-Newark-Jersey City, NY-NJ-PA
- Population (ZIP)
- 57,915
- Household income
- $83,692
- Rent vs Own
- Severe rent burden
- 3513.0
Population outlook (Kings County) Hauer SSP2
- Today (2025)
- 2,847,441 people
- By 2030
- 2,937,006 · +3.1%
- By 2040
- 3,095,491 · +8.7%
- By 2050
- 3,228,968 · +13.4%
- By 2075
- 3,321,723 · +16.7%
- By 2100
- 3,111,387 · +9.3%
Race, ethnicity, and origin ACS 2023
- Neighborhood character
- Diverse neighborhood (Simpson 0.65)
- Race & ethnicity
- Black 50% White 30% Two or more races 8% Hispanic / Latino 7% Asian 5%
- Hispanic origin (detail)
- Puerto Rican 2% Dominican 1%
- Common ancestry
- Hispanic 12% Romanian 2% Scotch-Irish 2%
- Foreign-born
- 39% · Canada, China, Mexico
- Languages at home
- 67% English-only · French/Haitian/Cajun 13% Spanish 5% Other Indo-European 3%
Political lean MEDSL · Kings
- 2024 margin
- Solid D (+44.0) · D 72.0% · R 28.0%
- 2008→2024 swing
- -15.5pp toward R · 2008: 59.4pp · 2024: 44.0pp
- All cycles
- 2024: D+44.0 2020: D+54.8 2016: D+61.8 2012: D+63.9 2008: D+59.4
Not yet ingested
- Civics
- —
Market trends
- HPI YoY
- ▼ -831.01%
- Current HPI
- 389.9293
- Rent YoY
- ▲ 2.11%
- Metro
- New York-Newark-Jersey City, NY-NJ-PA
- State GDP YoY
- ▲ 2.60%
- F500 in state
- 92
Industry mix (Fortune 500 HQ in NY)
| Industry | F500 HQs | Revenue |
|---|---|---|
| Financial Services | 10 | $950B |
|
||
| Consumer Goods | 9 | $162B |
|
||
| Insurance | 4 | $225B |
|
||
| Telecommunications | 2 | $144B |
|
||
| Pharmaceuticals | 2 | $112B |
|
||
| Media / Entertainment | 2 | $69B |
|
||
Price history
-40.5% since first listed23 events — show timeline
- 2025-12-30 Pending — BNYMLS
- 2025-12-06 Price Changed $225,000 BNYMLS
- 2025-11-23 Price Changed $235,000 BNYMLS
- 2025-11-11 Price Changed $239,000 BNYMLS
- 2025-09-26 Listed $249,000 BNYMLS
- 2022-09-07 Price Changed $278,888 BNYMLS
- 2022-07-29 Price Changed $280,000 BNYMLS
- 2022-07-18 Price Changed $288,000 BNYMLS
- 2022-06-24 Price Changed $290,000 BNYMLS
- 2022-06-08 Price Changed $293,000 BNYMLS
- 2022-05-23 Price Changed $294,000 BNYMLS
- 2022-05-17 Price Changed $295,000 BNYMLS
- 2021-12-20 Price Changed $329,000 BNYMLS
- 2021-11-30 Price Changed $339,000 BNYMLS
- 2021-10-21 Price Changed $300,000 BNYMLS
- 2021-09-24 Price Changed $320,000 BNYMLS
- 2021-09-13 Price Changed $325,000 BNYMLS
- 2021-09-11 Price Changed $335,000 BNYMLS
- 2021-08-24 Price Changed $345,000 BNYMLS
- 2021-08-17 Price Changed $353,000 BNYMLS
- 2021-07-30 Price Changed $354,000 BNYMLS
- 2021-07-16 Price Changed $355,000 BNYMLS
- 2021-07-13 Price Changed $378,000 BNYMLS
Cash-flow waterfall
monthlySold comps — $/sqft
last 12 mo · ≤1 miLoading sold comps…