None · Naples Manor, FL
Flood risk 8/10 · Major
- FEMA flood zone
- AE
- Chance of flooding over 30 yrs
- 0.98%
- Est. flood insurance / yr
- $1,737 – $8,500
Fire risk 3/10 · Minor
- Est. fire insurance / yr
- $947 – $1,759
Heat risk 10/10 · Severe
- Hot days now (above 108°F)
- 7 days/yr
- Hot days in 30 yrs
- 30 days/yr
Wind risk 10/10 · Severe
- Chance of severe wind over 30 yrs
- 99.0%
Air-quality risk 2/10 · Minimal
- Unhealthy air days now
- 2 days/yr
- Unhealthy air days in 30 yrs
- 2 days/yr
Risk factors via First Street. Map © Google.
Why this score? — see what drove the C+ grade
The composite is a weighted blend of 9 inputs, each scored 0–100. Each bar is that input's sub-score; the figure is the points it added to the 100-point composite (weight × sub-score).
- Cash flow +24.8/30.0
- ARV discount +9.5/15.0
- DSCR +8.1/10.0
- 1% rule +5.4/10.0
- Schools +5.0/10.0
- Rent growth +3.9/5.0
- Livability +3.3/5.0
- Condition / age +2.5/5.0
- Appreciation +0.0/10.0
$469,900
🖨 Deal sheet 📄 Offer letter ✓ Due diligence
Listing remarks MLS
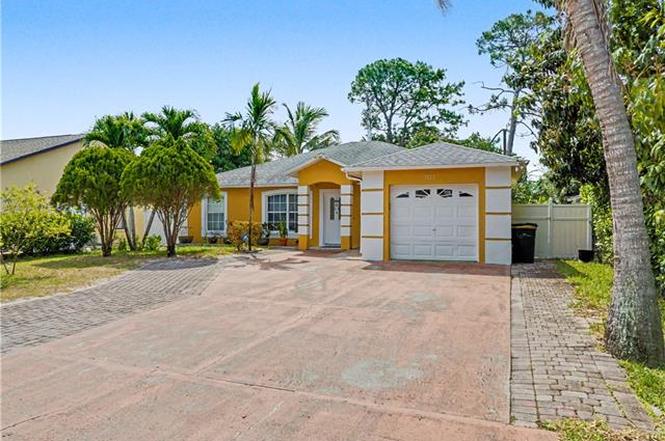
This is a big 4 bedroom + den fully renovated! Beautiful home with high ceilings! Newer kitchen cabinets with granite countertops and new stainless steel appliances . Freshly painted inside and out, all newer light fixtures and fans. Large backyard with brick pavers and some fruit trees. This one will not last so bring your buyers.
Key facts
- Large backyard
- Granite countertops
- Brick pavers
Tags
Property features AI
Finance
- Other: Located in the Naples Manor development; Lot is regular and approximately 0.19 acres; Total area listed as 1,840 (source: Property Appraiser Office); Single unit, single-floor building
- HOA & community: No HOA maintenance; No community amenities; Community type noted in remarks
Exterior
- Parking: Paved driveway; Attached garage with 1 garage space
- Utilities: Central water; Central sewer; Central electric heating; Central electric cooling; Cable available
- Home design: Single-family residential; One story; Rear exposure faces northeast; Entry level information not specified
- Construction: Concrete block construction; Built in 2000
- Exterior features: Fruit trees; Stucco exterior; Shingle roof; Storm protection details available in remarks; Windows details available in remarks; Paved road access; Preserve view
Interior
- Kitchen: Pantry; Microwave; Range; Refrigerator
- Bedrooms: 4 bedrooms plus a den
- Flooring: Laminate flooring; Tile flooring
- Bathrooms: 2 full bathrooms; Master bath details available in remarks
- Interior features: Split bedroom floor plan; Pantry; Dining area combined with living room; Den / study; Guest room; Unfurnished
Neighborhood map
What this means for you Summary
Snapshot
- This is a 4-bed/2.0-bath single-family listed at $470k.
Deal economics
- At list price, monthly cash flow is $574 ($7k/yr) — positive.
- The deal already cash-flows at list — no discount required.
- Meets the 1% rule at list price ($5k rent vs $470k).
- Recommended offer: $414k (12.0% below list) — sets the bar for market timing.
Location & tenants
- Location reads 66/100 on livability (#615 in FL) — a middle-class / working-renter tenant base. Strengths: housing A+, health & safety A+, cost of living B+; Watch: schools F, amenities F, commute F.
- Collier (suburban): math 60% / reading 56% proficiency, ranked #16 of 73 in FL (top 22%) — acceptable for families but not a draw, mixed tenant base, ~2y average lease.
- Market conditions: Rents rising fast (+5.6%/yr); 597 active listings in the ZIP; 40 comparable units currently listed for rent nearby; rentals at typical pace (median 23d on market — plan ~3-4 weeks tenant-placement turnaround); solid renter incomes; 3,520 units permitted in Collier County in 2024 (959 in 5+ unit buildings).
- At $4,881/mo this rent would consume 72% of the median local household income ($82k/yr) (locally 954% of renters already pay >50% of income on rent) — very limited rent-growth headroom before tenants either downsize or default.
Forward outlook
- Local home prices are declining (-3.0%/yr); year-one equity from $3k of loan paydown is wiped out by about $14k of value loss. Plan a longer hold.
- Collier County population projected at +30% by 2050 — long-run rental-demand tailwind backs the buy-and-hold thesis.
Negotiation context
- It's been on market 121 days — a 12% lower offer ($414k) is reasonable based on typical stale-listing flexibility.
- 3 sale attempts since 17y ago; this cycle's ask has dropped $35k (7%) from the opening price — seller is motivated, your offer sets the floor, not the list.
- Current owner paid $256k; list at $470k implies a 84% gain — meaningful room to come down on a strong offer.
Risks & watch-outs
- Watch-outs: flood insurance adds $427/mo.
- Climate carrying-cost: in FEMA flood zone AE (mandatory federal flood insurance); severe wind risk, 99% chance of damaging wind over 30y; extreme-heat days projected 7→30/yr by 2055 (HVAC capex compounding) — expect insurance premiums to compound above CPI over the hold.
Questions for the listing agent
- It's been on market 121 days. Have you received any prior offers? Is the seller open to a 12% concession, seller financing, or rate buy-down credit?
- What's the actual annual flood-insurance premium (NFIP or private), and is the property in a SFHA with mandatory coverage?
- Why hasn't it sold? Are there any deal-killer items the seller is aware of (foundation, flood, title, zoning, code violations)?
- Is there a deadline driving the sale (1031 exchange, divorce, estate, relocation)? That informs how much negotiation room exists.
- Schools are F-rated, which usually means shorter tenancies and higher turnover. Who's the typical renter profile here, and what's been the actual vacancy rate?
- What's the average days-on-market for RENTAL listings here right now (not sales)? A rising rental-DOM trend means longer vacancies and softer asking-rent achievability than the comps imply.
- What's the recent tenant-quality profile in this submarket — average credit score on applications, eviction rate, late-payment / NSF rate, and stable-employment percentage? A property-management company in the area should have these aggregated.
- How much new for-sale + rental construction is in the pipeline within 1–3 miles? Heavy new supply typically softens prices + rents 12–24 months out; constrained supply supports both.
Investment metrics
- 1% rule
- 1.04% ✓
- Cap rate
- 8.85%
- Cash-on-cash
- 9.13%
- DSCR
- 1.41
- GRM
- 8.0
CMA / ARV
- ARV (on-the-fly)
- $491,998
- Comps found
- 1
Show comp detail 1 sale within ~0.75 mi
| Address | Dist | Beds/Ba | Sqft | Sold | Price | $/sf | Match |
|---|---|---|---|---|---|---|---|
| 5309 Warren St | 0.69mi | 3/2.0 (-1) | 1,451 (-12%) | 9mo | $433,000 | $298 | 35 |
Match score weights: distance 35% · size 25% · config 20% · recency 20%. Top-matched comps best support the ARV.
Projected returns pro-forma
-3.0% appreciation · 5.59% rent growth · sell at horizon
- IRR
- -5.3%
- Equity multiple
- 0.80×
- Total profit
- $-26,440
- Equity at exit
- $70,064
- IRR
- 7.3%
- Equity multiple
- 1.61×
- Total profit
- $80,903
- Equity at exit
- $40,628
Cash invested: $131,572 (down + closing). Projections, not guarantees.
Landlord ↔ Tenant lean methodology
- Overall (STATE)
- 87 Strongly Landlord-Friendly
- State Florida
- 87 Strongly Landlord-Friendly · R+3
- County
- — inherits STATE
- City
- — inherits STATE
ZIP-level market 34113
- Rents YoY
- 5.6%
- Active inventory
- 597
- Price-to-rent
- 8.0×
Monthly cashflow live
- Estimated rent
- $4,881 medium interval (Pro) →
- Mortgage (P&I)
- −$2,464
- Tax from tax record
- −$195 /mo · $2,344/yr
- Insurance
- −$196
- Flood insurance flood zone
- −$427 /mo · $5,118/yr
- HOA
- −$0
- Vacancy / Maint / Mgmt
- −$1,025
- Net cashflow
- $574
Break-even live
UW: 25.0% down · 7.5% · 30yr · 1.5% tax · 5.0% vac · 8.0% maint · 8.0% mgmt
Financing live
Cash to close
- Down payment
- $117,475
- Closing costs
- $14,097
- Reserves months
- —
- Total cash needed
- —
Loan-product check · same deal, 3 products live
Conventional
25% down · 7.5% · 30yr
- Down + closing
- —
- Monthly P&I
- —
- Monthly cashflow
- —
- DSCR
- —
- Eligible?
- —
Personal DTI + credit; lowest rate.
DSCR
20% down · 8.5% · 30yr
- Down + closing
- —
- Monthly P&I
- —
- Monthly cashflow
- —
- DSCR
- —
- Eligible?
- —
No personal income docs; deal must DSCR.
Hard money
10% down · 12.0% · 12mo
- Down + closing
- —
- Monthly P&I
- —
- Monthly cashflow
- —
- DSCR
- —
- Eligible?
- —
Short-term bridge; refi at stabilization.
Rent comps 40 comps
| Address | Beds | Baths | Sqft | Rent | $/sqft | DOM | Units | Dist |
|---|---|---|---|---|---|---|---|---|
| 5237 Jennings St Naples, FL | 3.0 | 2.0 | 1971 | $2,500 | $1.27 | 23d | 1 | 0.09mi |
| 6065 Divot Ct Naples, FL | 3.0 | 2.0 | 1738 | $10,000 | $5.75 | 23d | 1 | 0.59mi |
| 6101 Dogleg Dr Naples, FL | 3.0 | 2.0 | 1694 | $12,000 | $7.08 | 23d | 1 | 0.66mi |
| 6105 Dogleg Dr Naples, FL | 3.0 | 3.0 | 1945 | $12,000 | $6.17 | 23d | 1 | 0.66mi |
| 6088 Dogleg Dr Naples, FL | 3.0 | 3.0 | 1965 | $2,890 | $1.47 | 23d | 1 | 0.66mi |
| 6155 Dogleg Dr Naples, FL | 3.0 | 2.0 | 2043 | $9,000 | $4.41 | 23d | 1 | 0.78mi |
| 6155 Dogleg Dr Naples, FL | 3.0 | 2.0 | 2043 | $8,000 | $3.92 | 13d | 1 | 0.78mi |
| 9498 Napoli Ln Unit 201 Naples, FL | 3.0 | 2.0 | 2099 | $12,000 | $5.72 | 13d | 1 | 0.79mi |
| 8884 Mustang Island Cir Naples, FL | 3.0 | 2.0 | 2000 | $12,500 | $6.25 | 21d | 1 | 0.86mi |
| 8888 Mustang Island Cir Naples, FL | 3.0 | 2.5 | 2028 | $10,000 | $4.93 | 23d | 1 | 0.87mi |
| 9372 Vercelli Ct Naples, FL | 4.0 | 2.0 | 2239 | $13,000 | $5.81 | 23d | 1 | 0.87mi |
| 9476 Napoli Ln Unit 202 Naples, FL | 3.0 | 2.0 | 2099 | $10,000 | $4.76 | 13d | 1 | 0.88mi |
| 9114 Prima Way Unit 102 Naples, FL | 3.0 | 2.0 | 1883 | $10,000 | $5.31 | 13d | 1 | 0.93mi |
| 9115 Napoli Ct #101 Naples, FL | 3.0 | 2.0 | 1741 | $9,500 | $5.46 | 23d | 1 | 0.95mi |
| 9126 Napoli Ct Unit 101 Naples, FL | 3.0 | 2.0 | 1883 | $9,500 | $5.05 | 13d | 1 | 0.97mi |
| 9107 Napoli Ct Unit 201 Naples, FL | 3.0 | 2.0 | 2099 | $3,500 | $1.67 | 23d | 1 | 0.98mi |
| 6757 Bent Grass Dr Naples, FL | 3.0 | 2.0 | 1719 | $3,650 | $2.12 | 23d | 1 | 0.98mi |
| 6753 Bent Grass Dr Naples, FL | 3.0 | 3.0 | 1945 | $8,000 | $4.11 | 23d | 1 | 0.99mi |
| 494 Saint Andrews Blvd Naples, FL | 3.0 | 2.0 | 1700 | $2,800 | $1.65 | 23d | 1 | 0.99mi |
| 8963 Appaloosa Ct Naples, FL | 4.0 | 2.0 | 2023 | $15,000 | $7.41 | 23d | 1 | 0.99mi |
| 9512 Napoli Ln Unit 101 Naples, FL | 3.0 | 2.0 | 1741 | $10,000 | $5.74 | 13d | 1 | 0.99mi |
| 326 Bradstrom Cir Unit 204F Naples, FL | 3.0 | 2.0 | 1200 | $3,500 | $2.92 | 23d | 1 | 1.00mi |
| 6719 Crowned Eagle Ln Naples, FL | 3.0 | 2.0 | 1745 | $3,850 | $2.21 | 23d | 1 | 1.00mi |
| 6737 Bent Grass Dr Naples, FL | 3.0 | 2.0 | 1745 | $12,000 | $6.88 | 23d | 1 | 1.01mi |
| 6971 Amen Corner Ct Naples, FL | 3.0 | 2.0 | 1749 | $12,000 | $6.86 | 23d | 1 | 1.09mi |
| 6605 Castlelawn Pl #34 Naples, FL | 3.0 | 3.0 | 1985 | $13,000 | $6.55 | 23d | 1 | 1.11mi |
| 6215 Brunello Ln Naples, FL | 3.0 | 3.0 | 2062 | $15,000 | $7.27 | 23d | 1 | 1.12mi |
| 9254 Veneto Pl Naples, FL | 3.0 | 3.0 | 2035 | $17,500 | $8.60 | 23d | 1 | 1.13mi |
| 9234 Veneto Pl Naples, FL | 3.0 | 3.0 | 2032 | $21,500 | $10.58 | 23d | 1 | 1.15mi |
| 255 Pine Valley Cir Naples, FL | 3.0 | 1.5 | 1574 | $3,500 | $2.22 | 23d | 1 | 1.15mi |
| 8432 Indian Wells Way Naples, FL | 3.0 | 2.0 | 1746 | $3,495 | $2.00 | 13d | 1 | 1.18mi |
| 6255 Brunello Ln Naples, FL | 3.0 | 3.0 | 2046 | $16,500 | $8.06 | 23d | 1 | 1.19mi |
| 8468 Indian Wells Way Naples, FL | 3.0 | 2.0 | 1704 | $10,500 | $6.16 | 23d | 1 | 1.22mi |
| 6513 Caldecott Dr Naples, FL | 3.0 | 2.0 | 2125 | $12,000 | $5.65 | 23d | 1 | 1.23mi |
| 6815 Ascot Dr #102 Naples, FL | 3.0 | 2.0 | 1632 | $7,500 | $4.60 | 23d | 1 | 1.24mi |
| 6809 Ascot Dr #201 Naples, FL | 3.0 | 2.0 | 2040 | $7,500 | $3.68 | 23d | 1 | 1.24mi |
| 9419 Piacere Way Naples, FL | 3.0 | 2.0 | 2073 | $20,000 | $9.65 | 23d | 1 | 1.25mi |
| 6557 Caldecott Dr Naples, FL | 3.0 | 2.0 | 1975 | $10,000 | $5.06 | 23d | 1 | 1.27mi |
| 416 Bristle Cone Ln #9 Naples, FL | 4.0 | 2.5 | 2060 | $2,800 | $1.36 | 23d | 1 | 1.28mi |
| 6597 Caldecott Dr Naples, FL | 3.0 | 2.0 | 1975 | $19,000 | $9.62 | 23d | 1 | 1.30mi |
Listing history 25 events
-
2026-06-18days on market $469,900 Active 121 DOM
-
2026-06-17days on market $469,900 Active 120 DOM
-
2026-06-16days on market $469,900 Active 119 DOM
-
2026-06-15days on market $469,900 Active 118 DOM
-
2026-06-14days on market $469,900 Active 116 DOM
-
2026-06-10days on market $469,900 Active 113 DOM
-
2026-06-09days on market $469,900 Active 112 DOM
-
2026-06-08days on market $469,900 Active 111 DOM
-
2026-06-07days on market $469,900 Active 110 DOM
-
2026-06-03days on market $469,900 Active 106 DOM
-
2026-06-02days on market $469,900 Active 105 DOM
-
2026-06-01days on market $469,900 Active 104 DOM
-
2026-05-31days on market $469,900 Active 103 DOM
-
2026-05-30days on market $469,900 Active 102 DOM
-
2026-04-14price $469,900
-
2026-02-17$505,000 Active
-
2016-07-07soldstatus $255,900
-
2016-06-24soldstatus $255,900 Sold 333-char remark
Show marketing remark (333 chars)
This is a big 4 bedroom + den fully renovated! Beautiful home with high ceilings! Newer kitchen cabinets with granite countertops and new stainless steel appliances . Freshly painted inside and out, all newer light fixtures and fans. Large backyard with brick pavers and some fruit trees. This one will not last so bring your buyers.
-
2016-05-24status Pending With Contingencies 333-char remark
Show marketing remark (333 chars)
This is a big 4 bedroom + den fully renovated! Beautiful home with high ceilings! Newer kitchen cabinets with granite countertops and new stainless steel appliances . Freshly painted inside and out, all newer light fixtures and fans. Large backyard with brick pavers and some fruit trees. This one will not last so bring your buyers.
-
2016-05-18$255,900 Active 333-char remark
Show marketing remark (333 chars)
This is a big 4 bedroom + den fully renovated! Beautiful home with high ceilings! Newer kitchen cabinets with granite countertops and new stainless steel appliances . Freshly painted inside and out, all newer light fixtures and fans. Large backyard with brick pavers and some fruit trees. This one will not last so bring your buyers.
-
2010-03-17soldstatus $116,500 281-char remark
Show marketing remark (281 chars)
BANK FORECLOSED - Won't last long - First qualified offer takes it! Like new home featuring new carpeting, new paint, interior and new landscaping. Being sold "AS IS" with full right of inspection. 0% down financing immediately available through seller. Se Habla Espanol.
-
2009-12-11$119,900 281-char remark
Show marketing remark (281 chars)
BANK FORECLOSED - Won't last long - First qualified offer takes it! Like new home featuring new carpeting, new paint, interior and new landscaping. Being sold "AS IS" with full right of inspection. 0% down financing immediately available through seller. Se Habla Espanol.
-
2005-11-01soldstatus $295,000
-
2000-12-04soldstatus $103,000
-
1998-12-01soldstatus $11,500
ⓘ Source: listings_history table (triggers on properties + properties_extension) + one-shot
backfill from property_details.listing_events for pre-trigger history.
Tax reassessment forecast FL · Resets to sale price
- Current annual tax
- $2,344 · $195/mo
- Projected year-2 tax
- $3,900 · $325/mo
- Expected delta
- +$1,556/yr (+$130/mo · 66.4%)
ⓘ Screening estimate from a state-policy table — verify with the county assessor before closing.
Climate risk First Street
- Flood 8/10 Severe FEMA zone AE · 98% chance over 30 yrs
- Wildfire 3/10 Moderate
- Heat 10/10 Extreme 7 d/yr ≥108°F today · 30 d/yr by 30 yrs out
- Wind 10/10 Extreme 99% chance of damaging wind over 30 yrs
- Air quality 2/10 Low 2 unhealthy d/yr today · 2 by 30 yrs out
Nearby sold comps map
Loading sold comps map…
Walkable amenities ~0.75 mi
Loading nearby amenities…
Taxation est. · year 1
- Rental income
- $58,571
- − Mortgage interest
- −$26,322
- − Property taxes
- −$2,344
- − Insurance
- −$7,468
- − Repairs & maintenance
- −$4,686
- − Management
- −$4,686
- − Depreciation
- −$13,670
- Taxable loss
- −$604
- Est. tax savings @ 24.0%
- +$145
- After-tax cash flow
- $7,033/yr
For passive investors: Depreciation is non-cash, so a rental often shows a tax loss while cash-flowing — sheltering income. Rental losses are passive: they offset passive income freely, and up to $25,000/yr can offset ordinary (W-2) income if you actively participate and your MAGI is under $100k (phasing out to $0 by $150k); unused losses carry forward. On sale, claimed depreciation is recaptured at up to 25%, and gains may owe capital-gains tax (a 1031 exchange can defer both). Figures are a year-1 estimate at your 24.0% rate — not tax advice; consult a CPA.
Schools (NCES district)
- District
- Collier
- NCES district ID
- 1200330
- Math proficiency
- 60% ▼ -4.00%
- Reading proficiency
- 56% ▼ -2.00%
- Median HH income
- $58,275
- Composite
- 50.23/100
- National rank
- #1892
- State rank
- #16 of 73 in FL
Livability — Naples Manor
- Score
- 66/100
- State rank
- #615
- US rank
- #11875
Category grades
Schools grade is shown separately in the Schools card above.
Census & demographics
- Census place
- Naples Manor, FL
- County
- Collier County · 396,295 people
- Metro
- Naples-Marco Island, FL
- Population (ZIP)
- 26,056
- Household income
- $81,674
- Rent vs Own
- Severe rent burden
- 954.0
Population outlook (Collier County) Hauer SSP2
- Today (2025)
- 420,858 people
- By 2030
- 450,054 · +6.9%
- By 2040
- 502,232 · +19.3%
- By 2050
- 544,932 · +29.5%
- By 2075
- 627,203 · +49.0%
- By 2100
- 659,015 · +56.6%
Race, ethnicity, and origin ACS 2023
- Neighborhood character
- Diverse neighborhood (Simpson 0.59)
- Race & ethnicity
- White 56% Hispanic / Latino 28% Black 12% Two or more races 11% Asian 2%
- Hispanic origin (detail)
- Mexican 17% Puerto Rican 3% Cuban 2%
- Common ancestry
- Hispanic 10% Romanian 3% Lithuanian 2%
- Foreign-born
- 26% · Canada, Jamaica, Vietnam
- Languages at home
- 63% English-only · Spanish 24% French/Haitian/Cajun 9% Other Indo-European 2%
Political lean MEDSL · Collier
- 2024 margin
- Solid R (+33.1) · D 33.1% · R 66.2%
- 2008→2024 swing
- -10.6pp toward R · 2008: -22.5pp · 2024: -33.1pp
- All cycles
- 2024: R+33.1 2020: R+24.7 2016: R+26.0 2012: R+30.1 2008: R+22.5
Not yet ingested
- Civics
- —
Market trends
- HPI YoY
- ▼ -194.86%
- Current HPI
- 279.4232
- Rent YoY
- ▲ 5.59%
- Metro
- Naples-Marco Island, FL
- State GDP YoY
- ▲ 3.28%
- F500 in state
- 36
Industry mix (Fortune 500 HQ in FL)
| Industry | F500 HQs | Revenue |
|---|---|---|
| Industrial Technology | 2 | $29B |
|
||
| Insurance | 2 | $17B |
|
||
| Retail | 1 | $60B |
|
||
| Technology Distribution | 1 | $58B |
|
||
| Homebuilding | 1 | $35B |
|
||
| Technology Manufacturing | 1 | $35B |
|
||
Price history
+3986.1% since first listed11 events — show timeline
- 2026-04-14 Price Changed $469,900 NAPLESMLS
- 2026-02-17 Listed $505,000 NAPLESMLS
- 2016-07-07 Sold (Public Records) $255,900 Public Records
- 2016-06-24 Sold (MLS) $255,900 NAPLESMLS
- 2016-05-24 Pending — NAPLESMLS
- 2016-05-18 Listed $255,900 NAPLESMLS
- 2010-03-17 Sold (MLS) $116,500 NAPLESMLS
- 2009-12-11 Listed $119,900 NAPLESMLS
- 2005-11-01 Sold (Public Records) $295,000 Public Records
- 2000-12-04 Sold (Public Records) $103,000 Public Records
- 1998-12-01 Sold (Public Records) $11,500 Public Records
Property tax history
+12.5%/yrLatest (2025): $2,344 · +6.8% YoY. Source: county tax records.
Cash-flow waterfall
monthlySold comps — $/sqft
last 12 mo · ≤1 miLoading sold comps…