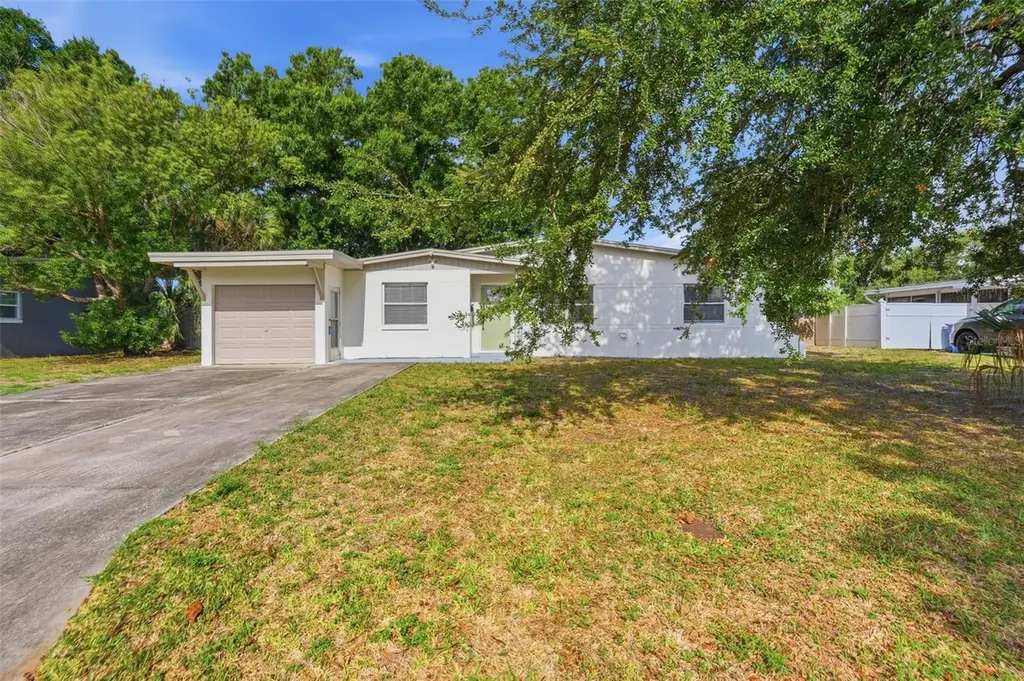
6000 12th Way N · St. Petersburg, FL
Flood risk 7/10 · Major
- FEMA flood zone
- X (unshaded)
- Chance of flooding over 30 yrs
- 0.95%
- Est. flood insurance / yr
- $507 – $1,088
Fire risk 1/10 · Minimal
- Est. fire insurance / yr
- $947 – $1,759
Heat risk 10/10 · Severe
- Hot days now (above 106°F)
- 6 days/yr
- Hot days in 30 yrs
- 22 days/yr
Wind risk 10/10 · Severe
- Chance of severe wind over 30 yrs
- 99.0%
Air-quality risk 4/10 · Minor
- Unhealthy air days now
- 4 days/yr
- Unhealthy air days in 30 yrs
- 4 days/yr
Risk factors via First Street. Map © Google.
Why this score? — see what drove the C- grade
The composite is a weighted blend of 9 inputs, each scored 0–100. Each bar is that input's sub-score; the figure is the points it added to the 100-point composite (weight × sub-score).
- ARV discount +15.0/15.0
- Cash flow +14.3/30.0
- DSCR +4.4/10.0
- Schools +4.3/10.0
- 1% rule +4.1/10.0
- Rent growth +3.1/5.0
- Livability +2.5/5.0
- Condition / age +2.5/5.0
- Appreciation +0.0/10.0
$325,000
🖨 Deal sheet 📄 Offer letter ✓ Due diligence
Listing remarks
Under contract-accepting backup offers. Welcome to this charming three-bedroom, two-bathroom home ideally located in St. Petersburg, offering comfort and unbeatable convenience. With fresh exterior paint and a 2024 AC system, this home is perfect for enjoying the Florida lifestyle. Step inside to discover a light and bright interior featuring new wood-look laminate flooring throughout the main living areas. Designed with flexibility in mind, the home offers two separate living spaces, providing plenty of room for entertaining, relaxing, or creating a home office or playroom. A separate dining room adds additional space for hosting family and friends. The kitchen is welcoming with ample natu
Key facts
- 2024 ac system
- Separate dining room
- Fresh exterior paint
Tags
Property features AI
Finance
- Other: Lot size about 0.18 acre (0 to less than 1/4 acre)
- Financial info: No lease restrictions reported
- HOA & community: No association indicated
Exterior
- Parking: Driveway; Oversized driveway; Attached garage (1 car)
- Utilities: Public water; Public sewer; Cable connected; Electricity connected; Water connected
- Home design: Single family residence; Residential property; One story; Faces west; Entry level: One
- Construction: Stucco exterior; Shingle roof; Slab foundation; Built in (public records indicate building area total 1,885 sq ft)
- Exterior features: Lighting; Private mailbox; Sidewalk; Paved road access
Interior
- Kitchen: Microwave; Range; Refrigerator
- Bedrooms: 3 bedrooms
- Flooring: Carpet; Laminate; Tile
- Bathrooms: 2 full bathrooms
- Heating & cooling: Central heating; Central air conditioning
- Interior features: Built-in features; Ceiling fans; Eat-in kitchen
- Laundry & utility: Inside laundry room
Neighborhood map
What this means for you Summary
Snapshot
- This is a 3-bed/2.0-bath single-family listed at $325k.
Deal economics
- At list price, monthly cash flow is $-6 ($-70/yr) — negative.
- To cash-flow at today's rent, offer at most $324k (0.3% below list).
- To meet the 1% rule (rent ≥ 1% of price), the offer needs to be $296k (8.8% below list).
- Recommended offer: $296k (8.8% below list) — sets the bar for 1% rule.
- Cap rate 6.5% vs local median 2.6% in St. Petersburg — top-decile yield for the area; either an underpriced asset or a hidden risk that comps aren't pricing in. Stress-test before assuming the spread holds.
Location & tenants
- Location reads: area grade C — affects rentability + tenant quality, not the cash-flow math above.
- Pinellas (suburban): math 51% / reading 51% proficiency, ranked #31 of 73 in FL (top 42%) — acceptable for families but not a draw, mixed tenant base, ~2y average lease.
- Zoned schools: Lynch Elementary School (math 47% / reading 39%, grade F, #1,366 of 2,144 statewide, top 64%, 486 students, 67% FRL); Northeast High School (math 35% / reading 47%, grade F, #289 of 667 statewide, top 44%, 1,736 students, 50% FRL).
- Market conditions: Rents rising (+2.2%/yr); 451 active listings in the ZIP; 40 comparable units currently listed for rent nearby; rentals leasing fast (median 8d on market — plan ~1-2 weeks tenant-placement turnaround); solid renter incomes; 2,676 units permitted in Pinellas County in 2024 (1,422 in 5+ unit buildings).
- This rent runs 37% of the median local income ($95k/yr) — at the standard rent-burdened threshold; future hikes will face affordability resistance.
Forward outlook
- Local home prices are declining (-3.0%/yr); year-one equity from $2k of loan paydown is wiped out by about $10k of value loss. Plan a longer hold.
- Pinellas County population projected at +14% by 2050 — modest demand growth; plan on rents tracking national, not racing it.
Negotiation context
- Only 6 days on market — expect competitive offers; lowballing is unlikely to land.
Risks & watch-outs
- Watch-outs: flood insurance adds $66/mo; built in 1958 — expect roof / HVAC / electrical / plumbing capex.
- Climate carrying-cost: major flood risk; severe wind risk, 99% chance of damaging wind over 30y; extreme-heat days projected 6→22/yr by 2055 (HVAC capex compounding) — expect insurance premiums to compound above CPI over the hold.
Questions for the listing agent
- What do current leases actually rent for vs. the listed asking? Can we see a recent rent roll and the last 12 months of T-12 income?
- Built in 1958 — when were the roof, HVAC, electrical panel, plumbing, and water heater last replaced?
- What's the actual annual flood-insurance premium (NFIP or private), and is the property in a SFHA with mandatory coverage?
- Is there a deadline driving the sale (1031 exchange, divorce, estate, relocation)? That informs how much negotiation room exists.
- What's the average days-on-market for RENTAL listings here right now (not sales)? A rising rental-DOM trend means longer vacancies and softer asking-rent achievability than the comps imply.
- What's the recent tenant-quality profile in this submarket — average credit score on applications, eviction rate, late-payment / NSF rate, and stable-employment percentage? A property-management company in the area should have these aggregated.
- How much new for-sale + rental construction is in the pipeline within 1–3 miles? Heavy new supply typically softens prices + rents 12–24 months out; constrained supply supports both.
Investment metrics
- 1% rule
- 0.91% ✗
- Cap rate
- 6.52%
- Cash-on-cash
- 0.80%
- DSCR
- 1.04
- GRM
- 9.1
CMA / ARV
- ARV (on-the-fly)
- $425,412
- Comps found
- 12
Show comp detail 12 sales within ~0.75 mi
| Address | Dist | Beds/Ba | Sqft | Sold | Price | $/sf | Match |
|---|---|---|---|---|---|---|---|
| 1501 61st Ave N | 0.13mi | 3/2.0 | 1,396 (-1%) | 6mo | $395,000 | $283 | 88 |
| 1237 57th Ave N | 0.17mi | 3/2.0 | 1,345 (-4%) | 0mo | $433,900 | $323 | 85 |
| 5900 12th St N | 0.07mi | 4/2.0 (+1) | 1,257 (-10%) | 5mo | $319,000 | $254 | 70 |
| 6041 15th St N | 0.08mi | 4/2.0 (+1) | 1,605 (+14%) | 3mo | $320,000 | $199 | 65 |
| 5900 15th St N | 0.11mi | 3/2.0 | 1,203 (-14%) | 7mo | $378,326 | $314 | 65 |
| 1044 51st Ave N | 0.60mi | 2/2.0 (-1) | 1,440 (+3%) | 1mo | $487,500 | $339 | 62 |
| 1761 65th Ave N | 0.44mi | 3/2.0 | 1,584 (+13%) | 0mo | $480,000 | $303 | 58 |
| 6535 10th St N | 0.47mi | 3/1.0 | 1,237 (-12%) | 1mo | $329,000 | $266 | 54 |
| 1121 51st Ave N | 0.57mi | 3/2.0 | 1,228 (-12%) | 0mo | $425,000 | $346 | 52 |
| 1255 48th Ave N | 0.73mi | 2/2.0 (-1) | 1,341 (-4%) | 4mo | $372,500 | $278 | 50 |
| 1130 50th Ave N | 0.65mi | 3/1.5 | 1,287 (-8%) | 8mo | $475,000 | $369 | 48 |
| 527 Glenoak St N | 0.66mi | 3/2.0 | 1,574 (+12%) | 6mo | $350,000 | $222 | 44 |
Match score weights: distance 35% · size 25% · config 20% · recency 20%. Top-matched comps best support the ARV.
Projected returns pro-forma
-3.0% appreciation · 2.21% rent growth · sell at horizon
- IRR
- -17.3%
- Equity multiple
- 0.39×
- Total profit
- $-55,264
- Equity at exit
- $48,459
- IRR
- -10.9%
- Equity multiple
- 0.37×
- Total profit
- $-57,603
- Equity at exit
- $28,100
Cash invested: $91,000 (down + closing). Projections, not guarantees.
Landlord ↔ Tenant lean methodology
- Overall (STATE)
- 87 Strongly Landlord-Friendly
- State Florida
- 87 Strongly Landlord-Friendly · R+3
- County
- — inherits STATE
- City
- — inherits STATE
ZIP-level market 33703
- Rents YoY
- 2.2%
- Active inventory
- 451
- Price-to-rent
- 9.1×
Monthly cashflow live
- Estimated rent
- $2,963 high interval (Pro) →
- Mortgage (P&I)
- −$1,704
- Tax from tax record
- −$440 /mo · $5,280/yr
- Insurance
- −$135
- Flood insurance flood zone
- −$66 /mo · $798/yr
- HOA
- −$0
- Vacancy / Maint / Mgmt
- −$622
- Net cashflow
- $-6
Break-even live
UW: 25.0% down · 7.5% · 30yr · 1.5% tax · 5.0% vac · 8.0% maint · 8.0% mgmt
Financing live
Cash to close
- Down payment
- $81,250
- Closing costs
- $9,750
- Reserves months
- —
- Total cash needed
- —
Loan-product check · same deal, 3 products live
Conventional
25% down · 7.5% · 30yr
- Down + closing
- —
- Monthly P&I
- —
- Monthly cashflow
- —
- DSCR
- —
- Eligible?
- —
Personal DTI + credit; lowest rate.
DSCR
20% down · 8.5% · 30yr
- Down + closing
- —
- Monthly P&I
- —
- Monthly cashflow
- —
- DSCR
- —
- Eligible?
- —
No personal income docs; deal must DSCR.
Hard money
10% down · 12.0% · 12mo
- Down + closing
- —
- Monthly P&I
- —
- Monthly cashflow
- —
- DSCR
- —
- Eligible?
- —
Short-term bridge; refi at stabilization.
Rent comps 40 comps
| Address | Beds | Baths | Sqft | Rent | $/sqft | DOM | Units | Dist |
|---|---|---|---|---|---|---|---|---|
| 5924 15th Way N Saint Petersburg, FL | 3.0 | 2.0 | 1104 | $3,200 | $2.90 | 4d | 1 | 0.16mi |
| 1412 56th Ave N Saint Petersburg, FL | 2.0 | 1.0 | 1156 | $2,195 | $1.90 | 4d | 1 | 0.30mi |
| 1416 55th Ave N St Petersburg, FL | 3.0 | 2.0 | 1300 | $4,600 | $3.54 | 24d | 1 | 0.36mi |
| 1770 63rd Ave N Saint Petersburg, FL | 3.0 | 2.0 | 1782 | $3,300 | $1.85 | 8d | 1 | 0.36mi |
| 5920 18th St N #14 Saint Petersburg, FL | 2.0 | 2.0 | 950 | $1,400 | $1.47 | 24d | 1 | 0.42mi |
| 5801 Magnolia St N Saint Petersburg, FL | 2.0 | 2.0 | 1147 | $2,250 | $1.96 | 4d | 1 | 0.43mi |
| 1155 53rd Ave N Saint Petersburg, FL | 3.0 | 2.0 | 1790 | $3,500 | $1.96 | 4d | 1 | 0.44mi |
| 6630 17th Ln N Saint Petersburg, FL | 3.0 | 1.0 | 1324 | $2,489 | $1.88 | 15d | 1 | 0.49mi |
| 5210 Doctor Martin Luther King Junior St N St. Petersburg, FL | 3.0 | 2.0 | 1318 | $3,600 | $2.73 | 14d | 1 | 0.55mi |
| 6900 16th St N Saint Petersburg, FL | 3.0 | 1.0 | 1150 | $2,095 | $1.82 | 4d | 1 | 0.58mi |
| 7111 16th St N Saint Petersburg, FL | 3.0 | 1.0 | 1130 | $2,695 | $2.38 | 4d | 1 | 0.68mi |
| 7260 17th Way N Saint Petersburg, FL | 3.0 | 1.0 | 912 | $3,650 | $4.00 | 4d | 1 | 0.80mi |
| 1770 73rd Ave N Saint Petersburg, FL | 4.0 | 2.0 | 1484 | $4,500 | $3.03 | 4d | 1 | 0.81mi |
| 617 52nd Ave N Saint Petersburg, FL | 3.0 | 2.5 | 1481 | $3,250 | $2.19 | 4d | 1 | 0.82mi |
| 5185 6th Way N St Petersburg, FL | 3.0 | 2.5 | 1480 | $3,150 | $2.13 | 4d | 1 | 0.83mi |
| 2275 62nd Ave N #203 St Petersburg, FL | 2.0 | 2.0 | 940 | $1,975 | $2.10 | 24d | 1 | 0.86mi |
| 7325 10th St N Saint Petersburg, FL | 3.0 | 2.0 | 1762 | $3,300 | $1.87 | 24d | 1 | 0.88mi |
| 7325 10th St N Saint Petersburg, FL | 3.0 | 2.0 | 1762 | $3,300 | $1.87 | 22d | 1 | 0.88mi |
| 628 51st Ave N Saint Petersburg, FL | 3.0 | 2.5 | 1480 | $2,800 | $1.89 | 3d | 1 | 0.89mi |
| 4628 Dr Martin Luther King Jr St N Saint Petersburg, FL | 3.0 | 2.0 | 1421 | $2,950 | $2.08 | 24d | 1 | 0.91mi |
| 375 54th Ter N St. Petersburg, FL | 1.0–2.0 | 1.0–2.0 | 966 | $3,323 | $3.44 | 2d | 13 | 0.96mi |
| 5925 1st St NE Saint Petersburg, FL | 3.0 | 2.0 | 1510 | $2,799 | $1.85 | 4d | 1 | 1.09mi |
| 2715 63rd Ter N Unit B St. Petersburg, FL | 2.0 | 2.0 | 1030 | $1,900 | $1.84 | 24d | 1 | 1.12mi |
| 600 76th Ave N Saint Petersburg, FL | 1.0–2.0 | 1.0–1.5 | 775 | $1,849 | $2.39 | 4d | 10 | 1.17mi |
| 2600 52nd Ave N Unit A St. Petersburg, FL | 2.0 | 2.0 | 1018 | $2,225 | $2.19 | 2d | 1 | 1.18mi |
| 613 44th Ave N Saint Petersburg, FL | 2.0 | 1.0 | 1124 | $2,250 | $2.00 | 4d | 1 | 1.19mi |
| 4104 1/2 Haines Rd N Unit 1 St. Petersburg, FL | 2.0 | 1.0 | 1000 | $1,850 | $1.85 | 24d | 1 | 1.22mi |
| 111 73rd Ave N Saint Petersburg, FL | 3.0 | 1.0–1.5 | 695 | $2,225 | $3.20 | 24d | 1 | 1.23mi |
| 6379 29th St N Saint Petersburg, FL | 3.0 | 2.0 | 1323 | $2,869 | $2.17 | 24d | 1 | 1.26mi |
| 120 47th Ave N Saint Petersburg, FL | 1.0–2.0 | 1.0–2.0 | 914 | $1,999 | $2.19 | 2d | 8 | 1.36mi |
| 509 77th Ave N St. Petersburg, FL | 1.0–2.0 | 1.0–2.0 | 850 | $1,678 | $1.97 | 24d | 12 | 1.38mi |
| 4681 1st St NE #209 Saint Petersburg, FL | 2.0 | 2.0 | 1120 | $2,250 | $2.01 | 24d | 1 | 1.38mi |
| 350 79th Ave N St Petersburg, FL | 2.0 | 1.0 | 915 | $1,610 | $1.76 | 7d | 2 | 1.41mi |
| 5516 Pine Cir NE Saint Petersburg, FL | 3.0 | 1.0 | 1205 | $2,500 | $2.07 | 4d | 1 | 1.41mi |
| 517 Hampton Ave NE St Petersburg, FL | 3.0 | 2.0 | 896 | $2,950 | $3.29 | 24d | 1 | 1.42mi |
| 4651 1st St NE #306 Saint Petersburg, FL | 2.0 | 2.0 | 1120 | $2,900 | $2.59 | 4d | 1 | 1.43mi |
| 4920 Locust St NE St. Petersburg, FL | 2.0 | 2.0 | 1035 | $1,825 | $1.76 | 24d | 1 | 1.44mi |
| 1165 83rd Ave N Unit D Saint Petersburg, FL | 2.0 | 2.0 | 960 | $1,295 | $1.35 | 24d | 1 | 1.45mi |
| 3651 Haines Rd N Saint Petersburg, FL | 2.0 | 1.0 | 950 | $1,800 | $1.89 | 12d | 1 | 1.45mi |
| 5246 Neil Dr Saint Petersburg, FL | 3.0 | 3.0 | 1713 | $3,450 | $2.01 | 22d | 1 | 1.48mi |
Listing history 2 events
-
2026-05-20status Pending
-
2026-05-14$325,000 Active
ⓘ Source: listings_history table (triggers on properties + properties_extension) + one-shot
backfill from property_details.listing_events for pre-trigger history.
Tax reassessment forecast FL · Resets to sale price
- Current annual tax
- $5,280 · $440/mo
- Projected year-2 tax
- $5,280 · $440/mo
- Expected delta
- $0/yr ($0/mo · 0.0%)
ⓘ Screening estimate from a state-policy table — verify with the county assessor before closing.
Climate risk First Street
- Flood 7/10 Severe FEMA zone X (unshaded) · 95% chance over 30 yrs
- Wildfire 1/10 Low
- Heat 10/10 Extreme 6 d/yr ≥106°F today · 22 d/yr by 30 yrs out
- Wind 10/10 Extreme 99% chance of damaging wind over 30 yrs
- Air quality 4/10 Moderate 4 unhealthy d/yr today · 4 by 30 yrs out
Nearby sold comps map
Loading sold comps map…
Walkable amenities ~0.75 mi
Loading nearby amenities…
Taxation est. · year 1
- Rental income
- $35,550
- − Mortgage interest
- −$18,205
- − Property taxes
- −$5,280
- − Insurance
- −$2,422
- − Repairs & maintenance
- −$2,844
- − Management
- −$2,844
- − Depreciation
- −$9,455
- Taxable loss
- −$5,500
- Est. tax savings @ 24.0%
- +$1,320
- After-tax cash flow
- $1,250/yr
For passive investors: Depreciation is non-cash, so a rental often shows a tax loss while cash-flowing — sheltering income. Rental losses are passive: they offset passive income freely, and up to $25,000/yr can offset ordinary (W-2) income if you actively participate and your MAGI is under $100k (phasing out to $0 by $150k); unused losses carry forward. On sale, claimed depreciation is recaptured at up to 25%, and gains may owe capital-gains tax (a 1031 exchange can defer both). Figures are a year-1 estimate at your 24.0% rate — not tax advice; consult a CPA.
Schools (NCES district)
- District
- Pinellas
- NCES district ID
- 1201560
- Math proficiency
- 51% ▼ -5.00%
- Reading proficiency
- 51% ▼ -3.00%
- Median HH income
- $46,270
- Composite
- 43.27/100
- National rank
- #3046
- State rank
- #31 of 73 in FL
Livability — St. Petersburg
No livability data for this city. (Only ~50 U.S. cities are tracked.)
Census & demographics
- Census place
- St. Petersburg, FL
- County
- Pinellas County · 939,478 people
- City population
- 249,151
- Metro
- Tampa-St. Petersburg-Clearwater, FL
- Population (ZIP)
- 25,264
- Household income
- $95,224
- Rent vs Own
- Severe rent burden
- 509.0
Population outlook (Pinellas County) Hauer SSP2
- Today (2025)
- 1,027,532 people
- By 2030
- 1,063,586 · +3.5%
- By 2040
- 1,125,020 · +9.5%
- By 2050
- 1,168,637 · +13.7%
- By 2075
- 1,265,188 · +23.1%
- By 2100
- 1,260,357 · +22.7%
Race, ethnicity, and origin ACS 2023
- Neighborhood character
- Predominantly White (76%)
- Race & ethnicity
- White 76% Hispanic / Latino 10% Two or more races 10% Black 5% Asian 4%
- Hispanic origin (detail)
- Mexican 1% Puerto Rican 2% Cuban 2%
- Common ancestry
- Lithuanian 4% Romanian 3% Italian 2%
- Foreign-born
- 9% · Canada, Vietnam
- Languages at home
- 87% English-only · Spanish 6% Russian/Polish/Slavic 2% Other Indo-European 1%
Political lean MEDSL · Pinellas
- 2024 margin
- Lean R (+5.2) · D 46.9% · R 52.1%
- 2008→2024 swing
- -13.5pp toward R · 2008: 8.3pp · 2024: -5.2pp
- All cycles
- 2024: R+5.2 2020: D+0.2 2016: R+1.1 2012: D+5.6 2008: D+8.3
Not yet ingested
- Civics
- —
Market trends
- HPI YoY
- ▼ -617.95%
- Current HPI
- 352.2886
- Rent YoY
- ▲ 2.21%
- Metro
- Tampa-St. Petersburg-Clearwater, FL
- State GDP YoY
- ▲ 3.28%
- F500 in state
- 36
Industry mix (Fortune 500 HQ in FL)
| Industry | F500 HQs | Revenue |
|---|---|---|
| Industrial Technology | 2 | $29B |
|
||
| Insurance | 2 | $17B |
|
||
| Retail | 1 | $60B |
|
||
| Technology Distribution | 1 | $58B |
|
||
| Homebuilding | 1 | $35B |
|
||
| Technology Manufacturing | 1 | $35B |
|
||
Price history
2 events — show timeline
- 2026-05-20 Pending — Stellar MLS as Distributed by MLS Grid
- 2026-05-14 Listed $325,000 Stellar MLS as Distributed by MLS Grid
Property tax history
+9.9%/yrLatest (2025): $5,280 · +13.5% YoY. Source: county tax records.
Cash-flow waterfall
monthlySold comps — $/sqft
last 12 mo · ≤1 miLoading sold comps…