 Duplex
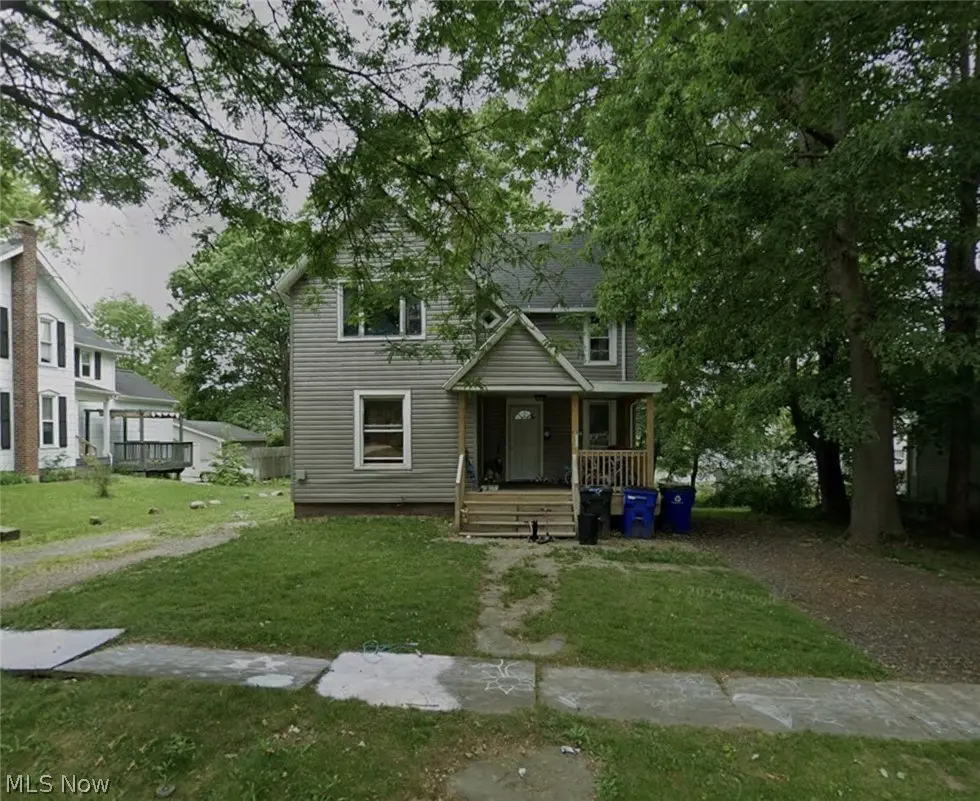
246 Grant St · Ravenna, OH
Flood risk 1/10 · Minimal
- FEMA flood zone
- X (unshaded)
- Chance of flooding over 30 yrs
- 0.0%
- Est. flood insurance / yr
- $473 – $860
Fire risk 1/10 · Minimal
- Est. fire insurance / yr
- $713 – $1,323
Heat risk 2/10 · Minimal
- Hot days now (above 96°F)
- 7 days/yr
- Hot days in 30 yrs
- 17 days/yr
Wind risk 1/10 · Minimal
- Chance of severe wind over 30 yrs
- —
Air-quality risk 3/10 · Minor
- Unhealthy air days now
- 2 days/yr
- Unhealthy air days in 30 yrs
- 5 days/yr
Risk factors via First Street. Map © Google.
Why this score? — see what drove the C+ grade
The composite is a weighted blend of 9 inputs, each scored 0–100. Each bar is that input's sub-score; the figure is the points it added to the 100-point composite (weight × sub-score).
- Cash flow +30.0/30.0
- DSCR +10.0/10.0
- 1% rule +8.6/10.0
- Livability +3.7/5.0
- Schools +3.0/10.0
- Rent growth +2.5/5.0
- Condition / age +2.5/5.0
- ARV discount +0.0/15.0
- Appreciation +0.0/10.0
$160,000
🖨 Deal sheet 📄 Offer letter ✓ Due diligence
Multi-family units
County records classify this as Multi-Family (2-4 Unit). Listing-text estimate: 2 units. confirmed
Listing remarks MLS
Great investment opportunity with this well-maintained duplex! Major exterior and mechanical updates have already been taken care of, offering peace of mind for the next owner. In 2021, the property received new siding along with a new front porch and rear porch, enhancing both curb appeal and functionality. Electrical has been updated with two new panels installed in 2023, and a new hot water tank for one unit was added in 2024. Tenants pay their own utilities, helping keep expenses low, and are currently on month-to-month leases—offering flexibility for the next owner whether you’re looking to continue renting or make future changes. With key improvements already completed, this property is ready to generate income from day one or serve as a solid addition to your portfolio. Seller is a licensed Realtor
Key facts
- 0.28 acre lot
- Built 1920
- Listed 84 days
Neighborhood map
What this means for you Summary
Snapshot
- This is a 2 × 3-bed/2.0-bath units multifamily listed at $160k.
Deal economics
- At list price, monthly cash flow is $623 ($7k/yr) — positive. Per door: $311/mo.
- The deal already cash-flows at list — no discount required.
- Meets the 1% rule at list price ($2k rent vs $160k).
- Recommended offer: $150k (6.0% below list) — sets the bar for market timing.
- Cap rate 11.0% vs local median 3.0% in Ravenna — top-decile yield for the area; either an underpriced asset or a hidden risk that comps aren't pricing in. Stress-test before assuming the spread holds.
Location & tenants
- Location reads 73/100 on livability (#323 in OH) — a middle-class / working-renter tenant base. Strengths: cost of living A+, health & safety A+, housing A-; Watch: amenities F, commute F, employment F.
- Ravenna City (suburban): math 31% / reading 41% proficiency, ranked #559 of 656 in OH (top 85%) — families likely to look elsewhere, expect single-tenant / working-renter base with shorter leases.
- Market conditions: 159 active listings in the ZIP; 196 units permitted in Portage County in 2024 (10 in 5+ unit buildings).
- This rent runs 40% of the median local income ($65k/yr) — at the standard rent-burdened threshold; future hikes will face affordability resistance.
Forward outlook
- Local home prices are declining (-3.0%/yr); year-one equity from $1k of loan paydown is wiped out by about $5k of value loss. Plan a longer hold.
- At projected returns (-3.0% appreciation + 3.0% rent growth), your $45k cash investment doubles in ~8 years — after that, you're playing with house money.
Negotiation context
- It's been on market 84 days — a 6% lower offer ($150k) is reasonable based on typical stale-listing flexibility.
- 3 sale attempts; this cycle's ask is 18724% above the opening price — seller raised mid-cycle; expect resistance to lowballs.
- Current owner paid $49k; list at $160k implies a 227% gain — meaningful room to come down on a strong offer.
Risks & watch-outs
- Watch-outs: built in 1920 — expect roof / HVAC / electrical / plumbing capex.
Questions for the listing agent
- It's been on market 84 days. Have you received any prior offers? Is the seller open to a 6% concession, seller financing, or rate buy-down credit?
- Can we see the unit-by-unit rent roll, current vacancy, and any below-market leases? What's the average tenancy length?
- What capital expenditures (roof, boiler, parking lot, exteriors) have been made in the last 5 years, and what's planned in the next 2?
- Built in 1920 — when were the roof, HVAC, electrical panel, plumbing, and water heater last replaced?
- Why hasn't it sold? Are there any deal-killer items the seller is aware of (foundation, flood, title, zoning, code violations)?
- Is there a deadline driving the sale (1031 exchange, divorce, estate, relocation)? That informs how much negotiation room exists.
- What's the average days-on-market for RENTAL listings here right now (not sales)? A rising rental-DOM trend means longer vacancies and softer asking-rent achievability than the comps imply.
- What's the recent tenant-quality profile in this submarket — average credit score on applications, eviction rate, late-payment / NSF rate, and stable-employment percentage? A property-management company in the area should have these aggregated.
- How much new apartment / multifamily construction is in the pipeline within 1–3 miles? Heavy new supply (>2% of stock underway) typically softens rents 12–24 months out; light construction supports rent growth.
Investment metrics
- 1% rule
- 1.36% ✓
- Cap rate
- 10.96%
- Cash-on-cash
- 16.68%
- DSCR
- 1.74
- GRM
- 6.1
CMA / ARV
- ARV (median comp)
- $113,266
- List price
- $160,000
- Delta
- 41.26%
- Verdict
- OVERPRICED
- Comps
- 16 within 1.0 mi
Projected returns pro-forma
-3.0% appreciation · 3.0% rent growth · sell at horizon
- IRR
- 7.8%
- Equity multiple
- 1.31×
- Total profit
- $13,767
- Equity at exit
- $23,857
- IRR
- 17.1%
- Equity multiple
- 2.41×
- Total profit
- $63,177
- Equity at exit
- $13,834
Cash invested: $44,800 (down + closing). Projections, not guarantees.
Landlord ↔ Tenant lean methodology
- Overall (STATE)
- 73 Landlord-Friendly
- State Ohio
- 73 Landlord-Friendly · R+6
- County
- — inherits STATE
- City
- — inherits STATE
ZIP-level market 44266
- Active inventory
- 159
- Price-to-rent
- 12.2×
Monthly cashflow live
- Estimated rent
- $2,178 medium interval (Pro) →
- Mortgage (P&I)
- −$839
- Tax from tax record
- −$192 /mo · $2,305/yr
- Insurance
- −$67
- HOA
- −$0
- Vacancy / Maint / Mgmt
- −$457
- Net cashflow
- $623
Break-even live
Sensitivity live
| Price | -10% $713 | -5% $668 | +0% $623 | +5% $577 | +10% $532 |
|---|---|---|---|---|---|
| Rent | -10% $451 | -5% $537 | +0% $623 | +5% $709 | +10% $795 |
| Rate | -1.0pp $703 | -0.5pp $663 | base $623 | +0.5pp $581 | +1.0pp $539 |
2-unit breakdown (identical units grouped — click to expand)
| Units | Beds | Baths | Est. rent |
|---|---|---|---|
| 2× units | 3 | 2 | $2,178 |
| #1 | 3 | 2 | $1,089 |
| #2 | 3 | 2 | $1,089 |
| Total (2 units) | $2,178 | ||
UW: 25.0% down · 7.5% · 30yr · 1.5% tax · 5.0% vac · 8.0% maint · 8.0% mgmt
Financing live
Cash to close
- Down payment
- $40,000
- Closing costs
- $4,800
- Reserves months
- —
- Total cash needed
- —
Loan-product check · same deal, 3 products live
Conventional
25% down · 7.5% · 30yr
- Down + closing
- —
- Monthly P&I
- —
- Monthly cashflow
- —
- DSCR
- —
- Eligible?
- —
Personal DTI + credit; lowest rate.
DSCR
20% down · 8.5% · 30yr
- Down + closing
- —
- Monthly P&I
- —
- Monthly cashflow
- —
- DSCR
- —
- Eligible?
- —
No personal income docs; deal must DSCR.
Hard money
10% down · 12.0% · 12mo
- Down + closing
- —
- Monthly P&I
- —
- Monthly cashflow
- —
- DSCR
- —
- Eligible?
- —
Short-term bridge; refi at stabilization.
Listing history 23 events
-
2026-06-18days on market $160,000 Active 84 DOM
-
2026-06-17days on market $160,000 Active 83 DOM
-
2026-06-16days on market $160,000 Active 82 DOM
-
2026-06-15days on market $160,000 Active 81 DOM
-
2026-06-14days on market $160,000 Active 79 DOM
-
2026-06-10days on market $160,000 Active 76 DOM
-
2026-06-09days on market $160,000 Active 75 DOM
-
2026-06-08days on market $160,000 Active 74 DOM
-
2026-06-07days on market $160,000 Active 73 DOM
-
2026-06-05days on market $160,000 Active 70 DOM
-
2026-06-03days on market $160,000 Active 69 DOM
-
2026-06-02days on market $160,000 Active 68 DOM
-
2026-06-01days on market $160,000 Active 67 DOM
-
2026-05-31days on market $160,000 Active 66 DOM
-
2026-05-31days on market $160,000 Active 65 DOM
-
2026-04-30price $175,000 831-char remark
Show marketing remark (831 chars)
Great investment opportunity with this well-maintained duplex! Major exterior and mechanical updates have already been taken care of, offering peace of mind for the next owner. In 2021, the property received new siding along with a new front porch and rear porch, enhancing both curb appeal and functionality. Electrical has been updated with two new panels installed in 2023, and a new hot water tank for one unit was added in 2024. Tenants pay their own utilities, helping keep expenses low, and are currently on month-to-month leases—offering flexibility for the next owner whether you’re looking to continue renting or make future changes. With key improvements already completed, this property is ready to generate income from day one or serve as a solid addition to your portfolio. Seller is a licensed Realtor
-
2026-04-22$850
-
2026-03-26$185,000 Active 831-char remark
Show marketing remark (831 chars)
Great investment opportunity with this well-maintained duplex! Major exterior and mechanical updates have already been taken care of, offering peace of mind for the next owner. In 2021, the property received new siding along with a new front porch and rear porch, enhancing both curb appeal and functionality. Electrical has been updated with two new panels installed in 2023, and a new hot water tank for one unit was added in 2024. Tenants pay their own utilities, helping keep expenses low, and are currently on month-to-month leases—offering flexibility for the next owner whether you’re looking to continue renting or make future changes. With key improvements already completed, this property is ready to generate income from day one or serve as a solid addition to your portfolio. Seller is a licensed Realtor
-
2025-03-26historical $850
-
2025-03-23$850
-
2022-02-11soldstatus $49,000
-
2021-02-01soldstatus $49,000
-
2020-11-10soldstatus $32,500
ⓘ Source: listings_history table (triggers on properties + properties_extension) + one-shot
backfill from property_details.listing_events for pre-trigger history.
Tax reassessment forecast OH · Partial reset (capped growth)
- Current annual tax
- $2,305 · $192/mo
- Projected year-2 tax
- $2,401 · $200/mo
- Expected delta
- +$95/yr (+$8/mo · 4.1%)
ⓘ Screening estimate from a state-policy table — verify with the county assessor before closing.
Climate risk First Street
- Flood 1/10 Low FEMA zone X (unshaded) · 0% chance over 30 yrs
- Wildfire 1/10 Low
- Heat 2/10 Low 7 d/yr ≥96°F today · 17 d/yr by 30 yrs out
- Wind 1/10 Low
- Air quality 3/10 Moderate 2 unhealthy d/yr today · 5 by 30 yrs out
Nearby sold comps map
Loading sold comps map…
Walkable amenities ~0.75 mi
Loading nearby amenities…
Taxation est. · year 1
- Rental income
- $26,136
- − Mortgage interest
- −$8,962
- − Property taxes
- −$2,305
- − Insurance
- −$800
- − Repairs & maintenance
- −$2,091
- − Management
- −$2,091
- − Depreciation
- −$4,655
- Taxable income
- $5,232
- Est. tax owed @ 24.0%
- −$1,256
- After-tax cash flow
- $6,218/yr
For passive investors: Depreciation is non-cash, so a rental often shows a tax loss while cash-flowing — sheltering income. Rental losses are passive: they offset passive income freely, and up to $25,000/yr can offset ordinary (W-2) income if you actively participate and your MAGI is under $100k (phasing out to $0 by $150k); unused losses carry forward. On sale, claimed depreciation is recaptured at up to 25%, and gains may owe capital-gains tax (a 1031 exchange can defer both). Figures are a year-1 estimate at your 24.0% rate — not tax advice; consult a CPA.
Schools (NCES district)
- District
- Ravenna City
- NCES district ID
- 3904468
- Math proficiency
- 31% ▼ -22.00%
- Reading proficiency
- 41% ▼ -13.00%
- Median HH income
- $40,018
- Composite
- 30.19/100
- National rank
- #6314
- State rank
- #559 of 656 in OH
Livability — Ravenna
- Score
- 73/100
- State rank
- #323
- US rank
- #5309
Category grades
Schools grade is shown separately in the Schools card above.
Census & demographics
- Census place
- Ravenna, OH
- County
- Portage County · 70,400 people
- City population
- 32,612
- Metro
- Akron, OH
- Population (ZIP)
- 32,612
- Household income
- $64,918
- Rent vs Own
- Severe rent burden
- 1468.0
Population outlook (Portage County) Hauer SSP2
- Today (2025)
- 166,109 people
- By 2030
- 167,752 · +1.0%
- By 2040
- 168,640 · +1.5%
- By 2050
- 167,469 · +0.8%
- By 2075
- 170,131 · +2.4%
- By 2100
- 167,958 · +1.1%
Race, ethnicity, and origin ACS 2023
- Neighborhood character
- Predominantly White (87%)
- Race & ethnicity
- White 87% Black 6% Two or more races 4% Hispanic / Latino 2%
- Common ancestry
- Romanian 3% Italian 2% Slovak 2%
- Foreign-born
- 1% · Canada
- Languages at home
- 98% English-only · Spanish 1%
Political lean MEDSL · Portage
- 2024 margin
- R (+15.5) · D 41.8% · R 57.3%
- 2008→2024 swing
- -24.5pp toward R · 2008: 9.0pp · 2024: -15.5pp
- All cycles
- 2024: R+15.5 2020: R+12.5 2016: R+10.2 2012: D+4.9 2008: D+9.0
Not yet ingested
- Civics
- —
Market trends
- HPI YoY
- ▼ -146.76%
- Current HPI
- 196.8027
- Rent YoY
- —
- Metro
- Akron, OH
- State GDP YoY
- ▲ 1.98%
- F500 in state
- 48
Industry mix (Fortune 500 HQ in OH)
| Industry | F500 HQs | Revenue |
|---|---|---|
| Insurance | 3 | $145B |
|
||
| Industrial Machinery | 3 | $49B |
|
||
| Financial Services | 3 | $24B |
|
||
| Consumer Goods | 2 | $93B |
|
||
| Aerospace / Defense | 2 | $47B |
|
||
| Utilities | 2 | $33B |
|
||
Price history
+438.5% since first listed8 events — show timeline
- 2026-04-30 Price Changed $175,000 MLSNOW
- 2026-04-22 Listed for Rent $850 RENTALBEAST
- 2026-03-26 Listed $185,000 MLSNOW
- 2025-03-26 Rental Removed $850 RENTALBEAST
- 2025-03-23 Listed for Rent $850 RENTALBEAST
- 2022-02-11 Sold (Public Records) $49,000 Public Records
- 2021-02-01 Sold (Public Records) $49,000 Public Records
- 2020-11-10 Sold (Public Records) $32,500 Public Records
Property tax history
+4.2%/yrLatest (2025): $2,305 · +17.3% YoY. Source: county tax records.
Cash-flow waterfall
monthlySold comps — $/sqft
last 12 mo · ≤1 miLoading sold comps…