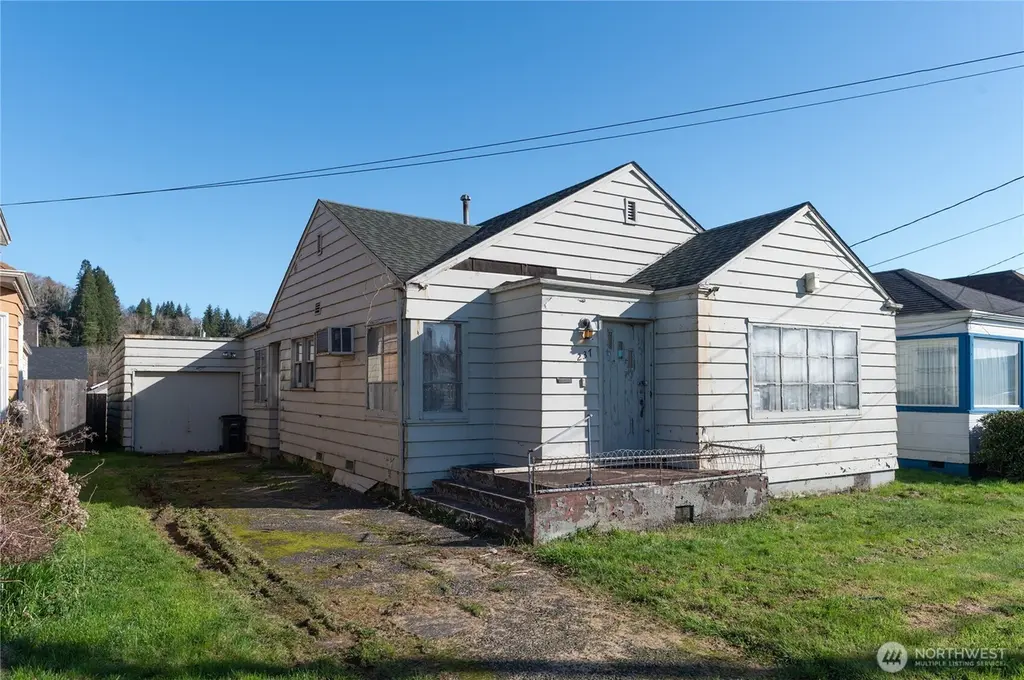
237 Emerson Ave · Hoquiam, WA
Flood risk 6/10 · Moderate
- FEMA flood zone
- AE
- Chance of flooding over 30 yrs
- 0.68%
- Est. flood insurance / yr
- $1,737 – $8,500
Fire risk 1/10 · Minimal
- Est. fire insurance / yr
- $604 – $1,122
Heat risk 1/10 · Minimal
- Hot days now (above 75°F)
- 8 days/yr
- Hot days in 30 yrs
- 19 days/yr
Wind risk 1/10 · Minimal
- Chance of severe wind over 30 yrs
- —
Air-quality risk 6/10 · Moderate
- Unhealthy air days now
- 6 days/yr
- Unhealthy air days in 30 yrs
- 6 days/yr
Risk factors via First Street. Map © Google.
Why this score? — see what drove the B+ grade
The composite is a weighted blend of 9 inputs, each scored 0–100. Each bar is that input's sub-score; the figure is the points it added to the 100-point composite (weight × sub-score).
- Cash flow +30.0/30.0
- ARV discount +15.0/15.0
- DSCR +10.0/10.0
- 1% rule +8.6/10.0
- Livability +3.8/5.0
- Schools +3.2/10.0
- Rent growth +2.5/5.0
- Condition / age +2.5/5.0
- Appreciation +0.0/10.0
$125,000
🖨 Deal sheet (PDF) 📄 Offer letter ✓ Due diligence
Listing remarks
Bring your vision or your investor! Quaint vintage home located just outside of downtown Hoquiam, full of potential and ready for its next chapter. This property offers a great opportunity to restore, update, or reimagine the space to fit your needs. Conveniently located just minutes from local schools, the skate park, airport, and Old Cannery Park, with easy access to everyday amenities. Whether you're looking for your next project or a place to add your personal touch, this home is ready for new possibilities.
Key facts
- 5,227 sq ft lot
- Garage
- Built 1940
Neighborhood map
What this means for you Summary
Snapshot
- This is a 2-bed/1.0-bath single-family listed at $125k.
Deal economics
- At list price, monthly cash flow is $89 ($1k/yr) — positive.
- The deal already cash-flows at list — no discount required.
- Meets the 1% rule at list price ($2k rent vs $125k).
- Recommended offer: $118k (6.0% below list) — sets the bar for market timing.
- Cap rate 11.2% vs local median 3.6% in Hoquiam — top-decile yield for the area; either an underpriced asset or a hidden risk that comps aren't pricing in. Stress-test before assuming the spread holds.
Location & tenants
- Location reads 75/100 on livability (#171 in WA, #4,268 nationally) — a middle-class / working-renter tenant base. Strengths: commute A+, cost of living A+, housing A+; Watch: health & safety C-, employment D, amenities F.
- Hoquiam School District (town): math 30% / reading 41% proficiency, ranked #250 of 291 in WA (top 86%) — families likely to look elsewhere, expect single-tenant / working-renter base with shorter leases.
- Zoned schools: Emerson Elementary (269 students, 82% FRL); Hoquiam Middle School (370 students, 74% FRL); Hoquiam High School (450 students, 66% FRL) — zoned schools average 74% FRL vs 58% district-wide (16 pts higher); higher-poverty schools than district average — tighter screening recommended.
- Market conditions: 155 active listings in the ZIP; 1 comparable units currently listed for rent nearby; 297 units permitted in Grays Harbor County in 2024 (17 in 5+ unit buildings).
- This rent runs 37% of the median local income ($55k/yr) — at the standard rent-burdened threshold; future hikes will face affordability resistance.
Forward outlook
- Local home prices are declining (-3.0%/yr); year-one equity from $864 of loan paydown is wiped out by about $4k of value loss. Plan a longer hold.
- Grays Harbor County population projected at -24% by 2050 — secular population decline; favor cash flow + early exit over multi-decade hold.
Negotiation context
- It's been on market 85 days — a 6% lower offer ($118k) is reasonable based on typical stale-listing flexibility.
Risks & watch-outs
- Watch-outs: flood insurance adds $427/mo; built in 1940 — expect roof / HVAC / electrical / plumbing capex.
- Climate carrying-cost: in FEMA flood zone AE (mandatory federal flood insurance) — expect insurance premiums to compound above CPI over the hold.
Questions for the listing agent
- It's been on market 85 days. Have you received any prior offers? Is the seller open to a 6% concession, seller financing, or rate buy-down credit?
- Built in 1940 — when were the roof, HVAC, electrical panel, plumbing, and water heater last replaced?
- What's the actual annual flood-insurance premium (NFIP or private), and is the property in a SFHA with mandatory coverage?
- Why hasn't it sold? Are there any deal-killer items the seller is aware of (foundation, flood, title, zoning, code violations)?
- Is there a deadline driving the sale (1031 exchange, divorce, estate, relocation)? That informs how much negotiation room exists.
- Schools are D-rated, which usually means shorter tenancies and higher turnover. Who's the typical renter profile here, and what's been the actual vacancy rate?
- What's the average days-on-market for RENTAL listings here right now (not sales)? A rising rental-DOM trend means longer vacancies and softer asking-rent achievability than the comps imply.
- What's the recent tenant-quality profile in this submarket — average credit score on applications, eviction rate, late-payment / NSF rate, and stable-employment percentage? A property-management company in the area should have these aggregated.
- How much new for-sale + rental construction is in the pipeline within 1–3 miles? Heavy new supply typically softens prices + rents 12–24 months out; constrained supply supports both.
Investment metrics
- 1% rule
- 1.36% ✓
- Cap rate
- 11.24%
- Cash-on-cash
- 17.69%
- DSCR
- 1.79
- GRM
- 6.1
CMA / ARV
- ARV (median comp)
- $249,543
- List price
- $125,000
- Delta
- -49.91%
- Verdict
- UNDERPRICED
- Comps
- 20 within 1.0 mi
Show comp detail 12 sales within ~0.75 mi
| Address | Dist | Beds/Ba | Sqft | Sold | Price | $/sf | Match |
|---|---|---|---|---|---|---|---|
| 816 Spruce St | 0.12mi | 2/1.0 | 1,199 (+7%) | 1mo | $274,000 | $229 | 82 |
| 432 Eklund Ave | 0.26mi | 2/1.0 | 1,088 (-3%) | 2mo | $190,000 | $175 | 81 |
| 401 Emerson Ave | 0.19mi | 3/1.0 (+1) | 1,196 (+6%) | 3mo | $249,885 | $209 | 73 |
| 210 W Emerson Ave | 0.32mi | 3/1.0 (+1) | 1,119 (-0%) | 8mo | $214,000 | $191 | 73 |
| 231 Karr Ave | 0.06mi | 3/1.0 (+1) | 1,046 (-7%) | 12mo | $265,000 | $253 | 71 |
| 324 Wheeler Ave | 0.24mi | 2/1.0 | 1,176 (+5%) | 15mo | $235,000 | $200 | 69 |
| 402 L St | 0.39mi | 2/1.0 | 1,052 (-6%) | 5mo | $255,000 | $242 | 67 |
| 342 Wheeler Ave | 0.26mi | 3/1.0 (+1) | 996 (-11%) | 2mo | $105,000 | $105 | 62 |
| 245 Eklund Ave | 0.13mi | 3/1.0 (+1) | 1,288 (+15%) | 3mo | $246,000 | $191 | 62 |
| 213 Garfield St | 0.37mi | 2/1.0 | 1,226 (+9%) | 11mo | $115,500 | $94 | 58 |
| 408 Karr Ave | 0.20mi | 3/1.0 (+1) | 1,284 (+14%) | 5mo | $211,500 | $165 | 58 |
| 311 N St | 0.34mi | 2/1.0 | 1,269 (+13%) | 10mo | $220,500 | $174 | 54 |
Match score weights: distance 35% · size 25% · config 20% · recency 20%. Top-matched comps best support the ARV.
Projected returns pro-forma
-3.0% appreciation · 3.0% rent growth · sell at horizon
- IRR
- -11.2%
- Equity multiple
- 0.59×
- Total profit
- $-14,306
- Equity at exit
- $18,638
- IRR
- -1.7%
- Equity multiple
- 0.88×
- Total profit
- $-4,069
- Equity at exit
- $10,808
Cash invested: $35,000 (down + closing). Projections, not guarantees.
Landlord ↔ Tenant lean methodology
- Overall (STATE)
- 28 Tenant-Leaning
- State Washington
- 28 Tenant-Leaning · D+8
- County
- — inherits STATE
- City
- — inherits STATE
ZIP-level market 98550
- Active inventory
- 155
- Price-to-rent
- 6.1×
Monthly cashflow live
- Estimated rent
- $1,694 medium interval (Pro) →
- Mortgage (P&I)
- −$656
- Tax from tax record
- −$115 /mo · $1,380/yr
- Insurance
- −$52
- Flood insurance flood zone
- −$427 /mo · $5,118/yr
- HOA
- −$0
- Vacancy / Maint / Mgmt
- −$356
- Net cashflow
- $89
Break-even live
Sensitivity live
| Price | -10% $160 | -5% $125 | +0% $89 | +5% $54 | +10% $19 |
|---|---|---|---|---|---|
| Rent | -10% $-45 | -5% $22 | +0% $89 | +5% $156 | +10% $223 |
| Rate | -1.0pp $152 | -0.5pp $121 | base $89 | +0.5pp $57 | +1.0pp $24 |
UW: 25.0% down · 7.5% · 30yr · 1.5% tax · 5.0% vac · 8.0% maint · 8.0% mgmt
Financing live
Cash to close
- Down payment
- $31,250
- Closing costs
- $3,750
- Reserves months
- —
- Total cash needed
- —
Loan-product check · same deal, 3 products live
Conventional
25% down · 7.5% · 30yr
- Down + closing
- —
- Monthly P&I
- —
- Monthly cashflow
- —
- DSCR
- —
- Eligible?
- —
Personal DTI + credit; lowest rate.
DSCR
20% down · 8.5% · 30yr
- Down + closing
- —
- Monthly P&I
- —
- Monthly cashflow
- —
- DSCR
- —
- Eligible?
- —
No personal income docs; deal must DSCR.
Hard money
10% down · 12.0% · 12mo
- Down + closing
- —
- Monthly P&I
- —
- Monthly cashflow
- —
- DSCR
- —
- Eligible?
- —
Short-term bridge; refi at stabilization.
Rent comps 1 comps
| Address | Beds | Baths | Sqft | Rent | $/sqft | DOM | Units | Dist |
|---|---|---|---|---|---|---|---|---|
| 335 Endresen Rd Hoquiam, WA | 3.0 | 1.0 | 914 | $2,300 | $2.52 | 46d | 1 | 0.81mi |
Listing history 16 events
-
2026-06-21status $125,000 Pending 85 DOM
-
2026-06-16days on market $125,000 Active 85 DOM
-
2026-06-15days on market $125,000 Active 84 DOM
-
2026-06-14days on market $125,000 Active 82 DOM
-
2026-06-12days on market $125,000 Active 81 DOM
-
2026-06-09days on market $125,000 Active 78 DOM
-
2026-06-09price $125,000 Active 77 DOM
-
2026-06-08days on market $159,000 Active 77 DOM
-
2026-06-07days on market $159,000 Active 76 DOM
-
2026-06-05days on market $159,000 Active 73 DOM
-
2026-06-03days on market $159,000 Active 72 DOM
-
2026-06-02days on market $159,000 Active 71 DOM
-
2026-06-01days on market $159,000 Active 70 DOM
-
2026-05-31days on market $159,000 Active 69 DOM
-
2026-05-30days on market $159,000 Active 68 DOM
-
2026-03-23$159,000 Active
ⓘ Source: listings_history table (triggers on properties + properties_extension) + one-shot
backfill from property_details.listing_events for pre-trigger history.
Tax reassessment forecast WA · Resets to sale price
- Current annual tax
- $1,380 · $115/mo
- Projected year-2 tax
- $1,380 · $115/mo
- Expected delta
- $0/yr ($0/mo · 0.0%)
ⓘ Screening estimate from a state-policy table — verify with the county assessor before closing.
Climate risk First Street
- Flood 6/10 Major FEMA zone AE · 68% chance over 30 yrs
- Wildfire 1/10 Low
- Heat 1/10 Low 8 d/yr ≥75°F today · 19 d/yr by 30 yrs out
- Wind 1/10 Low
- Air quality 6/10 Major 6 unhealthy d/yr today · 6 by 30 yrs out
Nearby sold comps map
Loading sold comps map…
Walkable amenities ~0.75 mi
Loading nearby amenities…
Taxation est. · year 1
- Rental income
- $20,330
- − Mortgage interest
- −$7,002
- − Property taxes
- −$1,380
- − Insurance
- −$5,744
- − Repairs & maintenance
- −$1,626
- − Management
- −$1,626
- − Depreciation
- −$3,636
- Taxable loss
- −$684
- Est. tax savings @ 24.0%
- +$164
- After-tax cash flow
- $1,236/yr
For passive investors: Depreciation is non-cash, so a rental often shows a tax loss while cash-flowing — sheltering income. Rental losses are passive: they offset passive income freely, and up to $25,000/yr can offset ordinary (W-2) income if you actively participate and your MAGI is under $100k (phasing out to $0 by $150k); unused losses carry forward. On sale, claimed depreciation is recaptured at up to 25%, and gains may owe capital-gains tax (a 1031 exchange can defer both). Figures are a year-1 estimate at your 24.0% rate — not tax advice; consult a CPA.
Schools (NCES district)
- District
- Hoquiam School District
- NCES district ID
- 5303660
- Math proficiency
- 30% ▬ 0.00%
- Reading proficiency
- 41% ▲ 1.00%
- Median HH income
- $39,039
- Composite
- 32.31/100
- National rank
- #10914
- State rank
- #250 of 291 in WA
Livability — Hoquiam
- Score
- 75/100
- State rank
- #171
- US rank
- #4268
Category grades
Schools grade is shown separately in the Schools card above.
Census & demographics
- Census place
- Hoquiam, WA
- County
- Grays Harbor County · 44,693 people
- City population
- 12,316
- Metro
- Aberdeen, WA
- Population (ZIP)
- 12,316
- Household income
- $55,040
- Rent vs Own
- Severe rent burden
- 438.0
Population outlook (Grays Harbor County) Hauer SSP2
- Today (2025)
- 66,443 people
- By 2030
- 63,255 · -4.8%
- By 2040
- 56,466 · -15.0%
- By 2050
- 50,516 · -24.0%
- By 2075
- 39,296 · -40.9%
- By 2100
- 31,142 · -53.1%
Race, ethnicity, and origin ACS 2023
- Neighborhood character
- Predominantly White (82%)
- Race & ethnicity
- White 82% Hispanic / Latino 6% Two or more races 6% Native American 4% Asian 2% Black 1%
- Hispanic origin (detail)
- Mexican 5%
- Common ancestry
- Portuguese 6% Romanian 4% Slovak 3%
- Foreign-born
- 4% · Canada, China
- Languages at home
- 94% English-only · Spanish 4% Chinese 1% Russian/Polish/Slavic 1%
Political lean MEDSL · Grays Harbor
- 2024 margin
- Lean R (+6.0) · D 45.6% · R 51.6% · Other 2.8%
- 2008→2024 swing
- -20.6pp toward R · 2008: 14.6pp · 2024: -6.0pp
- All cycles
- 2024: R+6.0 2020: R+6.6 2016: R+7.1 2012: D+14.0 2008: D+14.6
Not yet ingested
- Civics
- —
Market trends
- HPI YoY
- ▼ -136.94%
- Current HPI
- 249.3102
- Rent YoY
- —
- Metro
- Aberdeen, WA
- State GDP YoY
- ▲ 4.65%
- F500 in state
- 22
Industry mix (Fortune 500 HQ in WA)
| Industry | F500 HQs | Revenue |
|---|---|---|
| Retail | 2 | $269B |
|
||
| Technology / Retail | 1 | $638B |
|
||
| Technology | 1 | $245B |
|
||
| Telecommunications | 1 | $38B |
|
||
| Food / Beverage | 1 | $36B |
|
||
| Automotive / Trucks | 1 | $34B |
|
||
Price history
1 event — show timeline
- 2026-03-23 Listed $159,000 NWMLS as Distributed by MLS Grid
Property tax history
+4.5%/yrLatest (2026): $1,380 · +3.3% YoY. Source: county tax records.
Cash-flow waterfall
monthlySold comps — $/sqft
last 12 mo · ≤1 miLoading sold comps…