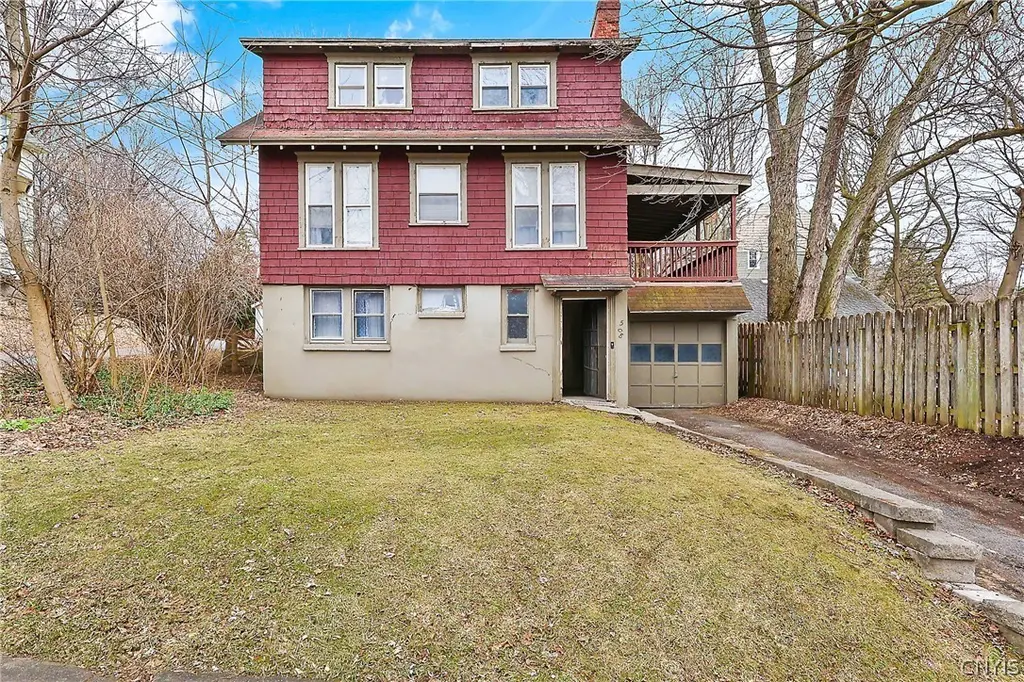
508 Elm St · Syracuse, NY
Flood risk 1/10 · Minimal
- FEMA flood zone
- X (unshaded)
- Chance of flooding over 30 yrs
- 0.0%
- Est. flood insurance / yr
- $473 – $860
Fire risk 1/10 · Minimal
- Est. fire insurance / yr
- $691 – $1,283
Heat risk 3/10 · Minor
- Hot days now (above 94°F)
- 7 days/yr
- Hot days in 30 yrs
- 15 days/yr
Wind risk 1/10 · Minimal
- Chance of severe wind over 30 yrs
- 0.0%
Air-quality risk 2/10 · Minimal
- Unhealthy air days now
- 0 days/yr
- Unhealthy air days in 30 yrs
- 1 days/yr
Risk factors via First Street. Map © Google.
Why this score? — see what drove the B- grade
The composite is a weighted blend of 9 inputs, each scored 0–100. Each bar is that input's sub-score; the figure is the points it added to the 100-point composite (weight × sub-score).
- Cash flow +26.6/30.0
- ARV discount +13.4/15.0
- DSCR +9.1/10.0
- 1% rule +6.3/10.0
- Rent growth +4.6/5.0
- Livability +3.9/5.0
- Condition / age +2.5/5.0
- Schools +1.8/10.0
- Appreciation +0.0/10.0
$165,000
🖨 Deal sheet (PDF) 📄 Offer letter ✓ Due diligence
Listing remarks
Spacious and bright 4 bedrooms home within walking distance to Lincoln Park, Sedgwick, downtown, school & stores. Not your average cookie cutter, this home has characters with first floor entrance landing, first floor office can be used as a bedroom & utilities room w/ ample of storage area. Second level living space with sitting area, dining room and kitchen. There is a covered open porch looking out to the backyard & a great entertaining space for cookout. Third floor is where all the 3 bedrooms and full bath are located. Great floor plan and layout perfect for your all season home.
Key facts
- First floor office
- Entertaining space
- Utilities room
Tags
Property features AI
Finance
- Other: Listing provided by Coldwell Banker Prime Prop, Inc.; Listing agent: Susan Li
- Financial info: Sign in or register to view financial details
- HOA & community: Sign in or register to view HOA or community details
Exterior
- Parking: Sign in or register to view parking details
- Security: Sign in or register to view security features
- Utilities: Sign in or register to view utilities
- Home design: Single-family property; Sign in or register to view stories, entry level, and facing direction
- Construction: Sign in or register to view construction details
- Exterior features: Sign in or register to view exterior details
Interior
- Kitchen: Sign in or register to view kitchen details
- Bedrooms: Sign in or register to view bedroom details
- Flooring: Sign in or register to view flooring details
- Bathrooms: Sign in or register to view bathroom details
- Heating & cooling: Sign in or register to view heating and cooling details
- Interior features: Sign in or register to view additional interior details
- Laundry & utility: Sign in or register to view laundry and utility details
Neighborhood map
What this means for you Summary
Snapshot
- This is a 3-bed/1.0-bath single-family listed at $165k.
Deal economics
- At list price, monthly cash flow is $441 ($5k/yr) — positive.
- The deal already cash-flows at list — no discount required.
- Meets the 1% rule at list price ($2k rent vs $165k).
- Recommended offer: $155k (6.0% below list) — sets the bar for market timing.
Location & tenants
- Location reads 77/100 on livability (#187 in NY, #2,869 nationally) — a middle-class / working-renter tenant base. Strengths: amenities A+, commute A+, cost of living A+; Watch: crime F, employment D-.
- Syracuse City School District (urban): math 18% / reading 26% proficiency, ranked #590 of 590 in NY (top 100%) — low school quality limits family demand, transient renter base, plan for 1-2y turnover; 74% free/reduced lunch — lower-income household profile, screen leases tightly.
- Zoned schools: Dr Weeks Elementary School (math 4% / reading 12%, grade F, #2,086 of 2,108 statewide, top 99%, 714 students, 91% FRL); Lincoln Middle School (math 8% / reading 14%, grade F, #721 of 729 statewide, top 99%, 508 students, 90% FRL); Henninger High School (math 65% / reading 50%, grade C, #885 of 1,100 statewide, top 81%, 1,499 students, 85% FRL).
- Market conditions: Rents rising fast (+8.4%/yr); 55 active listings in the ZIP; 40 comparable units currently listed for rent nearby; rentals at typical pace (median 23d on market — plan ~3-4 weeks tenant-placement turnaround); 48% of comp listings sitting > 30 days — soft ceiling on asking rent; 616 units permitted in Onondaga County in 2024 (256 in 5+ unit buildings).
- At $1,873/mo this rent would consume 48% of the median local household income ($47k/yr) (locally 1566% of renters already pay >50% of income on rent) — very limited rent-growth headroom before tenants either downsize or default.
Forward outlook
- Local home prices are declining (-3.0%/yr); year-one equity from $1k of loan paydown is wiped out by about $5k of value loss. Plan a longer hold.
- Onondaga County population projected to shrink 9% by 2050 — rents likely to lag national; underwrite the cash flow, not the appreciation.
- At projected returns (-3.0% appreciation + 8.0% rent growth), your $46k cash investment doubles in ~7 years — after that, you're playing with house money.
Negotiation context
- It's been on market 88 days — a 6% lower offer ($155k) is reasonable based on typical stale-listing flexibility.
- Current owner paid $83k; list at $165k implies a 99% gain — meaningful room to come down on a strong offer.
Risks & watch-outs
- Watch-outs: built in 1930 — expect roof / HVAC / electrical / plumbing capex.
Questions for the listing agent
- It's been on market 88 days. Have you received any prior offers? Is the seller open to a 6% concession, seller financing, or rate buy-down credit?
- Built in 1930 — when were the roof, HVAC, electrical panel, plumbing, and water heater last replaced?
- Why hasn't it sold? Are there any deal-killer items the seller is aware of (foundation, flood, title, zoning, code violations)?
- Is there a deadline driving the sale (1031 exchange, divorce, estate, relocation)? That informs how much negotiation room exists.
- Schools are D-rated, which usually means shorter tenancies and higher turnover. Who's the typical renter profile here, and what's been the actual vacancy rate?
- Crime grade is F in this area — have there been break-ins, vandalism, or insurance claims at this property in the last 3 years? What carrier currently insures it and at what premium?
- What's the average days-on-market for RENTAL listings here right now (not sales)? A rising rental-DOM trend means longer vacancies and softer asking-rent achievability than the comps imply.
- What's the recent tenant-quality profile in this submarket — average credit score on applications, eviction rate, late-payment / NSF rate, and stable-employment percentage? A property-management company in the area should have these aggregated.
- How much new for-sale + rental construction is in the pipeline within 1–3 miles? Heavy new supply typically softens prices + rents 12–24 months out; constrained supply supports both.
Investment metrics
- 1% rule
- 1.13% ✓
- Cap rate
- 9.50%
- Cash-on-cash
- 11.44%
- DSCR
- 1.51
- GRM
- 7.3
CMA / ARV
- ARV (on-the-fly)
- $190,080
- Comps found
- 12
Show comp detail 12 sales within ~0.75 mi
| Address | Dist | Beds/Ba | Sqft | Sold | Price | $/sf | Match |
|---|---|---|---|---|---|---|---|
| 508 Elm St | 0.00mi | 4/1.0 (+1) | 1,440 (0%) | 0mo | $160,000 | $111 | 95 |
| 206 Sedgwick St | 0.08mi | 3/2.0 | 1,368 (-5%) | 1mo | $80,000 | $58 | 83 |
| 209 Boyden St | 0.30mi | 3/1.5 | 1,416 (-2%) | 5mo | $178,571 | $126 | 77 |
| 127 Schuler St | 0.38mi | 4/1.5 (+1) | 1,448 (+1%) | 1mo | $225,000 | $155 | 74 |
| 321 Dewitt St | 0.43mi | 3/1.5 | 1,310 (-9%) | 6mo | $175,000 | $134 | 58 |
| 200 Helen St | 0.48mi | 2/1.5 (-1) | 1,329 (-8%) | 5mo | $175,100 | $132 | 54 |
| 227 Hixson St | 0.64mi | 3/1.5 | 1,536 (+7%) | 5mo | $154,900 | $101 | 53 |
| 204 Kline St | 0.68mi | 3/2.0 | 1,524 (+6%) | 2mo | $278,750 | $183 | 53 |
| 122 Craton St | 0.33mi | 4/1.5 (+1) | 1,652 (+15%) | 7mo | $130,000 | $79 | 47 |
| 409 Hixson Ave | 0.60mi | 3/1.5 | 1,232 (-14%) | 1mo | $155,000 | $126 | 45 |
| 310 Helen St | 0.60mi | 2/1.5 (-1) | 1,274 (-12%) | 4mo | $191,000 | $150 | 42 |
| 619 Dewitt St | 0.67mi | 4/1.5 (+1) | 1,588 (+10%) | 5mo | $248,000 | $156 | 40 |
Match score weights: distance 35% · size 25% · config 20% · recency 20%. Top-matched comps best support the ARV.
Projected returns pro-forma
-3.0% appreciation · 8.0% rent growth · sell at horizon
- IRR
- 5.9%
- Equity multiple
- 1.24×
- Total profit
- $11,186
- Equity at exit
- $24,602
- IRR
- 19.2%
- Equity multiple
- 2.96×
- Total profit
- $90,780
- Equity at exit
- $14,266
Cash invested: $46,200 (down + closing). Projections, not guarantees.
Landlord ↔ Tenant lean methodology
- Overall (STATE)
- 15 Strongly Tenant-Friendly
- State New York
- 15 Strongly Tenant-Friendly · D+10
- County
- — inherits STATE
- City
- — inherits STATE
ZIP-level market 13203
- Home prices YoY
- -11.9%
- Rents YoY
- 8.4%
- Active inventory
- 55
- Price-to-rent
- 7.3×
Monthly cashflow live
- Estimated rent
- $1,873 high interval (Pro) →
- Mortgage (P&I)
- −$865
- Tax from tax record
- −$105 /mo · $1,258/yr
- Insurance
- −$69
- HOA
- −$0
- Vacancy / Maint / Mgmt
- −$393
- Net cashflow
- $441
Break-even live
Sensitivity live
| Price | -10% $534 | -5% $487 | +0% $441 | +5% $394 | +10% $347 |
|---|---|---|---|---|---|
| Rent | -10% $293 | -5% $367 | +0% $441 | +5% $515 | +10% $589 |
| Rate | -1.0pp $524 | -0.5pp $483 | base $441 | +0.5pp $398 | +1.0pp $354 |
UW: 25.0% down · 7.5% · 30yr · 1.5% tax · 5.0% vac · 8.0% maint · 8.0% mgmt
Financing live
Cash to close
- Down payment
- $41,250
- Closing costs
- $4,950
- Reserves months
- —
- Total cash needed
- —
Loan-product check · same deal, 3 products live
Conventional
25% down · 7.5% · 30yr
- Down + closing
- —
- Monthly P&I
- —
- Monthly cashflow
- —
- DSCR
- —
- Eligible?
- —
Personal DTI + credit; lowest rate.
DSCR
20% down · 8.5% · 30yr
- Down + closing
- —
- Monthly P&I
- —
- Monthly cashflow
- —
- DSCR
- —
- Eligible?
- —
No personal income docs; deal must DSCR.
Hard money
10% down · 12.0% · 12mo
- Down + closing
- —
- Monthly P&I
- —
- Monthly cashflow
- —
- DSCR
- —
- Eligible?
- —
Short-term bridge; refi at stabilization.
Rent comps 40 comps
| Address | Beds | Baths | Sqft | Rent | $/sqft | DOM | Units | Dist |
|---|---|---|---|---|---|---|---|---|
| 1618 James St #3 Syracuse, NY | 2.0 | 1.0 | 1150 | $2,200 | $1.91 | 15d | 1 | 0.46mi |
| 525 Burnet Ave Unit First Floor Syracuse, NY | 3.0 | 1.0 | 900 | $1,650 | $1.83 | 45d | 1 | 0.55mi |
| 204 Mariposa St Unit pvt house Syracuse, NY | 3.0 | 1.0 | 1128 | $2,137 | $1.89 | 15d | 1 | 0.61mi |
| 1801 James St #2 Syracuse, NY | 3.0 | 1.0 | 1244 | $1,800 | $1.45 | 15d | 1 | 0.68mi |
| 300 University Ave Syracuse, NY | 2.0 | 1.0 | 1020 | $2,150 | $2.11 | 15d | 1 | 0.71mi |
| 746 E Laurel St Unit 1 Syracuse, NY | 4.0 | 2.0 | 1400 | $1,500 | $1.07 | 45d | 1 | 0.72mi |
| 205A Hawley Ave Unit 211C Syracuse, NY | 3.0 | 2.5 | 1350 | $1,675 | $1.24 | 45d | 1 | 0.72mi |
| 205A Hawley Ave Unit 213C Syracuse, NY | 3.0 | 2.5 | 1350 | $1,650 | $1.22 | 45d | 1 | 0.72mi |
| 900 E Fayette St Syracuse, NY | 1.0–2.0 | 1.0 | 817 | $1,995 | $2.44 | 15d | 9 | 0.77mi |
| 112 Gale Ave Unit 1 Syracuse, NY | 2.0 | 1.0 | 1848 | $1,400 | $0.76 | 45d | 1 | 0.78mi |
| 423 Wendell Ter Syracuse, NY | 4.0 | 1.0 | 1312 | $2,500 | $1.91 | 15d | 1 | 0.85mi |
| 126 Woodruff Ave Syracuse, NY | 3.0 | 1.0 | 1200 | $1,675 | $1.40 | 45d | 1 | 0.86mi |
| 917 Madison St #5 Syracuse, NY | 2.0 | 1.0 | 1000 | $1,600 | $1.60 | 45d | 1 | 0.87mi |
| 1108 Madison St Unit 2 Syracuse, NY | 3.0 | 1.5 | 1580 | $2,080 | $1.32 | 45d | 1 | 0.89mi |
| 502 University Ave Syracuse, NY | 1.0–2.0 | 1.0 | 950 | $1,450 | $1.53 | 15d | 2 | 0.93mi |
| 912 Park St Unit 1 Syracuse, NY | 3.0 | 1.0 | 1040 | $1,200 | $1.15 | 45d | 1 | 1.01mi |
| 202 Stafford Ave Syracuse, NY | 3.0 | 1.0 | 1692 | $1,800 | $1.06 | 15d | 1 | 1.03mi |
| 610 E Division St Unit F2 Syracuse, NY | 2.0 | 1.0 | 900 | $1,150 | $1.28 | 45d | 1 | 1.03mi |
| 60 Presidential Plz Syracuse, NY | 1.0–2.0 | 1.0–1.5 | 970 | $1,315 | $1.36 | 45d | 1 | 1.06mi |
| 416 Pearl St Unit 2 Syracuse, NY | 3.0 | 1.0 | 900 | $2,400 | $2.67 | 15d | 1 | 1.08mi |
| 225 Marlborough Rd Syracuse, NY | 2.0 | 1.0 | 1040 | $1,800 | $1.73 | 15d | 1 | 1.25mi |
| 213 Beattie St Syracuse, NY | 2.0 | 1.0 | 975 | $1,370 | $1.41 | 15d | 1 | 1.26mi |
| 205 E Jefferson St Unit 2B Syracuse, NY | 2.0 | 2.5 | 1100 | $2,200 | $2.00 | 23d | 1 | 1.27mi |
| 807-13 N Salina St Unit 809A Syracuse, NY | 2.0 | 1.0 | 1020 | $1,325 | $1.30 | 45d | 1 | 1.27mi |
| 201 E Jefferson St Syracuse, NY | 2.0 | 1.0 | 662 | $1,626 | $2.45 | 15d | 9 | 1.28mi |
| 319 S Salina St Syracuse, NY | 2.0 | 2.0 | 1860 | $2,000 | $1.08 | 23d | 1 | 1.30mi |
| 321 S Salina St Unit 501 Syracuse, NY | 2.0 | 1.0 | 1446 | $3,000 | $2.07 | 45d | 1 | 1.31mi |
| 321 S Salina St Unit 201 Syracuse, NY | 2.0 | 1.0 | 1446 | $2,450 | $1.69 | 45d | 1 | 1.31mi |
| 208 W Water St Syracuse, NY | 2.0 | 2.0 | 962 | $1,800 | $1.87 | 45d | 1 | 1.34mi |
| 129 W Fayette St Unit 217 Syracuse, NY | 2.0 | 2.0 | 1100 | $1,550 | $1.41 | 15d | 1 | 1.35mi |
| 317 S Clinton St Unit 4A Syracuse, NY | 2.0 | 1.5 | 1500 | $2,100 | $1.40 | 15d | 1 | 1.36mi |
| 317 S Clinton St Unit 3A Syracuse, NY | 2.0 | 2.0 | 1500 | $2,100 | $1.40 | 45d | 1 | 1.36mi |
| 118 Niven St Syracuse, NY | 3.0 | 1.0 | 1150 | $1,650 | $1.43 | 23d | 1 | 1.37mi |
| 205 Fellows Ave Unit 1 Syracuse, NY | 3.0 | 1.0 | 1638 | $1,800 | $1.10 | 23d | 1 | 1.37mi |
| 110 Walton St Unit 201 Syracuse, NY | 2.0 | 2.0 | 1051 | $2,200 | $2.09 | 45d | 1 | 1.41mi |
| 110 Walton St Unit 301 Syracuse, NY | 2.0 | 2.0 | 1051 | $2,000 | $1.90 | 23d | 1 | 1.41mi |
| 210 W Division St Unit 87 Syracuse, NY | 2.0 | 2.0 | 1200 | $1,750 | $1.46 | 45d | 1 | 1.41mi |
| 210 W Division St Unit 24 Syracuse, NY | 2.0 | 2.0 | 1200 | $1,850 | $1.54 | 23d | 1 | 1.41mi |
| 120 Walton St Syracuse, NY | 1.0–2.0 | 1.0–2.0 | 825 | $3,200 | $3.88 | 45d | 2 | 1.42mi |
| 111 E Onondaga St Syracuse, NY | 1.0–2.0 | 1.0–2.0 | 1150 | $3,000 | $2.61 | 23d | 5 | 1.42mi |
Listing history 11 events
-
2026-06-09status $165,000 Pending 88 DOM
-
2026-06-08days on market $165,000 Active Under Contract 88 DOM
-
2026-06-07days on market $165,000 Active Under Contract 87 DOM
-
2026-06-05days on market $165,000 Active Under Contract 84 DOM
-
2026-06-02days on market $165,000 Active Under Contract 82 DOM
-
2026-06-01days on market $165,000 Active Under Contract 81 DOM
-
2026-05-31days on market $165,000 Active Under Contract 80 DOM
-
2026-05-30days on market $165,000 Active Under Contract 79 DOM
-
2026-04-07historical Active Under Contract
-
2026-03-12$165,000 Active
-
2007-10-15soldstatus $83,000
ⓘ Source: listings_history table (triggers on properties + properties_extension) + one-shot
backfill from property_details.listing_events for pre-trigger history.
Tax reassessment forecast NY · Partial reset (capped growth)
- Current annual tax
- $1,258 · $105/mo
- Projected year-2 tax
- $2,023 · $169/mo
- Expected delta
- +$765/yr (+$64/mo · 60.8%)
ⓘ Screening estimate from a state-policy table — verify with the county assessor before closing.
Climate risk First Street
- Flood 1/10 Low FEMA zone X (unshaded) · 0% chance over 30 yrs
- Wildfire 1/10 Low
- Heat 3/10 Moderate 7 d/yr ≥94°F today · 15 d/yr by 30 yrs out
- Wind 1/10 Low 0% chance of damaging wind over 30 yrs
- Air quality 2/10 Low 0 unhealthy d/yr today · 1 by 30 yrs out
Nearby sold comps map
Loading sold comps map…
Walkable amenities ~0.75 mi
Loading nearby amenities…
Taxation est. · year 1
- Rental income
- $22,473
- − Mortgage interest
- −$9,243
- − Property taxes
- −$1,258
- − Insurance
- −$825
- − Repairs & maintenance
- −$1,798
- − Management
- −$1,798
- − Depreciation
- −$4,800
- Taxable income
- $2,751
- Est. tax owed @ 24.0%
- −$660
- After-tax cash flow
- $4,627/yr
For passive investors: Depreciation is non-cash, so a rental often shows a tax loss while cash-flowing — sheltering income. Rental losses are passive: they offset passive income freely, and up to $25,000/yr can offset ordinary (W-2) income if you actively participate and your MAGI is under $100k (phasing out to $0 by $150k); unused losses carry forward. On sale, claimed depreciation is recaptured at up to 25%, and gains may owe capital-gains tax (a 1031 exchange can defer both). Figures are a year-1 estimate at your 24.0% rate — not tax advice; consult a CPA.
Schools (NCES district)
- District
- Syracuse City School District
- NCES district ID
- 3628590
- Math proficiency
- 18% ▼ -5.00%
- Reading proficiency
- 26% ▬ 0.00%
- Median HH income
- $32,097
- Composite
- 17.83/100
- National rank
- #9007
- State rank
- #590 of 590 in NY
Livability — Syracuse
- Score
- 77/100
- State rank
- #187
- US rank
- #2869
Category grades
Schools grade is shown separately in the Schools card above.
Census & demographics
- Census place
- Syracuse, NY
- County
- Onondaga County · 247,257 people
- City population
- 152,627
- Metro
- Syracuse, NY
- Population (ZIP)
- 16,180
- Household income
- $46,997
- Rent vs Own
- Severe rent burden
- 1566.0
Population outlook (Onondaga County) Hauer SSP2
- Today (2025)
- 467,894 people
- By 2030
- 463,381 · -1.0%
- By 2040
- 447,697 · -4.3%
- By 2050
- 426,399 · -8.9%
- By 2075
- 373,661 · -20.1%
- By 2100
- 307,967 · -34.2%
Race, ethnicity, and origin ACS 2023
- Neighborhood character
- Diverse neighborhood (Simpson 0.67)
- Race & ethnicity
- White 52% Black 22% Hispanic / Latino 11% Two or more races 9% Asian 7%
- Hispanic origin (detail)
- Puerto Rican 6% Cuban 2%
- Common ancestry
- Romanian 3% Lithuanian 2% Iranian 2%
- Foreign-born
- 13% · Canada, India, Philippines
- Languages at home
- 81% English-only · Spanish 6% Other Indo-European 3% Other Asian/Pacific 3%
Political lean MEDSL · Onondaga
- 2024 margin
- D (+17.3) · D 58.6% · R 41.4%
- 2008→2024 swing
- -3.0pp toward R · 2008: 20.3pp · 2024: 17.3pp
- All cycles
- 2024: D+17.3 2020: D+20.6 2016: D+12.8 2012: D+21.1 2008: D+20.3
Not yet ingested
- Civics
- —
Market trends
- HPI YoY
- ▼ -35.69%
- Current HPI
- 263.2588
- Rent YoY
- ▲ 8.39%
- Metro
- Syracuse, NY
- State GDP YoY
- ▲ 2.60%
- F500 in state
- 92
Industry mix (Fortune 500 HQ in NY)
| Industry | F500 HQs | Revenue |
|---|---|---|
| Financial Services | 10 | $950B |
|
||
| Consumer Goods | 9 | $162B |
|
||
| Insurance | 4 | $225B |
|
||
| Telecommunications | 2 | $144B |
|
||
| Pharmaceuticals | 2 | $112B |
|
||
| Media / Entertainment | 2 | $69B |
|
||
Price history
+98.8% since first listed3 events — show timeline
- 2026-04-07 Contingent — CNYIS
- 2026-03-12 Listed $165,000 CNYIS
- 2007-10-15 Sold (Public Records) $83,000 Public Records
Property tax history
+1.0%/yrLatest (2025): $1,258 · +0.0% YoY. Source: county tax records.
Cash-flow waterfall
monthlySold comps — $/sqft
last 12 mo · ≤1 miLoading sold comps…