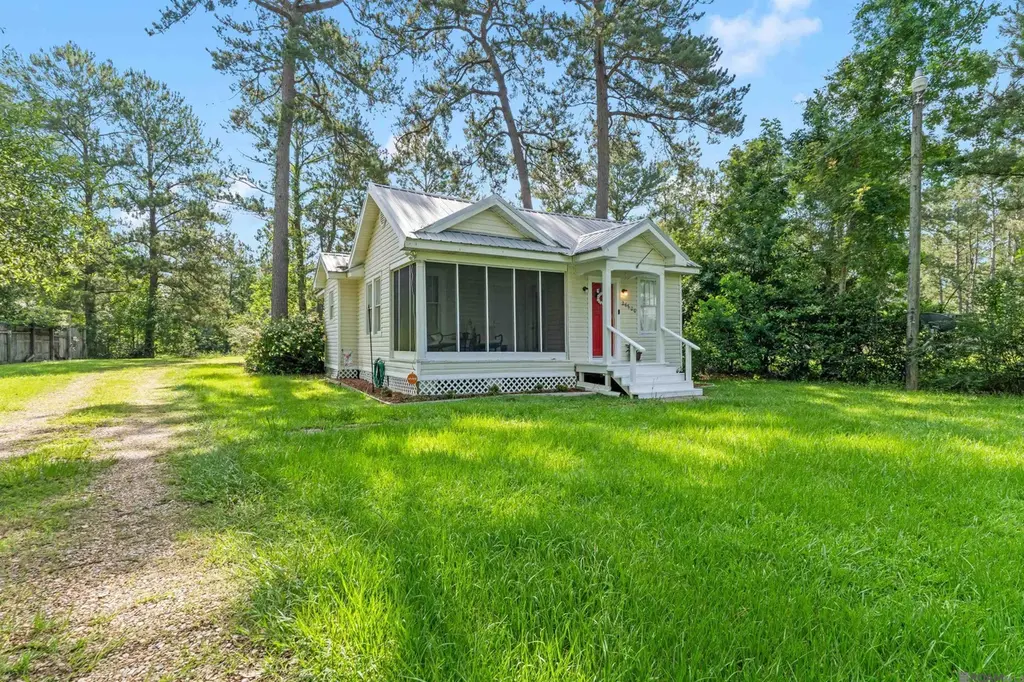
26600 George White Rd · Albany, LA
Flood risk 6/10 · Moderate
- FEMA flood zone
- X (unshaded)
- Chance of flooding over 30 yrs
- 0.71%
- Est. flood insurance / yr
- $507 – $1,088
Fire risk 5/10 · Moderate
- Est. fire insurance / yr
- $1,269 – $2,357
Heat risk 8/10 · Major
- Hot days now (above 109°F)
- 7 days/yr
- Hot days in 30 yrs
- 21 days/yr
Wind risk 9/10 · Severe
- Chance of severe wind over 30 yrs
- 99.0%
Air-quality risk 2/10 · Minimal
- Unhealthy air days now
- 0 days/yr
- Unhealthy air days in 30 yrs
- 1 days/yr
Risk factors via First Street. Map © Google.
Why this score? — see what drove the D grade
The composite is a weighted blend of 9 inputs, each scored 0–100. Each bar is that input's sub-score; the figure is the points it added to the 100-point composite (weight × sub-score).
- Cash flow +14.8/30.0
- ARV discount +7.6/15.0
- DSCR +4.5/10.0
- Schools +4.0/10.0
- Livability +3.9/5.0
- 1% rule +2.9/10.0
- Rent growth +2.5/5.0
- Condition / age +2.5/5.0
- Appreciation +0.0/10.0
$190,000
🖨 Deal sheet (PDF) 📄 Offer letter ✓ Due diligence
Listing remarks
Sitting on just under half an acre, this home in Holden is ready for its new owner. You'll notice beautiful updates throughout - featuring hardwood floors, porcelain tile, and granite countertops. Start your mornings with a cup of coffee on the screened-in porch. Located in flood X, this home has added peace of mind. The front porch recently got a fresh coat of paint for a little refresh. Did I forget to mention the chicken coop and shed? Those will be yours too! Schedule your private tour today.
Key facts
- Screened-in porch
- Shed
- Granite countertops
Tags
Property features AI
Finance
- HOA & community: Located in the Pine Lake Estates subdivision
Exterior
- Parking: 2 parking spaces
- Utilities: Public water; Septic tank
- Home design: Detached single-family residence; Residential property
- Construction: Pillar/post/pier foundation
- Exterior features: Vinyl siding; Lot roughly 0.43 acres with dimensions approx. 118 x 163 x 92 x 238
Interior
- Bathrooms: 1 full bathroom
- Interior features: Central heating; Central air conditioning
Neighborhood map
What this means for you Summary
Snapshot
- This is a 2-bed/1.0-bath single-family listed at $190k.
Deal economics
- At list price, monthly cash flow is $53 ($632/yr) — positive.
- The deal already cash-flows at list — no discount required.
- To meet the 1% rule (rent ≥ 1% of price), the offer needs to be $150k (21.3% below list).
- Recommended offer: $150k (21.3% below list) — sets the bar for 1% rule.
- Cap rate 6.6% vs local median 4.7% in Albany — top-decile yield for the area; either an underpriced asset or a hidden risk that comps aren't pricing in. Stress-test before assuming the spread holds.
Location & tenants
- Location reads 77/100 on livability (#12 in LA, #3,099 nationally) — a middle-class / working-renter tenant base. Strengths: schools A+, cost of living A+, housing A+; Watch: amenities F, commute F.
- Livingston Parish (suburban): math 40% / reading 52% proficiency, ranked #13 of 98 in LA (top 13%) — families likely to look elsewhere, expect single-tenant / working-renter base with shorter leases.
- Market conditions: 66 active listings in the ZIP; 794 units permitted in Livingston Parish in 2024 (99 in 5+ unit buildings).
Forward outlook
- Local home prices are declining (-3.0%/yr); year-one equity from $1k of loan paydown is wiped out by about $6k of value loss. Plan a longer hold.
- Livingston County population projected at +27% by 2050 — long-run rental-demand tailwind backs the buy-and-hold thesis.
Negotiation context
- It's been on market 20 days — a 2% lower offer ($187k) is reasonable based on typical stale-listing flexibility.
- 22 sale attempts since 26y ago with the ask held roughly flat each time — persistent listings suggest the price (not the market) is what's stuck; bring a comps-based counter.
- Current owner paid $151k; 26% above their basis — modest negotiation headroom, anchor on the comps not their cost.
Risks & watch-outs
- Watch-outs: built in 1953 — expect roof / HVAC / electrical / plumbing capex.
- Climate carrying-cost: major flood risk; severe wind risk, 99% chance of damaging wind over 30y; moderate wildfire risk; extreme-heat days projected 7→21/yr by 2055 (HVAC capex compounding) — expect insurance premiums to compound above CPI over the hold.
Questions for the listing agent
- Built in 1953 — when were the roof, HVAC, electrical panel, plumbing, and water heater last replaced?
- Is there a deadline driving the sale (1031 exchange, divorce, estate, relocation)? That informs how much negotiation room exists.
- Schools are A-rated — typically a magnet for longer-tenancy family renters. What's the average tenant stay here, and is there a school-zone premium baked into asking?
- The area grade is low — what's the realistic commute time and amenity access for the typical tenant pool here? Any planned neighborhood developments (good or bad) we should know about?
- What's the average days-on-market for RENTAL listings here right now (not sales)? A rising rental-DOM trend means longer vacancies and softer asking-rent achievability than the comps imply.
- What's the recent tenant-quality profile in this submarket — average credit score on applications, eviction rate, late-payment / NSF rate, and stable-employment percentage? A property-management company in the area should have these aggregated.
- How much new for-sale + rental construction is in the pipeline within 1–3 miles? Heavy new supply typically softens prices + rents 12–24 months out; constrained supply supports both.
Investment metrics
- 1% rule
- 0.79% ✗
- Cap rate
- 6.63%
- Cash-on-cash
- 1.19%
- DSCR
- 1.05
- GRM
- 10.6
CMA / ARV
- ARV (on-the-fly)
- $190,503
- Comps found
- 1
Show comp detail 1 sale within ~0.75 mi
| Address | Dist | Beds/Ba | Sqft | Sold | Price | $/sf | Match |
|---|---|---|---|---|---|---|---|
| 26655 James Chapel Rd N | 0.41mi | 3/2.0 (+1) | 1,090 (+5%) | 8mo | $199,900 | $183 | 57 |
Match score weights: distance 35% · size 25% · config 20% · recency 20%. Top-matched comps best support the ARV.
Projected returns pro-forma
-3.0% appreciation · 3.0% rent growth · sell at horizon
- IRR
- -14.5%
- Equity multiple
- 0.48×
- Total profit
- $-27,524
- Equity at exit
- $28,330
- IRR
- -5.8%
- Equity multiple
- 0.62×
- Total profit
- $-20,015
- Equity at exit
- $16,428
Cash invested: $53,200 (down + closing). Projections, not guarantees.
Landlord ↔ Tenant lean methodology
- Overall (STATE)
- 90 Strongly Landlord-Friendly
- State Louisiana
- 90 Strongly Landlord-Friendly · R+12
- County
- — inherits STATE
- City
- — inherits STATE
ZIP-level market 70744
- Home prices YoY
- -23.5%
- Active inventory
- 66
- Price-to-rent
- 10.6×
Monthly cashflow live
- Estimated rent
- $1,496 medium interval (Pro) →
- Mortgage (P&I)
- −$996
- Tax from tax record
- −$54 /mo · $642/yr
- Insurance
- −$79
- HOA
- −$0
- Vacancy / Maint / Mgmt
- −$314
- Net cashflow
- $53
Break-even live
Sensitivity live
| Price | -10% $160 | -5% $106 | +0% $53 | +5% $-1 | +10% $-55 |
|---|---|---|---|---|---|
| Rent | -10% $-65 | -5% $-6 | +0% $53 | +5% $112 | +10% $171 |
| Rate | -1.0pp $148 | -0.5pp $101 | base $53 | +0.5pp $3 | +1.0pp $-47 |
UW: 25.0% down · 7.5% · 30yr · 1.5% tax · 5.0% vac · 8.0% maint · 8.0% mgmt
Financing live
Cash to close
- Down payment
- $47,500
- Closing costs
- $5,700
- Reserves months
- —
- Total cash needed
- —
Loan-product check · same deal, 3 products live
Conventional
25% down · 7.5% · 30yr
- Down + closing
- —
- Monthly P&I
- —
- Monthly cashflow
- —
- DSCR
- —
- Eligible?
- —
Personal DTI + credit; lowest rate.
DSCR
20% down · 8.5% · 30yr
- Down + closing
- —
- Monthly P&I
- —
- Monthly cashflow
- —
- DSCR
- —
- Eligible?
- —
No personal income docs; deal must DSCR.
Hard money
10% down · 12.0% · 12mo
- Down + closing
- —
- Monthly P&I
- —
- Monthly cashflow
- —
- DSCR
- —
- Eligible?
- —
Short-term bridge; refi at stabilization.
Listing history 14 events
-
2026-06-22days on market $190,000 Active 20 DOM
-
2026-06-18days on market $190,000 Active 17 DOM
-
2026-06-17days on market $190,000 Active 16 DOM
-
2026-06-16days on market $190,000 Active 15 DOM
-
2026-06-15days on market $190,000 Active 14 DOM
-
2026-06-14days on market $190,000 Active 12 DOM
-
2026-06-13days on market $190,000 Active 11 DOM
-
2026-06-10days on market $190,000 Active 9 DOM
-
2026-06-09days on market $190,000 Active 8 DOM
-
2026-06-08days on market $190,000 Active 7 DOM
-
2026-06-07days on market $190,000 Active 6 DOM
-
2026-06-03days on market $190,000 Active 2 DOM
-
2026-06-01remarks 501-char remark
-
2026-06-01$190,000 Active 1 DOM
ⓘ Source: listings_history table (triggers on properties + properties_extension) + one-shot
backfill from property_details.listing_events for pre-trigger history.
Tax reassessment forecast LA · Resets to sale price
- Current annual tax
- $642 · $54/mo
- Projected year-2 tax
- $1,045 · $87/mo
- Expected delta
- +$403/yr (+$34/mo · 62.7%)
ⓘ Screening estimate from a state-policy table — verify with the county assessor before closing.
Climate risk First Street
- Flood 6/10 Major FEMA zone X (unshaded) · 71% chance over 30 yrs
- Wildfire 5/10 Major
- Heat 8/10 Severe 7 d/yr ≥109°F today · 21 d/yr by 30 yrs out
- Wind 9/10 Extreme 99% chance of damaging wind over 30 yrs
- Air quality 2/10 Low 0 unhealthy d/yr today · 1 by 30 yrs out
Nearby sold comps map
Loading sold comps map…
Walkable amenities ~0.75 mi
Loading nearby amenities…
Taxation est. · year 1
- Rental income
- $17,951
- − Mortgage interest
- −$10,643
- − Property taxes
- −$642
- − Insurance
- −$950
- − Repairs & maintenance
- −$1,436
- − Management
- −$1,436
- − Depreciation
- −$5,527
- Taxable loss
- −$2,684
- Est. tax savings @ 24.0%
- +$644
- After-tax cash flow
- $1,276/yr
For passive investors: Depreciation is non-cash, so a rental often shows a tax loss while cash-flowing — sheltering income. Rental losses are passive: they offset passive income freely, and up to $25,000/yr can offset ordinary (W-2) income if you actively participate and your MAGI is under $100k (phasing out to $0 by $150k); unused losses carry forward. On sale, claimed depreciation is recaptured at up to 25%, and gains may owe capital-gains tax (a 1031 exchange can defer both). Figures are a year-1 estimate at your 24.0% rate — not tax advice; consult a CPA.
Schools (NCES district)
- District
- Livingston Parish
- NCES district ID
- 2201020
- Math proficiency
- 40% ▼ -38.00%
- Reading proficiency
- 52% ▼ -32.00%
- Median HH income
- $56,755
- Composite
- 40.07/100
- National rank
- #3811
- State rank
- #13 of 98 in LA
Livability — Albany
- Score
- 77/100
- State rank
- #12
- US rank
- #3099
Category grades
Schools grade is shown separately in the Schools card above.
Census & demographics
- Population (ZIP)
- 5,857
Population outlook (Livingston County) Hauer SSP2
- Today (2025)
- 158,511 people
- By 2030
- 168,241 · +6.1%
- By 2040
- 186,252 · +17.5%
- By 2050
- 201,516 · +27.1%
- By 2075
- 231,217 · +45.9%
- By 2100
- 241,697 · +52.5%
Race, ethnicity, and origin ACS 2023
- Neighborhood character
- Predominantly White (91%)
- Race & ethnicity
- White 91% Hispanic / Latino 4% Two or more races 4% Black 2%
- Common ancestry
- Lithuanian 9% Slovak 1%
- Foreign-born
- 1% · Canada
- Languages at home
- 99% English-only · Spanish 1%
Political lean MEDSL · Livingston
- 2024 margin
- Solid R (+68.5) · D 15.1% · R 83.6% · Other 1.3%
- 2008→2024 swing
- +3.4pp toward D · 2008: -71.9pp · 2024: -68.5pp
- All cycles
- 2024: R+68.5 2020: R+70.0 2016: R+72.5 2012: R+70.4 2008: R+71.9
Not yet ingested
- Civics
- —
Market trends
- HPI YoY
- ▼ -45.97%
- Current HPI
- 149.5343
- Rent YoY
- —
- Metro
- —
- State GDP YoY
- ▲ 3.29%
- F500 in state
- 10
Industry mix (Fortune 500 HQ in LA)
| Industry | F500 HQs | Revenue |
|---|---|---|
| Telecommunications | 2 | $23B |
|
||
| Utilities | 1 | $12B |
|
||
| Wholesale / Distribution | 1 | $5B |
|
||
| Advertising | 1 | $2B |
|
||
Price history
+217.2% since first listed36 events — show timeline
- 2026-06-01 Listed $190,000 GBRMLS
- 2022-06-02 Sold (Public Records) $151,000 Public Records
- 2022-05-31 Sold (MLS) — GBRMLS
- 2022-04-29 Pending — GBRMLS
- 2022-04-26 Listed $140,000 AcadianaMLS
- 2022-04-26 Listed $140,000 GBRMLS
- 2018-06-22 Sold (MLS) — GSREIN
- 2018-06-22 Sold (MLS) — GBRMLS
- 2018-05-29 Pending — GBRMLS
- 2018-05-18 Contingent — GSREIN
- 2018-05-18 Pending — GSREIN
- 2018-05-17 Contingent — GSREIN
- 2018-05-07 Listed $59,900 AcadianaMLS
- 2018-05-07 Listed $59,900 AcadianaMLS
- 2018-05-07 Listed $59,900 GSREIN
- 2018-05-07 Listed $59,900 GBRMLS
- 2014-10-20 Sold (Public Records) $95,000 Public Records
- 2014-10-03 Sold (MLS) — GBRMLS
- 2013-10-08 Listed $99,900 AcadianaMLS
- 2013-10-08 Listed $99,900 GBRMLS
- 2010-09-09 Listed $115,000 GSREIN
- 2010-09-09 Listed $115,000 AcadianaMLS
- 2008-02-29 Sold (MLS) — GBRMLS
- 2008-01-29 Listed $105,000 GBRMLS
- 2008-01-29 Listed $105,000 AcadianaMLS
- 2003-11-12 Sold (MLS) — GSREIN
- 2003-09-11 Listed $52,500 GSREIN
- 2003-09-11 Listed $52,500 AcadianaMLS
- 2002-11-22 Sold (MLS) — GSREIN
- 2002-10-07 Listed $27,500 GSREIN
- 2002-10-07 Listed $27,500 AcadianaMLS
- 2002-08-05 Listed $27,500 AcadianaMLS
- 2002-08-05 Listed $27,500 GBRMLS
- 2002-03-11 Listed $41,895 AcadianaMLS
- 2002-03-11 Listed $41,895 GBRMLS
- 2000-09-12 Listed $59,900 AcadianaMLS
Property tax history
+1.4%/yrLatest (2024): $642 · +27.5% YoY. Source: county tax records.
Cash-flow waterfall
monthlySold comps — $/sqft
last 12 mo · ≤1 miLoading sold comps…