317 Potato Rd · Canaan, NH
Flood risk 1/10 · Minimal
- FEMA flood zone
- X (unshaded)
- Chance of flooding over 30 yrs
- 0.0%
- Est. flood insurance / yr
- $473 – $860
Fire risk 2/10 · Minimal
- Est. fire insurance / yr
- $507 – $941
Heat risk 1/10 · Minimal
- Hot days now (above 89°F)
- 7 days/yr
- Hot days in 30 yrs
- 16 days/yr
Wind risk 2/10 · Minimal
- Chance of severe wind over 30 yrs
- 4.0%
Air-quality risk 2/10 · Minimal
- Unhealthy air days now
- 1 days/yr
- Unhealthy air days in 30 yrs
- 1 days/yr
Risk factors via First Street. Map © Google.
Why this score? — see what drove the C- grade
The composite is a weighted blend of 9 inputs, each scored 0–100. Each bar is that input's sub-score; the figure is the points it added to the 100-point composite (weight × sub-score).
- Cash flow +13.9/30.0
- Appreciation +10.0/10.0
- ARV discount +7.5/15.0
- DSCR +4.2/10.0
- 1% rule +4.1/10.0
- Schools +3.8/10.0
- Rent growth +2.5/5.0
- Condition / age +2.5/5.0
- Livability +2.4/5.0
$325,000
🖨 Deal sheet (PDF) 📄 Offer letter ✓ Due diligence
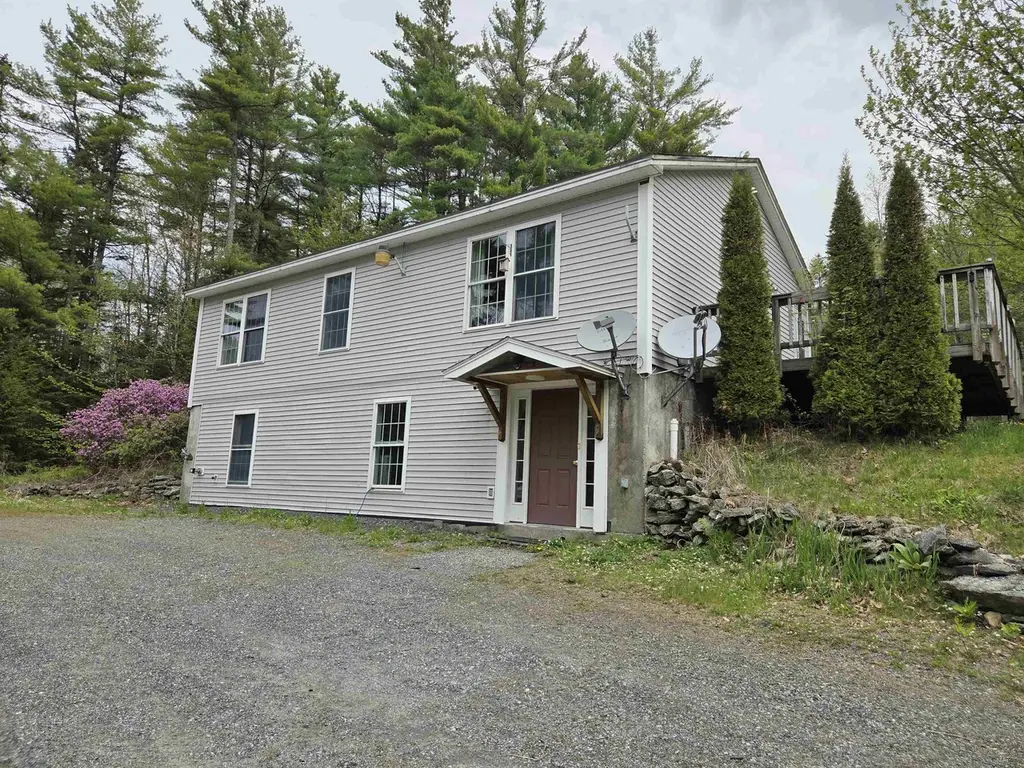
Listing remarks
Set on 10 private acres in a peaceful country setting, this 2002 raised ranch offers space, functionality, and opportunity. The property features a large, detached garage with a high-clearance overhead bay and automotive lift — ideal for car enthusiasts, hobbyists, or workshop use. Inside, the home includes 3 bedrooms, 1.5 baths, and a spacious lower-level family room with flexible living space. A side deck opens to the expansive backyard, perfect for entertaining, gardening, or enjoying the outdoors.
Key facts
- Private acres
- Side deck
- Automotive lift
Tags
Property features AI
Exterior
- Parking: Detached 2-car garage; Gravel driveway
- Utilities: Drilled well water; Private sewer; Circuit breaker electric service; High-speed internet available; Cable available
- Home design: Raised ranch; Modular structure; Existing construction; Shingle (asphalt) roof; Built in 2002
- Construction: Vinyl siding
- Exterior features: Country setting with wooded areas; Abuts conservation land; Surveyed property
Interior
- Kitchen: Kitchen/dining area (approx. 14'7" x 12'2"); Gas range; Microwave; Dishwasher; Refrigerator
- Bedrooms: Three first-floor bedrooms (approx. 12'2" x 12'3"; 12'2" x 8'8"; 12'2" x 11'10")
- Flooring: Laminate; Tile; Vinyl; Wood
- Bathrooms: One full bathroom; One half bathroom
- Heating & cooling: Propane hot water heating
- Interior features: Six total rooms; Family room in the basement; Concrete/crawl space/partial basement; partially finished and unfinished areas
- Laundry & utility: Washer; Dryer
Neighborhood map
What this means for you Summary
Snapshot
- This is a 3-bed/1.5-bath single-family listed at $325k.
Deal economics
- At list price, monthly cash flow is $33 ($398/yr) — positive.
- The deal already cash-flows at list — no discount required.
- To meet the 1% rule (rent ≥ 1% of price), the offer needs to be $297k (8.6% below list).
- Recommended offer: $297k (8.6% below list) — sets the bar for 1% rule.
- Cap rate 6.4% vs local median 2.7% in Canaan — top-decile yield for the area; either an underpriced asset or a hidden risk that comps aren't pricing in. Stress-test before assuming the spread holds.
Location & tenants
- Location reads 48/100 on livability (#95 in NH) — a working-class tenant base; expect higher turnover. Strengths: cost of living A+, crime A; Watch: health & safety D, amenities F, commute F.
- Mascoma Valley Reg School District (rural): math 36% / reading 50% proficiency, ranked #56 of 98 in NH (top 57%) — families likely to look elsewhere, expect single-tenant / working-renter base with shorter leases.
- Zoned schools: Enfield Village School (math 74% / reading 74%, grade A, #13 of 263 statewide, top 6%, 214 students, 22% FRL); Indian River School (math 27% / reading 46%, grade F, #53 of 96 statewide, top 56%, 313 students, 39% FRL); Mascoma Valley Regional High School (math 22% / reading 42%, grade F, #76 of 90 statewide, top 85%, 338 students, 29% FRL).
- Market conditions: 28 active listings in the ZIP; 487 units permitted in Grafton County in 2024 (127 in 5+ unit buildings).
Forward outlook
- In year one you build about $35k of equity ($2k loan paydown + $32k appreciation (10.0% local appreciation)).
- Grafton County population projected at -13% by 2050 — secular population decline; favor cash flow + early exit over multi-decade hold.
- At projected returns (10.0% appreciation + 3.0% rent growth), your $91k cash investment doubles in ~3 years — after that, you're playing with house money.
- By year 2, paydown + projected appreciation supports a ~$56k cash-out refi (75% LTV) — recoverable capital for the next deal without selling this one.
Negotiation context
- Only 5 days on market — expect competitive offers; lowballing is unlikely to land.
Questions for the listing agent
- Is there a deadline driving the sale (1031 exchange, divorce, estate, relocation)? That informs how much negotiation room exists.
- What's the average days-on-market for RENTAL listings here right now (not sales)? A rising rental-DOM trend means longer vacancies and softer asking-rent achievability than the comps imply.
- What's the recent tenant-quality profile in this submarket — average credit score on applications, eviction rate, late-payment / NSF rate, and stable-employment percentage? A property-management company in the area should have these aggregated.
- How much new for-sale + rental construction is in the pipeline within 1–3 miles? Heavy new supply typically softens prices + rents 12–24 months out; constrained supply supports both.
Investment metrics
- 1% rule
- 0.91% ✗
- Cap rate
- 6.42%
- Cash-on-cash
- 0.44%
- DSCR
- 1.02
- GRM
- 9.1
CMA / ARV
No comps found within radius.
Projected returns pro-forma
10.0% appreciation · 3.0% rent growth · sell at horizon
- IRR
- 24.6%
- Equity multiple
- 2.97×
- Total profit
- $179,204
- Equity at exit
- $292,786
- IRR
- 21.8%
- Equity multiple
- 6.78×
- Total profit
- $526,235
- Equity at exit
- $631,404
Cash invested: $91,000 (down + closing). Projections, not guarantees.
Landlord ↔ Tenant lean methodology
- Overall (STATE)
- 56 Moderately Landlord-Leaning
- State New Hampshire
- 56 Moderately Landlord-Leaning · D+1
- County
- — inherits STATE
- City
- — inherits STATE
ZIP-level market 03748
- Home prices YoY
- 15.4%
- Active inventory
- 28
- Price-to-rent
- 9.1×
Monthly cashflow live
- Estimated rent
- $2,971 medium interval (Pro) →
- Mortgage (P&I)
- −$1,704
- Tax from tax record
- −$474 /mo · $5,688/yr
- Insurance
- −$135
- HOA
- −$0
- Vacancy / Maint / Mgmt
- −$624
- Net cashflow
- $33
Break-even live
Sensitivity live
| Price | -10% $217 | -5% $125 | +0% $33 | +5% $-59 | +10% $-151 |
|---|---|---|---|---|---|
| Rent | -10% $-202 | -5% $-84 | +0% $33 | +5% $151 | +10% $268 |
| Rate | -1.0pp $197 | -0.5pp $116 | base $33 | +0.5pp $-51 | +1.0pp $-137 |
UW: 25.0% down · 7.5% · 30yr · 1.5% tax · 5.0% vac · 8.0% maint · 8.0% mgmt
Financing live
Cash to close
- Down payment
- $81,250
- Closing costs
- $9,750
- Reserves months
- —
- Total cash needed
- —
Loan-product check · same deal, 3 products live
Conventional
25% down · 7.5% · 30yr
- Down + closing
- —
- Monthly P&I
- —
- Monthly cashflow
- —
- DSCR
- —
- Eligible?
- —
Personal DTI + credit; lowest rate.
DSCR
20% down · 8.5% · 30yr
- Down + closing
- —
- Monthly P&I
- —
- Monthly cashflow
- —
- DSCR
- —
- Eligible?
- —
No personal income docs; deal must DSCR.
Hard money
10% down · 12.0% · 12mo
- Down + closing
- —
- Monthly P&I
- —
- Monthly cashflow
- —
- DSCR
- —
- Eligible?
- —
Short-term bridge; refi at stabilization.
Listing history 1 events
-
2026-05-19$325,000 Active
ⓘ Source: listings_history table (triggers on properties + properties_extension) + one-shot
backfill from property_details.listing_events for pre-trigger history.
Tax reassessment forecast NH · Partial reset (capped growth)
- Current annual tax
- $5,688 · $474/mo
- Projected year-2 tax
- $6,386 · $532/mo
- Expected delta
- +$698/yr (+$58/mo · 12.3%)
ⓘ Screening estimate from a state-policy table — verify with the county assessor before closing.
Climate risk First Street
- Flood 1/10 Low FEMA zone X (unshaded) · 0% chance over 30 yrs
- Wildfire 2/10 Low
- Heat 1/10 Low 7 d/yr ≥89°F today · 16 d/yr by 30 yrs out
- Wind 2/10 Low 4% chance of damaging wind over 30 yrs
- Air quality 2/10 Low 1 unhealthy d/yr today · 1 by 30 yrs out
Nearby sold comps map
Loading sold comps map…
Walkable amenities ~0.75 mi
Loading nearby amenities…
Taxation est. · year 1
- Rental income
- $35,650
- − Mortgage interest
- −$18,205
- − Property taxes
- −$5,688
- − Insurance
- −$1,625
- − Repairs & maintenance
- −$2,852
- − Management
- −$2,852
- − Depreciation
- −$9,455
- Taxable loss
- −$5,027
- Est. tax savings @ 24.0%
- +$1,206
- After-tax cash flow
- $1,605/yr
For passive investors: Depreciation is non-cash, so a rental often shows a tax loss while cash-flowing — sheltering income. Rental losses are passive: they offset passive income freely, and up to $25,000/yr can offset ordinary (W-2) income if you actively participate and your MAGI is under $100k (phasing out to $0 by $150k); unused losses carry forward. On sale, claimed depreciation is recaptured at up to 25%, and gains may owe capital-gains tax (a 1031 exchange can defer both). Figures are a year-1 estimate at your 24.0% rate — not tax advice; consult a CPA.
Schools (NCES district)
- District
- Mascoma Valley Reg School District
- NCES district ID
- 3304680
- Math proficiency
- 36% ▼ -5.00%
- Reading proficiency
- 50% ▬ 0.00%
- Median HH income
- $63,357
- Composite
- 38.2/100
- National rank
- #4256
- State rank
- #56 of 98 in NH
Livability — Canaan
- Score
- 48/100
- State rank
- #95
- US rank
- #26162
Category grades
Schools grade is shown separately in the Schools card above.
Census & demographics
- Population (ZIP)
- 4,568
Population outlook (Grafton County) Hauer SSP2
- Today (2025)
- 88,798 people
- By 2030
- 87,131 · -1.9%
- By 2040
- 82,000 · -7.7%
- By 2050
- 77,064 · -13.2%
- By 2075
- 68,769 · -22.6%
- By 2100
- 61,631 · -30.6%
Race, ethnicity, and origin ACS 2023
- Neighborhood character
- Predominantly White (96%)
- Race & ethnicity
- White 96% Two or more races 2% Black 1%
- Common ancestry
- Lithuanian 18% Slovak 8% Serbian 3%
- Foreign-born
- 3%
- Languages at home
- 97% English-only · Russian/Polish/Slavic 2% Other Indo-European 1%
Political lean MEDSL · Grafton
- 2024 margin
- D (+19.9) · D 59.4% · R 39.4% · Other 1.2%
- 2008→2024 swing
- -7.8pp toward R · 2008: 27.7pp · 2024: 19.9pp
- All cycles
- 2024: D+19.9 2020: D+24.6 2016: D+19.0 2012: D+23.8 2008: D+27.7
Not yet ingested
- Civics
- —
Market trends
- HPI YoY
- ▲ 56.61%
- Current HPI
- 424.8365
- Rent YoY
- —
- Metro
- —
- State GDP YoY
- —
- F500 in state
- 0
Price history
1 event — show timeline
- 2026-05-19 Listed $325,000 PrimeMLS
Property tax history
+1.9%/yrLatest (2025): $5,688 · +5.5% YoY. Source: county tax records.
Cash-flow waterfall
monthlySold comps — $/sqft
last 12 mo · ≤1 miLoading sold comps…