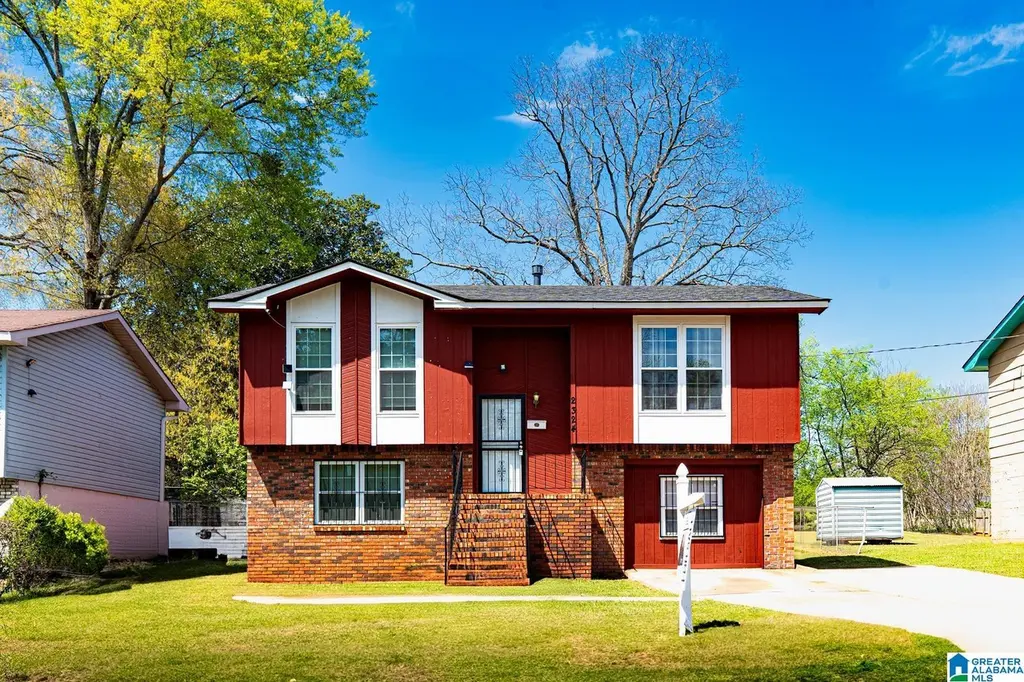
2324 Beulah Ave SW · Birmingham, AL
Flood risk 6/10 · Moderate
- FEMA flood zone
- X (unshaded)
- Chance of flooding over 30 yrs
- 0.7%
- Est. flood insurance / yr
- $473 – $860
Fire risk 2/10 · Minimal
- Est. fire insurance / yr
- $916 – $1,700
Heat risk 6/10 · Moderate
- Hot days now (above 106°F)
- 7 days/yr
- Hot days in 30 yrs
- 19 days/yr
Wind risk 6/10 · Moderate
- Chance of severe wind over 30 yrs
- 27.0%
Air-quality risk 4/10 · Minor
- Unhealthy air days now
- 5 days/yr
- Unhealthy air days in 30 yrs
- 5 days/yr
Risk factors via First Street. Map © Google.
Why this score? — see what drove the D+ grade
The composite is a weighted blend of 9 inputs, each scored 0–100. Each bar is that input's sub-score; the figure is the points it added to the 100-point composite (weight × sub-score).
- Cash flow +23.7/30.0
- DSCR +7.6/10.0
- 1% rule +5.0/10.0
- Livability +3.4/5.0
- Rent growth +2.5/5.0
- Condition / age +2.5/5.0
- Schools +0.9/10.0
- ARV discount +0.0/15.0
- Appreciation +0.0/10.0
$125,000
🖨 Deal sheet (PDF) 📄 Offer letter ✓ Due diligence
Listing remarks
Come see this beautifully updated home offering flexible living spaces and a layout perfect for multigenerational living, guests, or a growing family. 4 Bedrooms 2 Bathrooms Modern Kitchen with Island & Stainless-Steel Appliances Converted Garage Den 2 Bedrooms & 1 Bath Upstairs 2 Bedrooms & 1 Bath Downstairs The kitchen features sleek updates, an island ideal for meal prep or entertaining, and stainless-steel appliances that give the space a fresh, modern feel. The converted garage adds a cozy downstairs den perfect for movie nights, a playroom, or a private retreat. This home offers comfort, versatility, and room for everyone. Ready to take a tour and see it in person?
Key facts
- Converted garage
- Cozy downstairs den
- Modern kitchen
Tags
Neighborhood map
What this means for you Summary
Snapshot
- This is a 3-bed/2.0-bath single-family listed at $125k.
Deal economics
- At list price, monthly cash flow is $239 ($3k/yr) — positive.
- The deal already cash-flows at list — no discount required.
- Meets the 1% rule at list price ($1k rent vs $125k).
- Cap rate 8.6% vs local median 6.2% in Birmingham — top-decile yield for the area; either an underpriced asset or a hidden risk that comps aren't pricing in. Stress-test before assuming the spread holds.
Location & tenants
- Location reads 67/100 on livability (#78 in AL) — a middle-class / working-renter tenant base. Strengths: commute A+, cost of living A+, housing A+; Watch: amenities C-, crime F, employment F.
- Birmingham City (urban): math 4% / reading 20% proficiency, ranked #116 of 129 in AL (top 90%) — low school quality limits family demand, transient renter base, plan for 1-2y turnover; 82% free/reduced lunch — lower-income household profile, screen leases tightly.
- Zoned schools: West End Academy (math 2% / reading 12%, grade F, #601 of 627 statewide, top 98%, 503 students, 81% FRL); Wenonah High School (math 2% / reading 2%, grade F, #291 of 305 statewide, top 100%, 656 students, 85% FRL) — zoned schools at 83% FRL track the district average.
- Market conditions: Rents soft (-0.0%/yr); 154 active listings in the ZIP; 40 comparable units currently listed for rent nearby; rentals at typical pace (median 25d on market — plan ~3-4 weeks tenant-placement turnaround); 40% of comp listings sitting > 30 days — soft ceiling on asking rent; lower-income renter base — watch delinquency; 2,114 units permitted in Jefferson County in 2024 (556 in 5+ unit buildings).
- This rent runs 43% of the median local income ($35k/yr) — at the standard rent-burdened threshold; future hikes will face affordability resistance.
Forward outlook
- Local home prices are declining (-3.0%/yr); year-one equity from $864 of loan paydown is wiped out by about $4k of value loss. Plan a longer hold.
- Jefferson County population projected to shrink 4% by 2050 — rents likely to lag national; underwrite the cash flow, not the appreciation.
Negotiation context
- Only 5 days on market — expect competitive offers; lowballing is unlikely to land.
- Current owner paid $74k; list at $125k implies a 69% gain — meaningful room to come down on a strong offer.
Risks & watch-outs
- Climate carrying-cost: major flood risk; major wind risk, 27% chance of damaging wind over 30y; extreme-heat days projected 7→19/yr by 2055 (HVAC capex compounding) — expect insurance premiums to compound above CPI over the hold.
Questions for the listing agent
- Is there a deadline driving the sale (1031 exchange, divorce, estate, relocation)? That informs how much negotiation room exists.
- Schools are F-rated, which usually means shorter tenancies and higher turnover. Who's the typical renter profile here, and what's been the actual vacancy rate?
- Crime grade is F in this area — have there been break-ins, vandalism, or insurance claims at this property in the last 3 years? What carrier currently insures it and at what premium?
- The area grade is low — what's the realistic commute time and amenity access for the typical tenant pool here? Any planned neighborhood developments (good or bad) we should know about?
- What's the average days-on-market for RENTAL listings here right now (not sales)? A rising rental-DOM trend means longer vacancies and softer asking-rent achievability than the comps imply.
- What's the recent tenant-quality profile in this submarket — average credit score on applications, eviction rate, late-payment / NSF rate, and stable-employment percentage? A property-management company in the area should have these aggregated.
- How much new for-sale + rental construction is in the pipeline within 1–3 miles? Heavy new supply typically softens prices + rents 12–24 months out; constrained supply supports both.
Investment metrics
- 1% rule
- 1.00% ✓
- Cap rate
- 8.58%
- Cash-on-cash
- 8.18%
- DSCR
- 1.36
- GRM
- 8.3
CMA / ARV
- ARV (on-the-fly)
- $89,149
- Comps found
- 12
Show comp detail 12 sales within ~0.75 mi
| Address | Dist | Beds/Ba | Sqft | Sold | Price | $/sf | Match |
|---|---|---|---|---|---|---|---|
| 2312 Beulah Ave SW | 0.03mi | 3/2.0 | 1,488 (-2%) | 1mo | $88,400 | $59 | 95 |
| 820 28th St SW | 0.32mi | 3/1.5 | 1,440 (-5%) | 4mo | $170,000 | $118 | 71 |
| 829 28th St SW | 0.30mi | 3/1.0 | 1,380 (-9%) | 2mo | $86,000 | $62 | 65 |
| 915 19th Pl SW | 0.38mi | 4/1.0 (+1) | 1,434 (-5%) | 2mo | $20,000 | $14 | 63 |
| 724 18th Pl SW | 0.61mi | 4/2.0 (+1) | 1,508 (-0%) | 4mo | $48,900 | $32 | 62 |
| 2800 Steiner Ave SW | 0.47mi | 3/2.0 | 1,340 (-11%) | 2mo | $135,000 | $101 | 58 |
| 1216 18th Way SW | 0.35mi | 2/3.0 (-1) | 1,654 (+10%) | 2mo | $65,500 | $40 | 57 |
| 1236 18th St SW | 0.48mi | 3/2.0 | 1,328 (-12%) | 3mo | $107,250 | $81 | 55 |
| 3213 Lee Ave SW | 0.70mi | 3/2.0 | 1,653 (+9%) | 2mo | $60,000 | $36 | 50 |
| 1236 Mims St SW | 0.55mi | 4/2.0 (+1) | 1,695 (+12%) | 1mo | $168,000 | $99 | 48 |
| 2729 Powderly Ave SW | 0.62mi | 3/1.0 | 1,724 (+14%) | 0mo | $35,000 | $20 | 43 |
| 914 18th Way | 0.45mi | 2/1.0 (-1) | 1,730 (+14%) | 4mo | $45,000 | $26 | 42 |
Match score weights: distance 35% · size 25% · config 20% · recency 20%. Top-matched comps best support the ARV.
Projected returns pro-forma
-3.0% appreciation · 0.0% rent growth · sell at horizon
- IRR
- -7.0%
- Equity multiple
- 0.75×
- Total profit
- $-8,789
- Equity at exit
- $18,638
- IRR
- -1.2%
- Equity multiple
- 0.93×
- Total profit
- $-2,510
- Equity at exit
- $10,808
Cash invested: $35,000 (down + closing). Projections, not guarantees.
Landlord ↔ Tenant lean methodology
- Overall (STATE)
- 90 Strongly Landlord-Friendly
- State Alabama
- 90 Strongly Landlord-Friendly · R+15
- County
- — inherits STATE
- City
- — inherits STATE
ZIP-level market 35211
- Rents YoY
- -0.0%
- Active inventory
- 154
- Price-to-rent
- 8.3×
Monthly cashflow live
- Estimated rent
- $1,256 high interval (Pro) →
- Mortgage (P&I)
- −$656
- Tax from tax record
- −$46 /mo · $553/yr
- Insurance
- −$52
- HOA
- −$0
- Vacancy / Maint / Mgmt
- −$264
- Net cashflow
- $239
Break-even live
Sensitivity live
| Price | -10% $309 | -5% $274 | +0% $239 | +5% $203 | +10% $168 |
|---|---|---|---|---|---|
| Rent | -10% $139 | -5% $189 | +0% $239 | +5% $288 | +10% $338 |
| Rate | -1.0pp $302 | -0.5pp $270 | base $239 | +0.5pp $206 | +1.0pp $173 |
UW: 25.0% down · 7.5% · 30yr · 1.5% tax · 5.0% vac · 8.0% maint · 8.0% mgmt
Financing live
Cash to close
- Down payment
- $31,250
- Closing costs
- $3,750
- Reserves months
- —
- Total cash needed
- —
Loan-product check · same deal, 3 products live
Conventional
25% down · 7.5% · 30yr
- Down + closing
- —
- Monthly P&I
- —
- Monthly cashflow
- —
- DSCR
- —
- Eligible?
- —
Personal DTI + credit; lowest rate.
DSCR
20% down · 8.5% · 30yr
- Down + closing
- —
- Monthly P&I
- —
- Monthly cashflow
- —
- DSCR
- —
- Eligible?
- —
No personal income docs; deal must DSCR.
Hard money
10% down · 12.0% · 12mo
- Down + closing
- —
- Monthly P&I
- —
- Monthly cashflow
- —
- DSCR
- —
- Eligible?
- —
Short-term bridge; refi at stabilization.
Rent comps 40 comps
| Address | Beds | Baths | Sqft | Rent | $/sqft | DOM | Units | Dist |
|---|---|---|---|---|---|---|---|---|
| 2304 Beulah Ave SW Birmingham, AL | 3.0 | 1.0 | 1283 | $1,025 | $0.80 | 3d | 1 | 0.06mi |
| 2320 Wesley Ave SW Birmingham, AL | 4.0 | 1.0 | 1865 | $1,200 | $0.64 | 11d | 1 | 0.07mi |
| 407 S Park Rd SW Birmingham, AL | 3.0 | 1.0 | 1050 | $900 | $0.86 | 45d | 1 | 0.28mi |
| 1209 19th Pl SW Birmingham, AL | 3.0 | 1.0 | 1050 | $1,275 | $1.21 | 45d | 1 | 0.28mi |
| 805 29th St SW Birmingham, AL | 4.0 | 2.0 | 1510 | $1,300 | $0.86 | 11d | 1 | 0.36mi |
| 805 29th St SW Birmingham, AL | 4.0 | 2.0 | 1510 | $1,300 | $0.86 | 4d | 1 | 0.36mi |
| 709 30th St SW Birmingham, AL | 3.0 | 1.0 | 1273 | $1,000 | $0.79 | 45d | 1 | 0.39mi |
| 312 25th St SW Birmingham, AL | 4.0 | 1.0 | 1159 | $1,000 | $0.86 | 25d | 1 | 0.40mi |
| 1319 18th Way SW Birmingham, AL | 4.0 | 2.0 | 1337 | $1,345 | $1.01 | 25d | 1 | 0.41mi |
| 2128 Mayfield Ave SW Birmingham, AL | 3.0 | 1.0 | 1196 | $1,200 | $1.00 | 25d | 1 | 0.51mi |
| 2026 Lee Ct SW Birmingham, AL | 3.0 | 1.0 | 1204 | $1,100 | $0.91 | 45d | 1 | 0.54mi |
| 1501 21st St SW Birmingham, AL | 3.0 | 2.0 | 1758 | $1,250 | $0.71 | 45d | 1 | 0.55mi |
| 2516 Powderly Ave SW Birmingham, AL | 3.0 | 1.0 | 1236 | $1,050 | $0.85 | 45d | 1 | 0.57mi |
| 2709 Powderly Ave SW Birmingham, AL | 3.0 | 2.0 | 1056 | $950 | $0.90 | 25d | 1 | 0.61mi |
| 1669 19th Pl SW Birmingham, AL | 4.0 | 2.0 | 1373 | $1,325 | $0.97 | 25d | 1 | 0.63mi |
| 3116 Steiner Ave SW Birmingham, AL | 3.0 | 1.0 | 1362 | $1,200 | $0.88 | 45d | 1 | 0.64mi |
| 1633 29th St SW Birmingham, AL | 3.0 | 2.0 | 1658 | $1,200 | $0.72 | 45d | 1 | 0.67mi |
| 1781 51st Street Ensley Unit ENSLEY Birmingham, AL | 3.0 | 1.5 | 1069 | $950 | $0.89 | 45d | 1 | 0.69mi |
| 5320 Ter Q Unit Q Birmingham, AL | 3.0 | 2.0 | 1116 | $1,250 | $1.12 | 45d | 1 | 0.71mi |
| 2005 Snavely Ave SW Birmingham, AL | 3.0 | 2.0 | 1380 | $1,150 | $0.83 | 45d | 1 | 0.77mi |
| 5219 Court Q Birmingham, AL | 3.0 | 2.0 | 1082 | $1,200 | $1.11 | 20d | 1 | 0.77mi |
| 4817 Court R Birmingham, AL | 3.0 | 2.0 | 1530 | $1,300 | $0.85 | 17d | 1 | 0.81mi |
| 2005 Dawson Ave SW Birmingham, AL | 4.0 | 1.0 | 1508 | $1,250 | $0.83 | 20d | 1 | 0.82mi |
| 1000 17th Pl SW Birmingham, AL | 3.0 | 2.0 | 1200 | $1,275 | $1.06 | 20d | 1 | 0.83mi |
| 4825 Avenue S Birmingham, AL | 3.0 | 1.0 | 1310 | $1,050 | $0.80 | 17d | 1 | 0.83mi |
| 1900 Saint Charles Ave SW Birmingham, AL | 4.0 | 2.0 | 1623 | $1,350 | $0.83 | 3d | 1 | 0.84mi |
| 1933 Saint Charles Ct SW Birmingham, AL | 3.0 | 1.0 | 1106 | $1,050 | $0.95 | 25d | 1 | 0.85mi |
| 1734 Lee Ave SW Birmingham, AL | 4.0 | 1.0 | 1142 | $1,150 | $1.01 | 20d | 1 | 0.86mi |
| 1757 48th Street Ensley Unit ENSLEY Birmingham, AL | 4.0 | 2.0 | 1164 | $1,295 | $1.11 | 4d | 1 | 0.86mi |
| 3000 Dawson Ave SW Birmingham, AL | 3.0 | 1.0 | 1092 | $925 | $0.85 | 45d | 1 | 0.87mi |
| 4813 Court S Birmingham, AL | 3.0 | 2.0 | 1118 | $1,125 | $1.01 | 45d | 1 | 0.88mi |
| 4801 Avenue S Birmingham, AL | 3.0 | 1.0 | 1310 | $1,000 | $0.76 | 45d | 1 | 0.88mi |
| 1728 Princeton Ave SW Birmingham, AL | 4.0 | 2.0 | 1334 | $1,300 | $0.97 | 45d | 1 | 0.89mi |
| 5713 Avenue P Unit P Birmingham, AL | 3.0 | 1.0 | 1300 | $1,100 | $0.85 | 20d | 1 | 0.90mi |
| 1838 31st St SW Birmingham, AL | 3.0 | 2.0 | 1400 | $1,223 | $0.87 | 17d | 1 | 0.91mi |
| 1816 Saint Charles Ave SW Birmingham, AL | 3.0 | 1.0 | 1395 | $1,295 | $0.93 | 25d | 1 | 0.91mi |
| 4736 Court S Birmingham, AL | 3.0 | 1.5 | 1300 | $1,200 | $0.92 | 4d | 1 | 0.93mi |
| 1632 51st Street Ensley Unit ENSLEY Birmingham, AL | 3.0 | 1.0 | 1337 | $1,100 | $0.82 | 45d | 1 | 0.93mi |
| 108 E Ann Dr SW Birmingham, AL | 4.0 | 2.0 | 1628 | $1,495 | $0.92 | 25d | 1 | 0.93mi |
| 1632 51st St W Birmingham, AL | 3.0 | 1.0 | 1337 | $1,000 | $0.75 | 3d | 1 | 0.93mi |
Listing history 5 events
-
2026-03-30status Pending
-
2026-03-24$125,000 Active
-
2004-03-02soldstatus $74,000
-
1998-03-09soldstatus $57,500
-
1984-07-17soldstatus $50,000
ⓘ Source: listings_history table (triggers on properties + properties_extension) + one-shot
backfill from property_details.listing_events for pre-trigger history.
Tax reassessment forecast AL · Resets to sale price
- Current annual tax
- $553 · $46/mo
- Projected year-2 tax
- $553 · $46/mo
- Expected delta
- $0/yr ($0/mo · 0.0%)
ⓘ Screening estimate from a state-policy table — verify with the county assessor before closing.
Climate risk First Street
- Flood 6/10 Major FEMA zone X (unshaded) · 70% chance over 30 yrs
- Wildfire 2/10 Low
- Heat 6/10 Major 7 d/yr ≥106°F today · 19 d/yr by 30 yrs out
- Wind 6/10 Major 27% chance of damaging wind over 30 yrs
- Air quality 4/10 Moderate 5 unhealthy d/yr today · 5 by 30 yrs out
Nearby sold comps map
Loading sold comps map…
Walkable amenities ~0.75 mi
Loading nearby amenities…
Taxation est. · year 1
- Rental income
- $15,073
- − Mortgage interest
- −$7,002
- − Property taxes
- −$553
- − Insurance
- −$625
- − Repairs & maintenance
- −$1,206
- − Management
- −$1,206
- − Depreciation
- −$3,636
- Taxable income
- $845
- Est. tax owed @ 24.0%
- −$203
- After-tax cash flow
- $2,660/yr
For passive investors: Depreciation is non-cash, so a rental often shows a tax loss while cash-flowing — sheltering income. Rental losses are passive: they offset passive income freely, and up to $25,000/yr can offset ordinary (W-2) income if you actively participate and your MAGI is under $100k (phasing out to $0 by $150k); unused losses carry forward. On sale, claimed depreciation is recaptured at up to 25%, and gains may owe capital-gains tax (a 1031 exchange can defer both). Figures are a year-1 estimate at your 24.0% rate — not tax advice; consult a CPA.
Schools (NCES district)
- District
- Birmingham City
- NCES district ID
- 0100390
- Math proficiency
- 4% ▼ -17.00%
- Reading proficiency
- 20% ▼ -4.00%
- Median HH income
- $31,988
- Composite
- 9.49/100
- National rank
- #9850
- State rank
- #116 of 129 in AL
Livability — Birmingham
- Score
- 67/100
- State rank
- #78
- US rank
- #10412
Category grades
Schools grade is shown separately in the Schools card above.
Census & demographics
- Census place
- Birmingham, AL
- County
- Jefferson County · 527,445 people
- City population
- 210,422
- Metro
- Birmingham-Hoover, AL
- Population (ZIP)
- 24,924
- Household income
- $34,884
- Rent vs Own
- Severe rent burden
- 2161.0
Population outlook (Jefferson County) Hauer SSP2
- Today (2025)
- 669,185 people
- By 2030
- 669,694 · +0.1%
- By 2040
- 661,388 · -1.2%
- By 2050
- 643,086 · -3.9%
- By 2075
- 577,267 · -13.7%
- By 2100
- 474,758 · -29.1%
Race, ethnicity, and origin ACS 2023
- Neighborhood character
- Predominantly Black (77%)
- Race & ethnicity
- Black 77% White 10% Hispanic / Latino 10% Two or more races 4%
- Hispanic origin (detail)
- Mexican 7%
- Foreign-born
- 6% · Canada
- Languages at home
- 91% English-only · Spanish 8% French/Haitian/Cajun 1%
Political lean MEDSL · Jefferson
- 2024 margin
- D (+10.4) · D 54.6% · R 44.2% · Other 1.2%
- 2008→2024 swing
- +5.4pp toward D · 2008: 5.1pp · 2024: 10.4pp
- All cycles
- 2024: D+10.4 2020: D+13.2 2016: D+7.2 2012: D+6.0 2008: D+5.1
Not yet ingested
- Civics
- —
Market trends
- HPI YoY
- ▼ -49.29%
- Current HPI
- 91.2903
- Rent YoY
- ▬ -0.01%
- Metro
- Birmingham-Hoover, AL
- State GDP YoY
- ▲ 2.94%
- F500 in state
- 4
Industry mix (Fortune 500 HQ in AL)
| Industry | F500 HQs | Revenue |
|---|---|---|
| Financial Services | 1 | $8B |
|
||
| Healthcare | 1 | $5B |
|
||
Price history
+150.0% since first listed5 events — show timeline
- 2026-03-30 Pending — Greater Alabama MLS
- 2026-03-24 Listed $125,000 Greater Alabama MLS
- 2004-03-02 Sold (Public Records) $74,000 Public Records
- 1998-03-09 Sold (Public Records) $57,500 Public Records
- 1984-07-17 Sold (Public Records) $50,000 Public Records
Property tax history
+0.4%/yrLatest (2025): $553 · +0.0% YoY. Source: county tax records.
Cash-flow waterfall
monthlySold comps — $/sqft
last 12 mo · ≤1 miLoading sold comps…