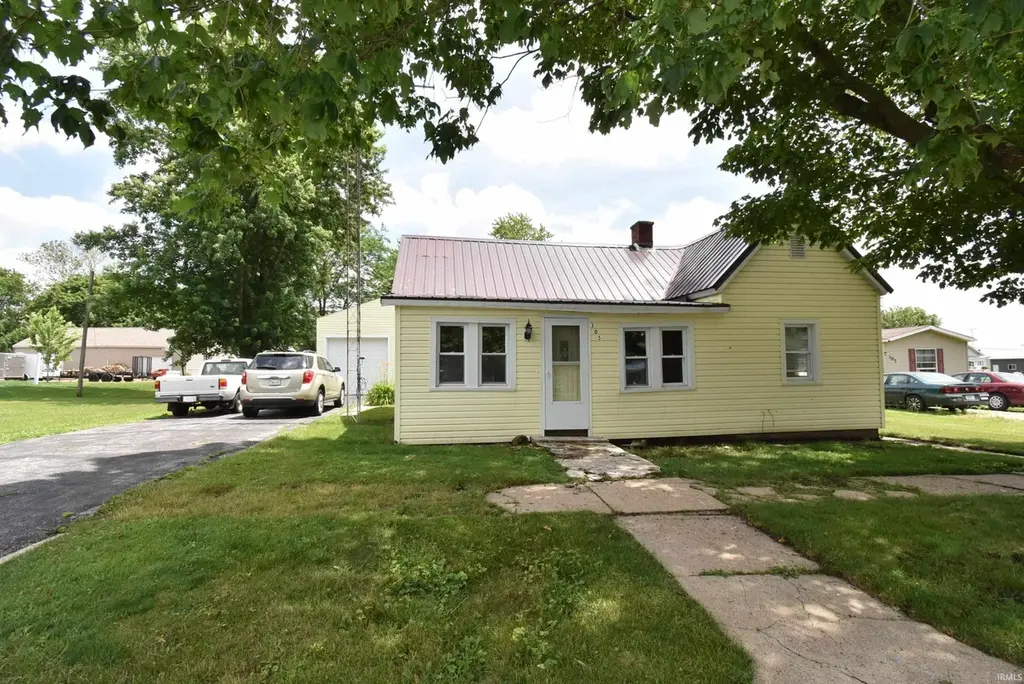
305 S Chestnut St · Earl Park, IN
Flood risk 1/10 · Minimal
- FEMA flood zone
- X (unshaded)
- Chance of flooding over 30 yrs
- 0.0%
- Est. flood insurance / yr
- $507 – $1,088
Fire risk 1/10 · Minimal
- Est. fire insurance / yr
- $717 – $1,331
Heat risk 3/10 · Minor
- Hot days now (above 103°F)
- 7 days/yr
- Hot days in 30 yrs
- 17 days/yr
Wind risk 2/10 · Minimal
- Chance of severe wind over 30 yrs
- 1.0%
Air-quality risk 2/10 · Minimal
- Unhealthy air days now
- 1 days/yr
- Unhealthy air days in 30 yrs
- 2 days/yr
Risk factors via First Street. Map © Google.
Why this score? — see what drove the B- grade
The composite is a weighted blend of 9 inputs, each scored 0–100. Each bar is that input's sub-score; the figure is the points it added to the 100-point composite (weight × sub-score).
- Cash flow +24.7/30.0
- ARV discount +15.0/15.0
- DSCR +8.0/10.0
- 1% rule +5.3/10.0
- Schools +3.5/10.0
- Livability +3.2/5.0
- Appreciation +2.8/10.0
- Rent growth +2.5/5.0
- Condition / age +2.5/5.0
$75,000
🖨 Deal sheet 📄 Offer letter ✓ Due diligence
Listing remarks
We've got a really great property for you that's ready for new owners! Located in the wonderful community of Earl Park with a great yard for all of your outdoor activities and an extra large building that can double as a garage and shop. The front porch is enclosed with windows all around for a great shaded view of the front yard. There is an older concrete pad under a shade tree off the outbuilding for your barbeque or just to enjoy the outdoors. This home is selling As-Is.
Key facts
- Concrete pad
- Great yard
- Extra large building
Tags
Property features AI
Exterior
- Parking: Detached garage; Parking on asphalt and off-street spaces; 1 garage space
- Security: Smoke detector(s)
- Utilities: Public water; Septic sewer
- Home design: Single-family site-built home; One story
- Construction: Vinyl siding
- Exterior features: Level lot; Lot dimensions approximately 88 x 176; No fencing; Metal roof
Interior
- Kitchen: Refrigerator; Gas range
- Bedrooms: Total of 5 rooms (bedroom breakdown not specified)
- Flooring: Carpet; Tile; Vinyl
- Bathrooms: One full bathroom (main level)
- Heating & cooling: Propane heating; Ceiling fan(s); No central air indicated
- Interior features: Ceiling fans; Laminate countertops; One fireplace (no usable fireplace features indicated)
- Laundry & utility: Washer and dryer included; Main level laundry; Gas water heater
Neighborhood map
What this means for you Summary
Snapshot
- This is a 2-bed/1.0-bath single-family listed at $75k.
Deal economics
- At list price, monthly cash flow is $157 ($2k/yr) — positive.
- The deal already cash-flows at list — no discount required.
- Meets the 1% rule at list price ($775 rent vs $75k).
Location & tenants
- Location reads 64/100 on livability (#392 in IN) — a middle-class / working-renter tenant base. Strengths: cost of living A+, housing A+; Watch: amenities F, commute F, health & safety F.
- Benton Community School Corporation (rural): math 38% / reading 43% proficiency, ranked #134 of 301 in IN (top 44%) — families likely to look elsewhere, expect single-tenant / working-renter base with shorter leases.
- Zoned schools: Prairie Crossing Elementary School (math 46% / reading 37%, grade F, #478 of 994 statewide, top 49%, 561 students, 65% FRL); Benton Central Jr-Sr High School (math 31% / reading 53%, grade F, #197 of 369 statewide, top 57%, 790 students, 48% FRL) — zoned schools average 57% FRL vs 38% district-wide (18 pts higher); higher-poverty schools than district average — tighter screening recommended.
- Market conditions: 32 active listings in the ZIP.
Forward outlook
- Local home prices are declining (-3.0%/yr); year-one equity from $519 of loan paydown is wiped out by about $2k of value loss. Plan a longer hold.
- Benton County population projected at -13% by 2050 — secular population decline; favor cash flow + early exit over multi-decade hold.
Negotiation context
- Only 7 days on market — expect competitive offers; lowballing is unlikely to land.
Risks & watch-outs
- Watch-outs: built in 1880 — expect roof / HVAC / electrical / plumbing capex.
Questions for the listing agent
- Built in 1880 — when were the roof, HVAC, electrical panel, plumbing, and water heater last replaced?
- Is there a deadline driving the sale (1031 exchange, divorce, estate, relocation)? That informs how much negotiation room exists.
- Schools are F-rated, which usually means shorter tenancies and higher turnover. Who's the typical renter profile here, and what's been the actual vacancy rate?
- What's the average days-on-market for RENTAL listings here right now (not sales)? A rising rental-DOM trend means longer vacancies and softer asking-rent achievability than the comps imply.
- What's the recent tenant-quality profile in this submarket — average credit score on applications, eviction rate, late-payment / NSF rate, and stable-employment percentage? A property-management company in the area should have these aggregated.
- How much new for-sale + rental construction is in the pipeline within 1–3 miles? Heavy new supply typically softens prices + rents 12–24 months out; constrained supply supports both.
Investment metrics
- 1% rule
- 1.03% ✓
- Cap rate
- 8.80%
- Cash-on-cash
- 8.94%
- DSCR
- 1.40
- GRM
- 8.1
CMA / ARV
- ARV (on-the-fly)
- $134,612
- Comps found
- 2
Show comp detail 2 sales within ~0.75 mi
| Address | Dist | Beds/Ba | Sqft | Sold | Price | $/sf | Match |
|---|---|---|---|---|---|---|---|
| 102 E 4th Street St | 0.21mi | 3/1.0 (+1) | 960 (+4%) | 8mo | $140,000 | $146 | 72 |
| 207 N Elm St | 0.38mi | 2/1.5 | 1,056 (+14%) | 21mo | $112,000 | $106 | 39 |
Match score weights: distance 35% · size 25% · config 20% · recency 20%. Top-matched comps best support the ARV.
Projected returns pro-forma
-3.0% appreciation · 3.0% rent growth · sell at horizon
- IRR
- -2.8%
- Equity multiple
- 0.89×
- Total profit
- $-2,211
- Equity at exit
- $11,183
- IRR
- 6.9%
- Equity multiple
- 1.51×
- Total profit
- $10,804
- Equity at exit
- $6,485
Cash invested: $21,000 (down + closing). Projections, not guarantees.
Landlord ↔ Tenant lean methodology
- Overall (STATE)
- 90 Strongly Landlord-Friendly
- State Indiana
- 90 Strongly Landlord-Friendly · R+11
- County
- — inherits STATE
- City
- — inherits STATE
ZIP-level market 47944
- Home prices YoY
- -1.3%
- Active inventory
- 32
- Price-to-rent
- 8.1×
Monthly cashflow live
- Estimated rent
- $775 medium interval (Pro) →
- Mortgage (P&I)
- −$393
- Tax from tax record
- −$31 /mo · $377/yr
- Insurance
- −$31
- HOA
- −$0
- Vacancy / Maint / Mgmt
- −$163
- Net cashflow
- $157
Break-even live
UW: 25.0% down · 7.5% · 30yr · 1.5% tax · 5.0% vac · 8.0% maint · 8.0% mgmt
Financing live
Cash to close
- Down payment
- $18,750
- Closing costs
- $2,250
- Reserves months
- —
- Total cash needed
- —
Loan-product check · same deal, 3 products live
Conventional
25% down · 7.5% · 30yr
- Down + closing
- —
- Monthly P&I
- —
- Monthly cashflow
- —
- DSCR
- —
- Eligible?
- —
Personal DTI + credit; lowest rate.
DSCR
20% down · 8.5% · 30yr
- Down + closing
- —
- Monthly P&I
- —
- Monthly cashflow
- —
- DSCR
- —
- Eligible?
- —
No personal income docs; deal must DSCR.
Hard money
10% down · 12.0% · 12mo
- Down + closing
- —
- Monthly P&I
- —
- Monthly cashflow
- —
- DSCR
- —
- Eligible?
- —
Short-term bridge; refi at stabilization.
Listing history 7 events
-
2026-06-19days on market $75,000 Active 7 DOM
-
2026-06-18days on market $75,000 Active 6 DOM
-
2026-06-17days on market $75,000 Active 5 DOM
-
2026-06-16days on market $75,000 Active 4 DOM
-
2026-06-15days on market $75,000 Active 3 DOM
-
2026-06-13remarks 480-char remark
-
2026-06-13$75,000 Active 1 DOM
ⓘ Source: listings_history table (triggers on properties + properties_extension) + one-shot
backfill from property_details.listing_events for pre-trigger history.
Tax reassessment forecast IN · Partial reset (capped growth)
- Current annual tax
- $377 · $31/mo
- Projected year-2 tax
- $507 · $42/mo
- Expected delta
- +$130/yr (+$11/mo · 34.5%)
ⓘ Screening estimate from a state-policy table — verify with the county assessor before closing.
Climate risk First Street
- Flood 1/10 Low FEMA zone X (unshaded) · 0% chance over 30 yrs
- Wildfire 1/10 Low
- Heat 3/10 Moderate 7 d/yr ≥103°F today · 17 d/yr by 30 yrs out
- Wind 2/10 Low 100% chance of damaging wind over 30 yrs
- Air quality 2/10 Low 1 unhealthy d/yr today · 2 by 30 yrs out
Nearby sold comps map
Loading sold comps map…
Walkable amenities ~0.75 mi
Loading nearby amenities…
Taxation est. · year 1
- Rental income
- $9,304
- − Mortgage interest
- −$4,201
- − Property taxes
- −$377
- − Insurance
- −$375
- − Repairs & maintenance
- −$744
- − Management
- −$744
- − Depreciation
- −$2,182
- Taxable income
- $680
- Est. tax owed @ 24.0%
- −$163
- After-tax cash flow
- $1,715/yr
For passive investors: Depreciation is non-cash, so a rental often shows a tax loss while cash-flowing — sheltering income. Rental losses are passive: they offset passive income freely, and up to $25,000/yr can offset ordinary (W-2) income if you actively participate and your MAGI is under $100k (phasing out to $0 by $150k); unused losses carry forward. On sale, claimed depreciation is recaptured at up to 25%, and gains may owe capital-gains tax (a 1031 exchange can defer both). Figures are a year-1 estimate at your 24.0% rate — not tax advice; consult a CPA.
Schools (NCES district)
- District
- Benton Community School Corporation
- NCES district ID
- 1800480
- Math proficiency
- 38% ▼ -7.00%
- Reading proficiency
- 43% ▼ -7.00%
- Median HH income
- $50,073
- Composite
- 34.9/100
- National rank
- #5076
- State rank
- #134 of 301 in IN
Livability — Earl Park
- Score
- 64/100
- State rank
- #392
- US rank
- #14495
Category grades
Schools grade is shown separately in the Schools card above.
Census & demographics
- Census place
- Earl Park, IN
- Population (ZIP)
- 3,492
Population outlook (Benton County) Hauer SSP2
- Today (2025)
- 8,404 people
- By 2030
- 8,234 · -2.0%
- By 2040
- 7,832 · -6.8%
- By 2050
- 7,337 · -12.7%
- By 2075
- 6,436 · -23.4%
- By 2100
- 5,139 · -38.9%
Race, ethnicity, and origin ACS 2023
- Neighborhood character
- Predominantly White (96%)
- Race & ethnicity
- White 96% Hispanic / Latino 3% Two or more races 3%
- Common ancestry
- Lithuanian 4% Iranian 2% Romanian 1%
- Foreign-born
- 0%
- Languages at home
- 98% English-only · Spanish 2%
Political lean MEDSL · Benton
- 2024 margin
- Solid R (+47.1) · D 25.5% · R 72.7% · Other 1.8%
- 2008→2024 swing
- -30.9pp toward R · 2008: -16.3pp · 2024: -47.1pp
- All cycles
- 2024: R+47.1 2020: R+48.6 2016: R+47.0 2012: R+32.7 2008: R+16.3
Not yet ingested
- Civics
- —
Market trends
- HPI YoY
- ▼ -4.35%
- Current HPI
- 325.4116
- Rent YoY
- —
- Metro
- —
- State GDP YoY
- ▲ 2.90%
- F500 in state
- 18
Industry mix (Fortune 500 HQ in IN)
| Industry | F500 HQs | Revenue |
|---|---|---|
| Industrial Machinery | 2 | $37B |
|
||
| Healthcare | 1 | $177B |
|
||
| Pharmaceuticals | 1 | $45B |
|
||
| Metals / Steel | 1 | $18B |
|
||
| Agriculture | 1 | $17B |
|
||
| Packaging | 1 | $12B |
|
||
Price history
1 event — show timeline
- 2026-06-10 Listed $75,000 IRMLS
Property tax history
+8.7%/yrLatest (2024): $377 · +5.9% YoY. Source: county tax records.
Cash-flow waterfall
monthlySold comps — $/sqft
last 12 mo · ≤1 miLoading sold comps…