11655 Mcswain Rd · Avery, MI
Flood risk 1/10 · Minimal
- FEMA flood zone
- —
- Chance of flooding over 30 yrs
- 0.0%
- Est. flood insurance / yr
- —
Fire risk 4/10 · Minor
- Est. fire insurance / yr
- $784 – $1,456
Heat risk 1/10 · Minimal
- Hot days now (above 94°F)
- 7 days/yr
- Hot days in 30 yrs
- 13 days/yr
Wind risk 1/10 · Minimal
- Chance of severe wind over 30 yrs
- —
Air-quality risk 1/10 · Minimal
- Unhealthy air days now
- 0 days/yr
- Unhealthy air days in 30 yrs
- 0 days/yr
Risk factors via First Street. Map © Google.
Why this score? — see what drove the C+ grade
The composite is a weighted blend of 9 inputs, each scored 0–100. Each bar is that input's sub-score; the figure is the points it added to the 100-point composite (weight × sub-score).
- Cash flow +21.6/30.0
- Appreciation +10.0/10.0
- ARV discount +7.5/15.0
- DSCR +6.9/10.0
- 1% rule +4.3/10.0
- Schools +2.8/10.0
- Rent growth +2.5/5.0
- Livability +2.5/5.0
- Condition / age +2.5/5.0
$129,900
🖨 Deal sheet (PDF) 📄 Offer letter ✓ Due diligence
Listing remarks
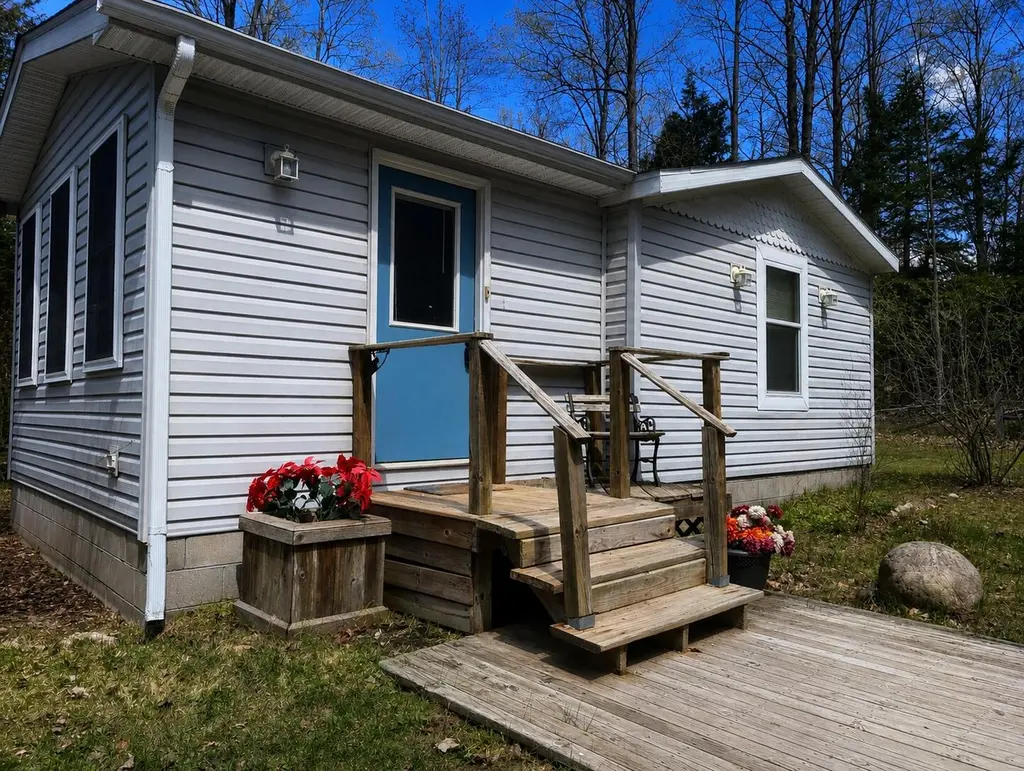
Located just outside Atlanta--known as the Elk Capital of Michigan--this 2-bedroom Redman manufactured home offers a wooded setting on a dirt road surrounded by natural beauty. Enjoy convenient access to ORV and snowmobile trails, along with nearby lakes, rivers, and thousands of acres of state land for hunting, fishing, and outdoor recreation. The property provides a great opportunity for a getaway, rental investment, or year-round living for those who appreciate the northern Michigan lifestyle. Whether you're looking for a basecamp for adventure or a place to relax after a day outdoors, this property delivers a true Up North experience.
Key facts
- Outdoor recreation
- Hunting
- Nearby rivers
Tags
Property features AI
Exterior
- Utilities: Well water; Septic tank
- Home design: Single-family home; Residential property
- Construction: Pillar/post/pier foundation
- Exterior features: Deck; Landscaped grounds; Natural vegetation
Interior
- Kitchen: Microwave
- Bedrooms: Master located downstairs
- Bathrooms: 2 full bathrooms
- Heating & cooling: Forced air heating (natural gas); Ceiling fans; Has cooling
- Interior features: Master suite on the main level; Blinds on windows; Therapeutic whirlpool; Accessible electrical and environmental controls
- Laundry & utility: Washer; Dryer; Laundry on the main level
Neighborhood map
What this means for you Summary
Snapshot
- This is a 2-bed/1.5-bath single-family listed at $130k.
Deal economics
- At list price, monthly cash flow is $198 ($2k/yr) — positive.
- The deal already cash-flows at list — no discount required.
- To meet the 1% rule (rent ≥ 1% of price), the offer needs to be $121k (6.9% below list).
- Recommended offer: $121k (6.9% below list) — sets the bar for 1% rule.
Location & tenants
- Location reads: area grade C — affects rentability + tenant quality, not the cash-flow math above.
- Atlanta Community Schools (rural): math 25% / reading 35% proficiency, ranked #546 of 760 in MI (top 72%) — families likely to look elsewhere, expect single-tenant / working-renter base with shorter leases.
- Market conditions: 59 active listings in the ZIP.
Forward outlook
- In year one you build about $14k of equity ($898 loan paydown + $13k appreciation (10.0% local appreciation)).
- Montmorency County population projected at -38% by 2050 — secular population decline; favor cash flow + early exit over multi-decade hold.
- At projected returns (10.0% appreciation + 3.0% rent growth), your $36k cash investment doubles in ~3 years — after that, you're playing with house money.
- By year 3, paydown + projected appreciation supports a ~$35k cash-out refi (75% LTV) — recoverable capital for the next deal without selling this one.
Negotiation context
- It's been on market 47 days — a 3% lower offer ($126k) is reasonable based on typical stale-listing flexibility.
Questions for the listing agent
- It's been on market 47 days. Have you received any prior offers? Is the seller open to a 7% concession, seller financing, or rate buy-down credit?
- Is there a deadline driving the sale (1031 exchange, divorce, estate, relocation)? That informs how much negotiation room exists.
- What's the average days-on-market for RENTAL listings here right now (not sales)? A rising rental-DOM trend means longer vacancies and softer asking-rent achievability than the comps imply.
- What's the recent tenant-quality profile in this submarket — average credit score on applications, eviction rate, late-payment / NSF rate, and stable-employment percentage? A property-management company in the area should have these aggregated.
- How much new for-sale + rental construction is in the pipeline within 1–3 miles? Heavy new supply typically softens prices + rents 12–24 months out; constrained supply supports both.
Investment metrics
- 1% rule
- 0.93% ✗
- Cap rate
- 8.12%
- Cash-on-cash
- 6.54%
- DSCR
- 1.29
- GRM
- 8.9
CMA / ARV
- ARV (median comp)
- $69,243
- List price
- $129,900
- Delta
- 87.60%
- Verdict
- OVERPRICED
- Comps
- 4 within 1.0 mi
Projected returns pro-forma
10.0% appreciation · 3.0% rent growth · sell at horizon
- IRR
- 29.0%
- Equity multiple
- 3.29×
- Total profit
- $83,305
- Equity at exit
- $117,024
- IRR
- 25.2%
- Equity multiple
- 7.47×
- Total profit
- $235,255
- Equity at exit
- $252,367
Cash invested: $36,372 (down + closing). Projections, not guarantees.
Landlord ↔ Tenant lean methodology
- Overall (STATE)
- 62 Landlord-Friendly
- State Michigan
- 62 Landlord-Friendly · EVEN
- County
- — inherits STATE
- City
- — inherits STATE
ZIP-level market 49709
- Home prices YoY
- 13.5%
- Active inventory
- 59
- Price-to-rent
- 8.9×
Monthly cashflow live
- Estimated rent
- $1,210 medium interval (Pro) →
- Mortgage (P&I)
- −$681
- Tax from tax record
- −$22 /mo · $266/yr
- Insurance
- −$54
- HOA
- −$0
- Vacancy / Maint / Mgmt
- −$254
- Net cashflow
- $198
Break-even live
Sensitivity live
| Price | -10% $272 | -5% $235 | +0% $198 | +5% $13 | +10% $-32 |
|---|---|---|---|---|---|
| Rent | -10% $103 | -5% $150 | +0% $198 | +5% $246 | +10% $294 |
| Rate | -1.0pp $264 | -0.5pp $231 | base $198 | +0.5pp $165 | +1.0pp $130 |
UW: 25.0% down · 7.5% · 30yr · 1.5% tax · 5.0% vac · 8.0% maint · 8.0% mgmt
Financing live
Cash to close
- Down payment
- $32,475
- Closing costs
- $3,897
- Reserves months
- —
- Total cash needed
- —
Loan-product check · same deal, 3 products live
Conventional
25% down · 7.5% · 30yr
- Down + closing
- —
- Monthly P&I
- —
- Monthly cashflow
- —
- DSCR
- —
- Eligible?
- —
Personal DTI + credit; lowest rate.
DSCR
20% down · 8.5% · 30yr
- Down + closing
- —
- Monthly P&I
- —
- Monthly cashflow
- —
- DSCR
- —
- Eligible?
- —
No personal income docs; deal must DSCR.
Hard money
10% down · 12.0% · 12mo
- Down + closing
- —
- Monthly P&I
- —
- Monthly cashflow
- —
- DSCR
- —
- Eligible?
- —
Short-term bridge; refi at stabilization.
Listing history 18 events
-
2026-06-21days on market $129,900 Active 47 DOM
-
2026-06-21days on market $129,900 Active 46 DOM
-
2026-06-18days on market $129,900 Active 44 DOM
-
2026-06-17days on market $129,900 Active 43 DOM
-
2026-06-16days on market $129,900 Active 42 DOM
-
2026-06-15days on market $129,900 Active 41 DOM
-
2026-06-13days on market $129,900 Active 39 DOM
-
2026-06-12days on market $129,900 Active 38 DOM
-
2026-06-09days on market $129,900 Active 35 DOM
-
2026-06-08days on market $129,900 Active 34 DOM
-
2026-06-07days on market $129,900 Active 33 DOM
-
2026-06-07days on market $129,900 Active 32 DOM
-
2026-06-04days on market $129,900 Active 29 DOM
-
2026-06-02days on market $129,900 Active 28 DOM
-
2026-06-01days on market $129,900 Active 27 DOM
-
2026-05-31days on market $129,900 Active 26 DOM
-
2026-05-31days on market $129,900 Active 25 DOM
-
2026-05-04$129,900 Active 646-char remark
ⓘ Source: listings_history table (triggers on properties + properties_extension) + one-shot
backfill from property_details.listing_events for pre-trigger history.
Tax reassessment forecast MI · Partial reset (capped growth)
- Current annual tax
- $266 · $22/mo
- Projected year-2 tax
- $1,133 · $94/mo
- Expected delta
- +$867/yr (+$72/mo · 325.9%)
ⓘ Screening estimate from a state-policy table — verify with the county assessor before closing.
Climate risk First Street
- Flood 1/10 Low 0% chance over 30 yrs
- Wildfire 4/10 Moderate
- Heat 1/10 Low 7 d/yr ≥94°F today · 13 d/yr by 30 yrs out
- Wind 1/10 Low
- Air quality 1/10 Low 0 unhealthy d/yr today · 0 by 30 yrs out
Nearby sold comps map
Loading sold comps map…
Walkable amenities ~0.75 mi
Loading nearby amenities…
Taxation est. · year 1
- Rental income
- $14,518
- − Mortgage interest
- −$7,276
- − Property taxes
- −$266
- − Insurance
- −$650
- − Repairs & maintenance
- −$1,161
- − Management
- −$1,161
- − Depreciation
- −$3,779
- Taxable income
- $224
- Est. tax owed @ 24.0%
- −$54
- After-tax cash flow
- $2,325/yr
For passive investors: Depreciation is non-cash, so a rental often shows a tax loss while cash-flowing — sheltering income. Rental losses are passive: they offset passive income freely, and up to $25,000/yr can offset ordinary (W-2) income if you actively participate and your MAGI is under $100k (phasing out to $0 by $150k); unused losses carry forward. On sale, claimed depreciation is recaptured at up to 25%, and gains may owe capital-gains tax (a 1031 exchange can defer both). Figures are a year-1 estimate at your 24.0% rate — not tax advice; consult a CPA.
Schools (NCES district)
- District
- Atlanta Community Schools
- NCES district ID
- 2603570
- Math proficiency
- 25% ▲ 5.00%
- Reading proficiency
- 35% ▲ 10.00%
- Median HH income
- $35,004
- Composite
- 27.59/100
- National rank
- #12347
- State rank
- #546 of 760 in MI
Livability — Avery
No livability data for this city. (Only ~50 U.S. cities are tracked.)
Census & demographics
- Population (ZIP)
- 3,524
Population outlook (Montmorency County) Hauer SSP2
- Today (2025)
- 8,233 people
- By 2030
- 7,575 · -8.0%
- By 2040
- 6,202 · -24.7%
- By 2050
- 5,081 · -38.3%
- By 2075
- 3,119 · -62.1%
- By 2100
- 1,923 · -76.6%
Race, ethnicity, and origin ACS 2023
- Neighborhood character
- Predominantly White (94%)
- Race & ethnicity
- White 94% Two or more races 4% Hispanic / Latino 2%
- Common ancestry
- Romanian 11% Lithuanian 7% Slovak 6%
- Foreign-born
- 1% · Canada
- Languages at home
- 98% English-only · Other Asian/Pacific 1% Spanish 1%
Political lean MEDSL · Montmorency
- 2024 margin
- Solid R (+45.3) · D 26.6% · R 72.0% · Other 1.4%
- 2008→2024 swing
- -37.2pp toward R · 2008: -8.2pp · 2024: -45.3pp
- All cycles
- 2024: R+45.3 2020: R+43.4 2016: R+44.2 2012: R+17.4 2008: R+8.2
Not yet ingested
- Civics
- —
Market trends
- HPI YoY
- ▲ 42.88%
- Current HPI
- 361.3052
- Rent YoY
- —
- Metro
- —
- State GDP YoY
- ▲ 1.37%
- F500 in state
- 28
Industry mix (Fortune 500 HQ in MI)
| Industry | F500 HQs | Revenue |
|---|---|---|
| Automotive Parts | 3 | $48B |
|
||
| Automotive | 2 | $372B |
|
||
| Chemicals | 1 | $45B |
|
||
| Automotive Retail | 1 | $29B |
|
||
| Healthcare / Medical Devices | 1 | $23B |
|
||
| Automotive Technology | 1 | $20B |
|
||
Price history
1 event — show timeline
- 2026-05-04 Listed $129,900 WWMLS
Property tax history
+2.1%/yrLatest (2024): $266 · -1.2% YoY. Source: county tax records.
Cash-flow waterfall
monthlySold comps — $/sqft
last 12 mo · ≤1 miLoading sold comps…