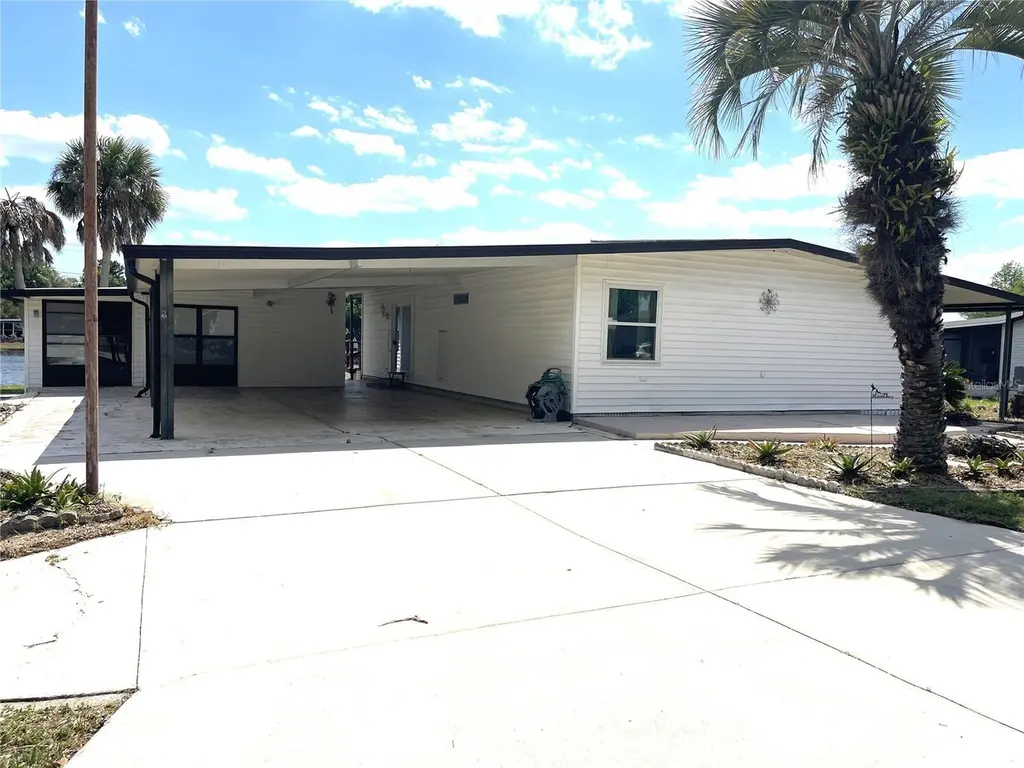
2 Grove Trl · Wildwood, FL
Flood risk 3/10 · Minor
- FEMA flood zone
- X (unshaded)
- Chance of flooding over 30 yrs
- 0.2%
- Est. flood insurance / yr
- $507 – $1,088
Fire risk 4/10 · Minor
- Est. fire insurance / yr
- $947 – $1,759
Heat risk 8/10 · Major
- Hot days now (above 108°F)
- 7 days/yr
- Hot days in 30 yrs
- 22 days/yr
Wind risk 9/10 · Severe
- Chance of severe wind over 30 yrs
- 99.0%
Air-quality risk 2/10 · Minimal
- Unhealthy air days now
- 1 days/yr
- Unhealthy air days in 30 yrs
- 2 days/yr
Risk factors via First Street. Map © Google.
Why this score? — see what drove the D- grade
The composite is a weighted blend of 9 inputs, each scored 0–100. Each bar is that input's sub-score; the figure is the points it added to the 100-point composite (weight × sub-score).
- Cash flow +10.5/30.0
- Schools +5.2/10.0
- 1% rule +4.4/10.0
- ARV discount +3.8/15.0
- Livability +3.5/5.0
- Rent growth +3.2/5.0
- DSCR +3.0/10.0
- Condition / age +2.5/5.0
- Appreciation +0.0/10.0
$177,500
🖨 Deal sheet (PDF) 📄 Offer letter ✓ Due diligence
Listing remarks
Golden Pond awaits you. Enjoy relaxing on large deck 8 x 26 over looking the pond, or utilize other areas of deck for picnics, fishing or sun bathing. Guest bedroom has sliding glass doors to screened porch (Florida room) 10 x 24. Home is complete with all new energy saving windows and replacement doors. A/C and duct work replaced in 2024, newly replaced hot water tank and refrigerator. Roof recently inspected, documentation can be provided. Extra large storage/workshop/laundry areas. Carport oversized with high roof, could fit boat or RV camper or maybe 4 cars. Relax and enjoy watching Florida wildlife in the spring feed pond with fountain. Continental Country Club is where you own your la
Key facts
- Large deck
- Hot water tank
- Replacement doors
Tags
Property features AI
Finance
- Other: Association name: Denise
- Financial info: Total annual fees listed: $4,337.04; Lease restrictions apply
- HOA & community: Has HOA (monthly fee required); Monthly HOA: $361.42; Association amenities include cable TV, clubhouse, fitness center, gated community, golf course access, handicap modified facilities, pickleball courts, pool, sauna, shuffleboard, spa/hot tub, storage, tennis courts, and trails; Association fee includes cable TV, internet, and maintenance of grounds; Association approval required; Community features: clubhouse, deed restrictions, dog park, fitness center, golf carts allowed, golf, handicap modified; Senior community; No pets allowed
Exterior
- Parking: Carport with 4 spaces
- Security: Gated community access (appointment required to enter)
- Utilities: Public water; Private sewer; Cable connected; Electricity connected; Sewer connected; Water connected
- Home design: Residential mobile home (double wide); One story; East-facing
- Construction: Vinyl siding; Metal roof; Crawlspace foundation; Built as double wide mobile home
- Exterior features: Lighting; Rain gutters; Sliding doors; Storage; Pond frontage and pond view; Water access to pond
Interior
- Kitchen: Range; Dishwasher; Refrigerator
- Bedrooms: 2 bedrooms
- Flooring: Carpet; Laminate
- Bathrooms: 2 full bathrooms
- Heating & cooling: Central heating (electric); Central air conditioning
- Interior features: Ceiling fans; High ceilings; Open floorplan; Walk-in closet(s); Window treatments
- Laundry & utility: Washer; Dryer; Electric water heater; Outside laundry
Neighborhood map
What this means for you Summary
Snapshot
- This is a 2-bed/2.0-bath manufactured listed at $178k.
Deal economics
- At list price, monthly cash flow is $-91 ($-1k/yr) — negative.
- To cash-flow at today's rent, offer at most $161k (9.0% below list).
- To meet the 1% rule (rent ≥ 1% of price), the offer needs to be $167k (6.1% below list).
- Recommended offer: $161k (9.0% below list) — sets the bar for cash-flow.
- Cap rate 5.7% vs local median 3.9% in Wildwood — top-decile yield for the area; either an underpriced asset or a hidden risk that comps aren't pricing in. Stress-test before assuming the spread holds.
Location & tenants
- Location reads 69/100 on livability (#471 in FL) — a middle-class / working-renter tenant base. Strengths: health & safety A+, cost of living A, crime A-; Watch: amenities F, commute F, employment D-.
- Sumter (rural): math 61% / reading 61% proficiency, ranked #11 of 73 in FL (top 15%) — acceptable for families but not a draw, mixed tenant base, ~2y average lease.
- Zoned schools: Wildwood Elementary School (math 49% / reading 52%, grade D+, #1,055 of 2,144 statewide, top 50%, 940 students, 76% FRL); South Sumter Middle School (math 55% / reading 54%, grade B-, #183 of 571 statewide, top 34%, 897 students, 61% FRL) — zoned schools average 68% FRL vs 51% district-wide (18 pts higher); higher-poverty schools than district average — tighter screening recommended.
- Market conditions: Rents rising (+2.9%/yr); 428 active listings in the ZIP; 3 comparable units currently listed for rent nearby; rentals at typical pace (median 23d on market — plan ~3-4 weeks tenant-placement turnaround); 3,961 units permitted in Sumter County in 2024 (248 in 5+ unit buildings).
- This rent runs 30% of the median local income ($66k/yr) — at the standard rent-burdened threshold; future hikes will face affordability resistance.
Forward outlook
- Local home prices are declining (-3.0%/yr); year-one equity from $1k of loan paydown is wiped out by about $5k of value loss. Plan a longer hold.
- Sumter County population projected at +45% by 2050 — long-run rental-demand tailwind backs the buy-and-hold thesis.
Negotiation context
- It's been on market 61 days — a 6% lower offer ($167k) is reasonable based on typical stale-listing flexibility.
- 2 sale attempts with the ask held roughly flat each time — persistent listings suggest the price (not the market) is what's stuck; bring a comps-based counter.
- Current owner paid $92k; list at $178k implies a 93% gain — meaningful room to come down on a strong offer.
Risks & watch-outs
- Watch-outs: HOA is 22% of rent.
- Climate carrying-cost: severe wind risk, 99% chance of damaging wind over 30y; extreme-heat days projected 7→22/yr by 2055 (HVAC capex compounding) — expect insurance premiums to compound above CPI over the hold.
Questions for the listing agent
- What do current leases actually rent for vs. the listed asking? Can we see a recent rent roll and the last 12 months of T-12 income?
- It's been on market 61 days. Have you received any prior offers? Is the seller open to a 9% concession, seller financing, or rate buy-down credit?
- What does the HOA fee cover, when was the last increase, and are there any pending special assessments or reserve-fund shortfalls?
- Why hasn't it sold? Are there any deal-killer items the seller is aware of (foundation, flood, title, zoning, code violations)?
- Is there a deadline driving the sale (1031 exchange, divorce, estate, relocation)? That informs how much negotiation room exists.
- The area grade is low — what's the realistic commute time and amenity access for the typical tenant pool here? Any planned neighborhood developments (good or bad) we should know about?
- What's the average days-on-market for RENTAL listings here right now (not sales)? A rising rental-DOM trend means longer vacancies and softer asking-rent achievability than the comps imply.
- What's the recent tenant-quality profile in this submarket — average credit score on applications, eviction rate, late-payment / NSF rate, and stable-employment percentage? A property-management company in the area should have these aggregated.
- How much new for-sale + rental construction is in the pipeline within 1–3 miles? Heavy new supply typically softens prices + rents 12–24 months out; constrained supply supports both.
Investment metrics
- 1% rule
- 0.94% ✗
- Cap rate
- 5.68%
- Cash-on-cash
- -2.19%
- DSCR
- 0.90
- GRM
- 8.9
CMA / ARV
- ARV (on-the-fly)
- $163,856
- Comps found
- 12
Show comp detail 12 sales within ~0.75 mi
| Address | Dist | Beds/Ba | Sqft | Sold | Price | $/sf | Match |
|---|---|---|---|---|---|---|---|
| 8 S Bobwhite | 0.29mi | 2/2.0 | 1,248 (+1%) | 2mo | $123,450 | $99 | 82 |
| 46 Seminole Path | 0.26mi | 2/2.0 | 1,248 (+1%) | 8mo | $171,000 | $137 | 79 |
| 14 Golfview Trl | 0.20mi | 2/2.0 | 1,152 (-6%) | 2mo | $140,000 | $122 | 78 |
| 11 S Bobwhite Rd | 0.31mi | 2/2.0 | 1,152 (-6%) | 1mo | $165,000 | $143 | 74 |
| 72 Seminole Path | 0.18mi | 2/2.0 | 1,144 (-7%) | 7mo | $70,000 | $61 | 74 |
| 17 Seminole Path | 0.38mi | 2/2.0 | 1,296 (+5%) | 0mo | $162,000 | $125 | 73 |
| 41 Seminole Path | 0.26mi | 2/2.0 | 1,152 (-6%) | 10mo | $49,000 | $43 | 69 |
| 108 Big Oak Ln | 0.37mi | 2/2.0 | 1,344 (+9%) | 3mo | $180,000 | $134 | 65 |
| 13 Seminole Path | 0.38mi | 2/2.0 | 1,352 (+10%) | 2mo | $175,000 | $129 | 64 |
| 178 Big Oak Ln | 0.14mi | 2/2.0 | 1,056 (-14%) | 8mo | $162,500 | $154 | 64 |
| 22 Big Oak Ln | 0.66mi | 2/2.0 | 1,144 (-7%) | 5mo | $152,000 | $133 | 53 |
| 110 Forest Blvd | 0.65mi | 2/2.0 | 1,056 (-14%) | 3mo | $220,000 | $208 | 44 |
Match score weights: distance 35% · size 25% · config 20% · recency 20%. Top-matched comps best support the ARV.
Projected returns pro-forma
-3.0% appreciation · 2.85% rent growth · sell at horizon
- IRR
- -20.0%
- Equity multiple
- 0.30×
- Total profit
- $-34,649
- Equity at exit
- $26,466
- IRR
- -13.2%
- Equity multiple
- 0.23×
- Total profit
- $-38,078
- Equity at exit
- $15,347
Cash invested: $49,700 (down + closing). Projections, not guarantees.
Landlord ↔ Tenant lean methodology
- Overall (STATE)
- 87 Strongly Landlord-Friendly
- State Florida
- 87 Strongly Landlord-Friendly · R+3
- County
- — inherits STATE
- City
- — inherits STATE
ZIP-level market 34785
- Home prices YoY
- -10.7%
- Rents YoY
- 2.9%
- Active inventory
- 428
- Price-to-rent
- 8.9×
Monthly cashflow live
- Estimated rent
- $1,667 medium interval (Pro) →
- Mortgage (P&I)
- −$931
- Tax from tax record
- −$42 /mo · $505/yr
- Insurance
- −$74
- HOA
- −$361
- Vacancy / Maint / Mgmt
- −$350
- Net cashflow
- $-91
Break-even live
Sensitivity live
| Price | -10% $10 | -5% $-40 | +0% $-91 | +5% $-141 | +10% $-191 |
|---|---|---|---|---|---|
| Rent | -10% $-222 | -5% $-156 | +0% $-91 | +5% $-25 | +10% $41 |
| Rate | -1.0pp $-1 | -0.5pp $-45 | base $-91 | +0.5pp $-137 | +1.0pp $-183 |
UW: 25.0% down · 7.5% · 30yr · 1.5% tax · 5.0% vac · 8.0% maint · 8.0% mgmt
Financing live
Cash to close
- Down payment
- $44,375
- Closing costs
- $5,325
- Reserves months
- —
- Total cash needed
- —
Loan-product check · same deal, 3 products live
Conventional
25% down · 7.5% · 30yr
- Down + closing
- —
- Monthly P&I
- —
- Monthly cashflow
- —
- DSCR
- —
- Eligible?
- —
Personal DTI + credit; lowest rate.
DSCR
20% down · 8.5% · 30yr
- Down + closing
- —
- Monthly P&I
- —
- Monthly cashflow
- —
- DSCR
- —
- Eligible?
- —
No personal income docs; deal must DSCR.
Hard money
10% down · 12.0% · 12mo
- Down + closing
- —
- Monthly P&I
- —
- Monthly cashflow
- —
- DSCR
- —
- Eligible?
- —
Short-term bridge; refi at stabilization.
Rent comps 3 comps
| Address | Beds | Baths | Sqft | Rent | $/sqft | DOM | Units | Dist |
|---|---|---|---|---|---|---|---|---|
| 15203 Sandalwood Dr #203 Wildwood, FL | 3.0 | 3.0 | 1474 | $1,550 | $1.05 | 22d | 1 | 0.94mi |
| 21204 Sandalwood Dr Unit 21-204 Wildwood, FL | 2.0 | 2.0 | 1110 | $1,550 | $1.40 | 22d | 1 | 1.01mi |
| 5541 Goodman Ct The Villages, FL | 2.0 | 2.0 | 1203 | $1,990 | $1.65 | 22d | 1 | 1.46mi |
HOA detail
- Monthly dues
- $361 · $4,332/yr
- Likely covers
- water
Listing history 23 events
-
2026-06-22days on market $177,500 Active 61 DOM
-
2026-06-19days on market $177,500 Active 59 DOM
-
2026-06-18days on market $177,500 Active 58 DOM
-
2026-06-17days on market $177,500 Active 57 DOM
-
2026-06-16days on market $177,500 Active 56 DOM
-
2026-06-15days on market $177,500 Active 55 DOM
-
2026-06-14days on market $177,500 Active 53 DOM
-
2026-06-13days on market $177,500 Active 52 DOM
-
2026-06-10days on market $177,500 Active 50 DOM
-
2026-06-09days on market $177,500 Active 49 DOM
-
2026-06-08days on market $177,500 Active 48 DOM
-
2026-06-07days on market $177,500 Active 47 DOM
-
2026-06-02days on market $177,500 Active 42 DOM
-
2026-06-01days on market $177,500 Active 41 DOM
-
2026-05-31days on market $177,500 Active 40 DOM
-
2026-05-30days on market $177,500 Active 39 DOM
-
2026-04-21$177,500 Active
-
2026-04-19historical
-
2026-03-19price $179,900
-
2026-02-24price $199,000
-
2025-11-28$208,000 Active
-
2005-02-02soldstatus $92,000
-
1997-01-14soldstatus $58,000
ⓘ Source: listings_history table (triggers on properties + properties_extension) + one-shot
backfill from property_details.listing_events for pre-trigger history.
Tax reassessment forecast FL · Resets to sale price
- Current annual tax
- $505 · $42/mo
- Projected year-2 tax
- $1,473 · $123/mo
- Expected delta
- +$968/yr (+$81/mo · 191.7%)
ⓘ Screening estimate from a state-policy table — verify with the county assessor before closing.
Climate risk First Street
- Flood 3/10 Moderate FEMA zone X (unshaded) · 20% chance over 30 yrs
- Wildfire 4/10 Moderate
- Heat 8/10 Severe 7 d/yr ≥108°F today · 22 d/yr by 30 yrs out
- Wind 9/10 Extreme 99% chance of damaging wind over 30 yrs
- Air quality 2/10 Low 1 unhealthy d/yr today · 2 by 30 yrs out
Nearby sold comps map
Loading sold comps map…
Walkable amenities ~0.75 mi
Loading nearby amenities…
Taxation est. · year 1
- Rental income
- $20,009
- − Mortgage interest
- −$9,943
- − Property taxes
- −$505
- − Insurance
- −$888
- − Repairs & maintenance
- −$1,601
- − Management
- −$1,601
- − HOA
- −$4,332
- − Depreciation
- −$5,164
- Taxable loss
- −$4,023
- Est. tax savings @ 24.0%
- +$966
- After-tax cash flow
- $-122/yr
For passive investors: Depreciation is non-cash, so a rental often shows a tax loss while cash-flowing — sheltering income. Rental losses are passive: they offset passive income freely, and up to $25,000/yr can offset ordinary (W-2) income if you actively participate and your MAGI is under $100k (phasing out to $0 by $150k); unused losses carry forward. On sale, claimed depreciation is recaptured at up to 25%, and gains may owe capital-gains tax (a 1031 exchange can defer both). Figures are a year-1 estimate at your 24.0% rate — not tax advice; consult a CPA.
Schools (NCES district)
- District
- Sumter
- NCES district ID
- 1201800
- Math proficiency
- 61% ▼ -4.00%
- Reading proficiency
- 61% ▼ -2.00%
- Median HH income
- $48,240
- Composite
- 51.74/100
- National rank
- #1682
- State rank
- #11 of 73 in FL
Livability — Wildwood
- Score
- 69/100
- State rank
- #471
- US rank
- #8500
Category grades
Schools grade is shown separately in the Schools card above.
Census & demographics
- County
- Sumter County · 110,591 people
- City population
- 21,568
- Metro
- The Villages, FL
- Population (ZIP)
- 21,568
- Household income
- $66,136
- Rent vs Own
- Severe rent burden
- 730.0
Population outlook (Sumter County) Hauer SSP2
- Today (2025)
- 161,172 people
- By 2030
- 180,083 · +11.7%
- By 2040
- 209,892 · +30.2%
- By 2050
- 234,186 · +45.3%
- By 2075
- 284,602 · +76.6%
- By 2100
- 317,039 · +96.7%
Race, ethnicity, and origin ACS 2023
- Neighborhood character
- Diverse neighborhood (Simpson 0.62)
- Race & ethnicity
- White 52% Black 29% Hispanic / Latino 14% Two or more races 3%
- Hispanic origin (detail)
- Mexican 4% Puerto Rican 2%
- Common ancestry
- Romanian 3% Lithuanian 2% Italian 2%
- Foreign-born
- 11% · Canada, Jamaica
- Languages at home
- 85% English-only · Spanish 12% Other Indo-European 1% French/Haitian/Cajun 1%
Political lean MEDSL · Sumter
- 2024 margin
- Solid R (+37.6) · D 30.9% · R 68.6%
- 2008→2024 swing
- -10.6pp toward R · 2008: -27.0pp · 2024: -37.6pp
- All cycles
- 2024: R+37.6 2020: R+36.1 2016: R+39.2 2012: R+34.9 2008: R+27.0
Not yet ingested
- Civics
- —
Market trends
- HPI YoY
- ▼ -32.14%
- Current HPI
- 267.9137
- Rent YoY
- ▲ 2.85%
- Metro
- The Villages, FL
- State GDP YoY
- ▲ 3.28%
- F500 in state
- 36
Industry mix (Fortune 500 HQ in FL)
| Industry | F500 HQs | Revenue |
|---|---|---|
| Industrial Technology | 2 | $29B |
|
||
| Insurance | 2 | $17B |
|
||
| Retail | 1 | $60B |
|
||
| Technology Distribution | 1 | $58B |
|
||
| Homebuilding | 1 | $35B |
|
||
| Technology Manufacturing | 1 | $35B |
|
||
Price history
+206.0% since first listed7 events — show timeline
- 2026-04-21 Listed $177,500 Stellar MLS as Distributed by MLS Grid
- 2026-04-19 Listing Removed — Stellar MLS as Distributed by MLS Grid
- 2026-03-19 Price Changed $179,900 Stellar MLS as Distributed by MLS Grid
- 2026-02-24 Price Changed $199,000 Stellar MLS as Distributed by MLS Grid
- 2025-11-28 Listed $208,000 Stellar MLS as Distributed by MLS Grid
- 2005-02-02 Sold (Public Records) $92,000 Public Records
- 1997-01-14 Sold (Public Records) $58,000 Public Records
Property tax history
+2.0%/yrLatest (2025): $505 · +2.0% YoY. Source: county tax records.
Cash-flow waterfall
monthlySold comps — $/sqft
last 12 mo · ≤1 miLoading sold comps…