None · Florida Ridge, FL
Flood risk 1/10 · Minimal
- FEMA flood zone
- X (unshaded)
- Chance of flooding over 30 yrs
- 0.0%
- Est. flood insurance / yr
- $507 – $1,088
Fire risk 4/10 · Minor
- Est. fire insurance / yr
- $947 – $1,759
Heat risk 10/10 · Severe
- Hot days now (above 107°F)
- 7 days/yr
- Hot days in 30 yrs
- 26 days/yr
Wind risk 10/10 · Severe
- Chance of severe wind over 30 yrs
- 99.0%
Air-quality risk 1/10 · Minimal
- Unhealthy air days now
- 0 days/yr
- Unhealthy air days in 30 yrs
- 0 days/yr
Risk factors via First Street. Map © Google.
Why this score? — see what drove the F grade
The composite is a weighted blend of 9 inputs, each scored 0–100. Each bar is that input's sub-score; the figure is the points it added to the 100-point composite (weight × sub-score).
- Cash flow +7.2/30.0
- Schools +4.2/10.0
- Livability +3.6/5.0
- Rent growth +3.5/5.0
- Condition / age +2.5/5.0
- DSCR +1.4/10.0
- 1% rule +1.1/10.0
- ARV discount +0.0/15.0
- Appreciation +0.0/10.0
$260,000
🖨 Deal sheet 📄 Offer letter ✓ Due diligence
Listing remarks
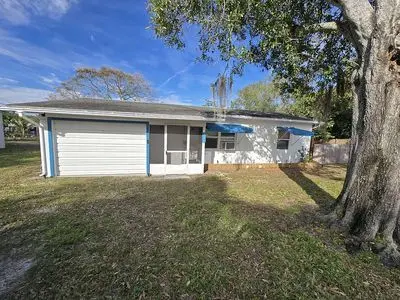
Lovely 3BR/2BA home featuring all impact glass windows, a detached workshop, and side-yard space for RV, boat, or trailer parking. Enjoy the private backyard with a spacious wooden deck, perfect for relaxing or entertaining, plus a hot tub that can convey with the home. Situated on a quiet dead-end street with minimal traffic, this well-maintained, move-in-ready property is conveniently located near Vero Beach's beautiful beaches, shopping, dining, and everyday amenities. Plenty of room for hobbies, storage, and outdoor enjoyment while embracing the Florida lifestyle. rmszappr & sub2err
Key facts
- 6,534 sq ft lot
- Garage
- Built 1964
Neighborhood map
What this means for you Summary
Snapshot
- This is a 2-bed/2.0-bath single-family listed at $260k.
Deal economics
- At list price, monthly cash flow is $-360 ($-4k/yr) — negative.
- To cash-flow at today's rent, offer at most $196k (24.5% below list).
- To meet the 1% rule (rent ≥ 1% of price), the offer needs to be $159k (38.8% below list).
- Recommended offer: $159k (38.8% below list) — sets the bar for 1% rule.
Location & tenants
- Location reads 72/100 on livability (#353 in FL) — a middle-class / working-renter tenant base. Strengths: commute A+, cost of living A+, housing A+; Watch: schools D, employment D, amenities F.
- Indian River (other): math 48% / reading 52% proficiency, ranked #35 of 73 in FL (top 48%) — acceptable for families but not a draw, mixed tenant base, ~2y average lease.
- Market conditions: Rents rising fast (+4.2%/yr); 348 active listings in the ZIP; 564 units permitted in Indian River County in 2024 (281 in 5+ unit buildings).
Forward outlook
- Local home prices are declining (-3.0%/yr); year-one equity from $2k of loan paydown is wiped out by about $8k of value loss. Plan a longer hold.
- Indian River County population projected at +18% by 2050 — long-run rental-demand tailwind backs the buy-and-hold thesis.
Negotiation context
- Only 4 days on market — expect competitive offers; lowballing is unlikely to land.
Risks & watch-outs
- Climate carrying-cost: severe wind risk, 99% chance of damaging wind over 30y; extreme-heat days projected 7→26/yr by 2055 (HVAC capex compounding) — expect insurance premiums to compound above CPI over the hold.
Questions for the listing agent
- What do current leases actually rent for vs. the listed asking? Can we see a recent rent roll and the last 12 months of T-12 income?
- Built in 1964 — when were the roof, HVAC, electrical panel, plumbing, and water heater last replaced?
- Is there a deadline driving the sale (1031 exchange, divorce, estate, relocation)? That informs how much negotiation room exists.
- Schools are D-rated, which usually means shorter tenancies and higher turnover. Who's the typical renter profile here, and what's been the actual vacancy rate?
- The area grade is low — what's the realistic commute time and amenity access for the typical tenant pool here? Any planned neighborhood developments (good or bad) we should know about?
- What's the average days-on-market for RENTAL listings here right now (not sales)? A rising rental-DOM trend means longer vacancies and softer asking-rent achievability than the comps imply.
- What's the recent tenant-quality profile in this submarket — average credit score on applications, eviction rate, late-payment / NSF rate, and stable-employment percentage? A property-management company in the area should have these aggregated.
- How much new for-sale + rental construction is in the pipeline within 1–3 miles? Heavy new supply typically softens prices + rents 12–24 months out; constrained supply supports both.
Investment metrics
- 1% rule
- 0.61% ✗
- Cap rate
- 4.63%
- Cash-on-cash
- -5.93%
- DSCR
- 0.74
- GRM
- 13.6
CMA / ARV
- ARV (on-the-fly)
- $220,224
- Comps found
- 9
Show comp detail 9 sales within ~0.75 mi
| Address | Dist | Beds/Ba | Sqft | Sold | Price | $/sf | Match |
|---|---|---|---|---|---|---|---|
| 2263 4th Ave SE | 0.23mi | 2/1.0 | 978 (-1%) | 3mo | $312,000 | $319 | 80 |
| 2338 2nd Ct SE | 0.11mi | 3/2.0 (+1) | 1,080 (+9%) | 2mo | $289,000 | $268 | 73 |
| 2343 2nd Ct SE | 0.11mi | 2/1.5 | 1,056 (+6%) | 13mo | $234,900 | $222 | 71 |
| 2303 2nd Ct SE | 0.18mi | 2/1.0 | 1,002 (+1%) | 18mo | $219,000 | $219 | 70 |
| 2429 2nd Ave SE | 0.15mi | 3/1.0 (+1) | 1,056 (+6%) | 5mo | $136,000 | $129 | 69 |
| 154 21 St SW | 0.59mi | 3/2.0 (+1) | 1,000 (+1%) | 2mo | $282,000 | $282 | 65 |
| 2317 2nd Ave SE | 0.20mi | 3/2.0 (+1) | 1,008 (+2%) | 23mo | $235,000 | $233 | 64 |
| 2218 1st Ave SE | 0.35mi | 3/1.0 (+1) | 900 (-9%) | 7mo | $195,000 | $217 | 53 |
| 2443 2nd Ct SE | 0.11mi | 3/1.0 (+1) | 1,118 (+13%) | 23mo | $126,000 | $113 | 46 |
Match score weights: distance 35% · size 25% · config 20% · recency 20%. Top-matched comps best support the ARV.
Projected returns pro-forma
-3.0% appreciation · 4.18% rent growth · sell at horizon
- IRR
- -25.4%
- Equity multiple
- 0.13×
- Total profit
- $-63,226
- Equity at exit
- $38,767
- IRR
- -18.9%
- Equity multiple
- -0.06×
- Total profit
- $-76,882
- Equity at exit
- $22,480
Cash invested: $72,800 (down + closing). Projections, not guarantees.
Landlord ↔ Tenant lean methodology
- Overall (STATE)
- 87 Strongly Landlord-Friendly
- State Florida
- 87 Strongly Landlord-Friendly · R+3
- County
- — inherits STATE
- City
- — inherits STATE
ZIP-level market 32962
- Rents YoY
- 4.2%
- Active inventory
- 348
- Price-to-rent
- 13.6×
Monthly cashflow live
- Estimated rent
- $1,592 medium interval (Pro) →
- Mortgage (P&I)
- −$1,363
- Tax from tax record
- −$146 /mo · $1,749/yr
- Insurance
- −$108
- HOA
- −$0
- Vacancy / Maint / Mgmt
- −$334
- Net cashflow
- $-360
Break-even live
UW: 25.0% down · 7.5% · 30yr · 1.5% tax · 5.0% vac · 8.0% maint · 8.0% mgmt
Financing live
Cash to close
- Down payment
- $65,000
- Closing costs
- $7,800
- Reserves months
- —
- Total cash needed
- —
Loan-product check · same deal, 3 products live
Conventional
25% down · 7.5% · 30yr
- Down + closing
- —
- Monthly P&I
- —
- Monthly cashflow
- —
- DSCR
- —
- Eligible?
- —
Personal DTI + credit; lowest rate.
DSCR
20% down · 8.5% · 30yr
- Down + closing
- —
- Monthly P&I
- —
- Monthly cashflow
- —
- DSCR
- —
- Eligible?
- —
No personal income docs; deal must DSCR.
Hard money
10% down · 12.0% · 12mo
- Down + closing
- —
- Monthly P&I
- —
- Monthly cashflow
- —
- DSCR
- —
- Eligible?
- —
Short-term bridge; refi at stabilization.
Listing history 14 events
-
2026-06-19days on market $260,000 Active 4 DOM
-
2026-06-18days on market $260,000 Active 3 DOM
-
2026-06-17days on market $260,000 Active 2 DOM
-
2026-06-15statusdays on market $260,000 Active 1 DOM
-
2026-06-15days on market $260,000 Coming Soon 12 DOM
-
2026-06-14days on market $260,000 Coming Soon 10 DOM
-
2026-06-13days on market $260,000 Coming Soon 9 DOM
-
2026-06-10days on market $260,000 Coming Soon 7 DOM
-
2026-06-09days on market $260,000 Coming Soon 6 DOM
-
2026-06-08days on market $260,000 Coming Soon 5 DOM
-
2026-06-07days on market $260,000 Coming Soon 4 DOM
-
2026-06-05remarks 593-char remark
-
2026-06-05pricestatus $260,000 Coming Soon 1 DOM
-
2026-05-26$250,000 Active
ⓘ Source: listings_history table (triggers on properties + properties_extension) + one-shot
backfill from property_details.listing_events for pre-trigger history.
Tax reassessment forecast FL · Resets to sale price
- Current annual tax
- $1,749 · $146/mo
- Projected year-2 tax
- $2,158 · $180/mo
- Expected delta
- +$409/yr (+$34/mo · 23.4%)
ⓘ Screening estimate from a state-policy table — verify with the county assessor before closing.
Climate risk First Street
- Flood 1/10 Low FEMA zone X (unshaded) · 0% chance over 30 yrs
- Wildfire 4/10 Moderate
- Heat 10/10 Extreme 7 d/yr ≥107°F today · 26 d/yr by 30 yrs out
- Wind 10/10 Extreme 99% chance of damaging wind over 30 yrs
- Air quality 1/10 Low 0 unhealthy d/yr today · 0 by 30 yrs out
Nearby sold comps map
Loading sold comps map…
Walkable amenities ~0.75 mi
Loading nearby amenities…
Taxation est. · year 1
- Rental income
- $19,104
- − Mortgage interest
- −$14,564
- − Property taxes
- −$1,749
- − Insurance
- −$1,300
- − Repairs & maintenance
- −$1,528
- − Management
- −$1,528
- − Depreciation
- −$7,564
- Taxable loss
- −$9,129
- Est. tax savings @ 24.0%
- +$2,191
- After-tax cash flow
- $-2,127/yr
For passive investors: Depreciation is non-cash, so a rental often shows a tax loss while cash-flowing — sheltering income. Rental losses are passive: they offset passive income freely, and up to $25,000/yr can offset ordinary (W-2) income if you actively participate and your MAGI is under $100k (phasing out to $0 by $150k); unused losses carry forward. On sale, claimed depreciation is recaptured at up to 25%, and gains may owe capital-gains tax (a 1031 exchange can defer both). Figures are a year-1 estimate at your 24.0% rate — not tax advice; consult a CPA.
Schools (NCES district)
- District
- Indian River
- NCES district ID
- 1200930
- Math proficiency
- 48% ▼ -9.00%
- Reading proficiency
- 52% ▼ -3.00%
- Median HH income
- $46,597
- Composite
- 42.45/100
- National rank
- #3218
- State rank
- #35 of 73 in FL
Livability — Florida Ridge
- Score
- 72/100
- State rank
- #353
- US rank
- #6129
Category grades
Schools grade is shown separately in the Schools card above.
Census & demographics
- Census place
- Florida Ridge, FL
- County
- Indian River County · 143,738 people
- City population
- 25,629
- Metro
- Sebastian-Vero Beach, FL
- Population (ZIP)
- 25,522
- Household income
- $66,664
- Rent vs Own
- Severe rent burden
- 425.0
Population outlook (Indian River County) Hauer SSP2
- Today (2025)
- 165,104 people
- By 2030
- 172,869 · +4.7%
- By 2040
- 185,640 · +12.4%
- By 2050
- 194,465 · +17.8%
- By 2075
- 211,115 · +27.9%
- By 2100
- 211,781 · +28.3%
Race, ethnicity, and origin ACS 2023
- Neighborhood character
- Predominantly White (70%)
- Race & ethnicity
- White 70% Black 13% Hispanic / Latino 12% Two or more races 5% Native American 1%
- Hispanic origin (detail)
- Mexican 1% Puerto Rican 2% Cuban 1%
- Common ancestry
- Romanian 4% Lithuanian 4% Italian 3%
- Foreign-born
- 12% · Canada, Jamaica, Dominican Republic
- Languages at home
- 85% English-only · Spanish 9% Other Indo-European 2% French/Haitian/Cajun 1%
Political lean MEDSL · Indian River
- 2024 margin
- Strong R (+27.4) · D 36.0% · R 63.4%
- 2008→2024 swing
- -12.5pp toward R · 2008: -14.8pp · 2024: -27.4pp
- All cycles
- 2024: R+27.4 2020: R+21.6 2016: R+24.5 2012: R+22.3 2008: R+14.8
Not yet ingested
- Civics
- —
Market trends
- HPI YoY
- ▼ -182.13%
- Current HPI
- 333.3274
- Rent YoY
- ▲ 4.18%
- Metro
- Sebastian-Vero Beach, FL
- State GDP YoY
- ▲ 3.28%
- F500 in state
- 36
Industry mix (Fortune 500 HQ in FL)
| Industry | F500 HQs | Revenue |
|---|---|---|
| Industrial Technology | 2 | $29B |
|
||
| Insurance | 2 | $17B |
|
||
| Retail | 1 | $60B |
|
||
| Technology Distribution | 1 | $58B |
|
||
| Homebuilding | 1 | $35B |
|
||
| Technology Manufacturing | 1 | $35B |
|
||
Price history
1 event — show timeline
- 2026-05-26 Listed $250,000 FSBO.com
Property tax history
+29.5%/yrLatest (2025): $1,749 · +16.8% YoY. Source: county tax records.
Cash-flow waterfall
monthlySold comps — $/sqft
last 12 mo · ≤1 miLoading sold comps…