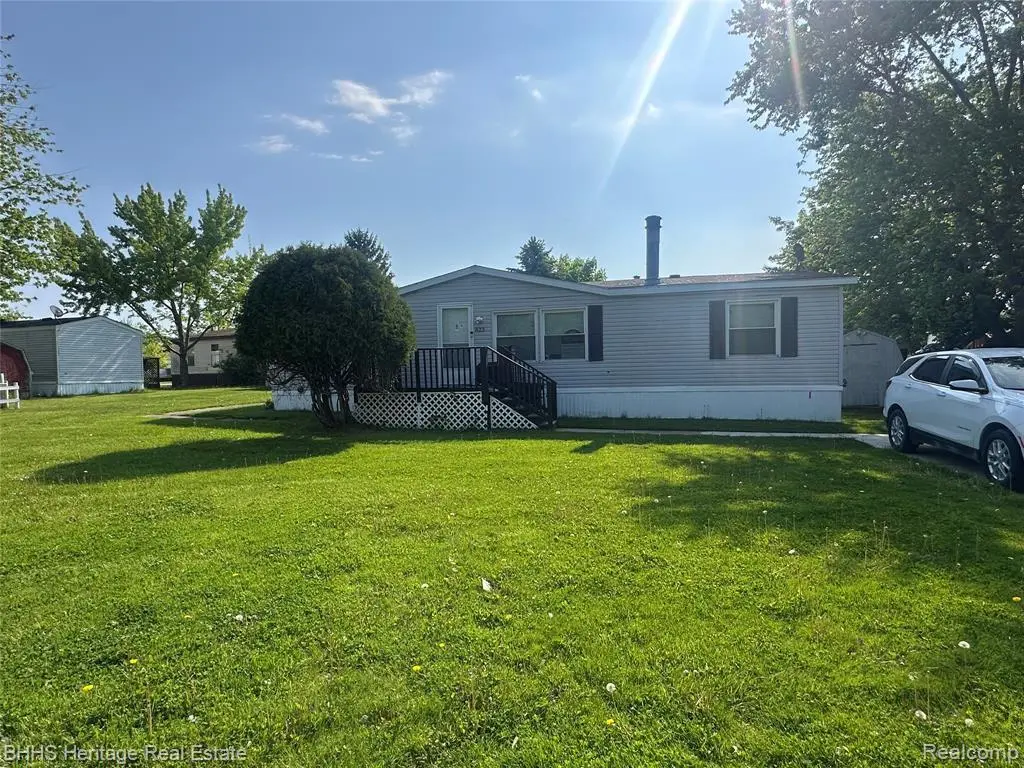
823 Linden · Handy, MI
Flood risk No data
- FEMA flood zone
- —
- Chance of flooding over 30 yrs
- —
- Est. flood insurance / yr
- —
Fire risk No data
- Est. fire insurance / yr
- —
Heat risk No data
- Hot days now (above threshold)
- —
- Hot days in 30 yrs
- —
Wind risk No data
- Chance of severe wind over 30 yrs
- —
Air-quality risk No data
- Unhealthy air days now
- —
- Unhealthy air days in 30 yrs
- —
Risk factors via First Street. Map © Google.
Why this score? — see what drove the B- grade
The composite is a weighted blend of 9 inputs, each scored 0–100. Each bar is that input's sub-score; the figure is the points it added to the 100-point composite (weight × sub-score).
- Cash flow +27.6/30.0
- 1% rule +10.0/10.0
- DSCR +9.7/10.0
- ARV discount +7.5/15.0
- Condition / age +3.8/5.0
- Schools +3.2/10.0
- Rent growth +2.5/5.0
- Livability +2.5/5.0
- Appreciation +0.0/10.0
$30,000
🖨 Deal sheet 📄 Offer letter ✓ Due diligence
Listing remarks MLS
Spacious 3-bedroom, 2-bath double-wide manufactured home in a welcoming community! Features include an open floor plan, large kitchen, private primary suite, abundant natural light, and convenient single-level living. Close to shopping, dining, and major roadways. Affordable and move-in ready!
Key facts
- Open floor plan
- Large kitchen
- Single-level living
Tags
Property features AI
Finance
- Other: Directions: Grand Ave to Van Riper west to Linden (cross street Van Riper and Linden)
- HOA & community: Homeowners association with a $529 monthly fee; HOA fee includes trash
Exterior
- Parking: No garage
- Utilities: Public water; Public sewer
- Home design: Single‑family residence; One story; Ground‑level entry with steps
- Construction: Vinyl siding; Pillar/post/pier foundation; Built area above grade: 1,100 (finished)
- Exterior features: Deck; Porch; Paved road access; Irregular lot shape
Interior
- Kitchen: Free‑standing electric oven; Free‑standing refrigerator; Dishwasher not listed
- Bedrooms: 3 rooms total (includes bedrooms and living spaces)
- Bathrooms: 2 full bathrooms
- Heating & cooling: Central air conditioning; Electric forced‑air heating
- Interior features: Dryer; Washer; Free‑standing electric oven; Free‑standing refrigerator
- Laundry & utility: Washer and Dryer
Neighborhood map
What this means for you Summary
Snapshot
- This is a 3-bed/2.0-bath single-family listed at $30k. Condition is rated good.
Deal economics
- At list price, monthly cash flow is $90 ($1k/yr) — positive.
- The deal already cash-flows at list — no discount required.
- Meets the 1% rule at list price ($1k rent vs $30k).
- Recommended offer: $29k (3.0% below list) — sets the bar for market timing.
Location & tenants
- Location reads: area grade B — affects rentability + tenant quality, not the cash-flow math above.
- Fowlerville Community Schools (town): math 30% / reading 42% proficiency, ranked #240 of 540 in MI (top 44%) — families likely to look elsewhere, expect single-tenant / working-renter base with shorter leases.
- Market conditions: 114 active listings in the ZIP; 3 comparable units currently listed for rent nearby; rentals at typical pace (median 15d on market — plan ~3-4 weeks tenant-placement turnaround); 488 units permitted in Livingston County in 2024 (0 in 5+ unit buildings).
Forward outlook
- Local home prices are declining (-3.0%/yr); year-one equity from $207 of loan paydown is wiped out by about $900 of value loss. Plan a longer hold.
- Livingston County population projected at +7% by 2050 — modest demand growth; plan on rents tracking national, not racing it.
- At projected returns (-3.0% appreciation + 3.0% rent growth), your $8k cash investment doubles in ~9 years — after that, you're playing with house money.
Negotiation context
- It's been on market 31 days — a 3% lower offer ($29k) is reasonable based on typical stale-listing flexibility.
- 2 sale attempts; this cycle's ask has dropped $9k (23%) from the opening price — seller is motivated, your offer sets the floor, not the list.
Risks & watch-outs
- Watch-outs: HOA is 51% of rent.
Questions for the listing agent
- It's been on market 31 days. Have you received any prior offers? Is the seller open to a 3% concession, seller financing, or rate buy-down credit?
- What does the HOA fee cover, when was the last increase, and are there any pending special assessments or reserve-fund shortfalls?
- Is there a deadline driving the sale (1031 exchange, divorce, estate, relocation)? That informs how much negotiation room exists.
- What's the average days-on-market for RENTAL listings here right now (not sales)? A rising rental-DOM trend means longer vacancies and softer asking-rent achievability than the comps imply.
- What's the recent tenant-quality profile in this submarket — average credit score on applications, eviction rate, late-payment / NSF rate, and stable-employment percentage? A property-management company in the area should have these aggregated.
- How much new for-sale + rental construction is in the pipeline within 1–3 miles? Heavy new supply typically softens prices + rents 12–24 months out; constrained supply supports both.
Investment metrics
- 1% rule
- 3.49% ✓
- Cap rate
- 9.88%
- Cash-on-cash
- 12.82%
- DSCR
- 1.57
- GRM
- 2.4
CMA / ARV
- ARV (on-the-fly)
- $234,300
- Comps found
- 5
Show comp detail 5 sales within ~0.75 mi
| Address | Dist | Beds/Ba | Sqft | Sold | Price | $/sf | Match |
|---|---|---|---|---|---|---|---|
| 310 Cedar River Dr | 0.25mi | 3/2.0 | 1,038 (-6%) | 18mo | $226,900 | $219 | 64 |
| 744 Village Dr | 0.40mi | 3/2.5 | 1,218 (+11%) | 18mo | $261,000 | $214 | 47 |
| 123 Hale St E | 0.52mi | 3/1.0 | 972 (-12%) | 8mo | $207,500 | $213 | 46 |
| 212 Free St | 0.58mi | 2/1.0 (-1) | 1,058 (-4%) | 16mo | $200,000 | $189 | 44 |
| 713 Village Dr | 0.35mi | 3/2.0 | 1,240 (+13%) | 23mo | $244,000 | $197 | 43 |
Match score weights: distance 35% · size 25% · config 20% · recency 20%. Top-matched comps best support the ARV.
Projected returns pro-forma
-3.0% appreciation · 3.0% rent growth · sell at horizon
- IRR
- 3.7%
- Equity multiple
- 1.14×
- Total profit
- $1,196
- Equity at exit
- $4,473
- IRR
- 14.0%
- Equity multiple
- 2.17×
- Total profit
- $9,786
- Equity at exit
- $2,594
Cash invested: $8,400 (down + closing). Projections, not guarantees.
Landlord ↔ Tenant lean methodology
- Overall (STATE)
- 62 Landlord-Friendly
- State Michigan
- 62 Landlord-Friendly · EVEN
- County
- — inherits STATE
- City
- — inherits STATE
ZIP-level market 48836
- Active inventory
- 114
- Price-to-rent
- 2.4×
Monthly cashflow live
- Estimated rent
- $1,046 medium interval (Pro) →
- Mortgage (P&I)
- −$157
- Tax est. 1.5%
- −$38 /mo · $450/yr
- Insurance
- −$12
- HOA
- −$529
- Vacancy / Maint / Mgmt
- −$220
- Net cashflow
- $90
Break-even live
UW: 25.0% down · 7.5% · 30yr · 1.5% tax · 5.0% vac · 8.0% maint · 8.0% mgmt
Financing live
Cash to close
- Down payment
- $7,500
- Closing costs
- $900
- Reserves months
- —
- Total cash needed
- —
Loan-product check · same deal, 3 products live
Conventional
25% down · 7.5% · 30yr
- Down + closing
- —
- Monthly P&I
- —
- Monthly cashflow
- —
- DSCR
- —
- Eligible?
- —
Personal DTI + credit; lowest rate.
DSCR
20% down · 8.5% · 30yr
- Down + closing
- —
- Monthly P&I
- —
- Monthly cashflow
- —
- DSCR
- —
- Eligible?
- —
No personal income docs; deal must DSCR.
Hard money
10% down · 12.0% · 12mo
- Down + closing
- —
- Monthly P&I
- —
- Monthly cashflow
- —
- DSCR
- —
- Eligible?
- —
Short-term bridge; refi at stabilization.
Rent comps 3 comps
| Address | Beds | Baths | Sqft | Rent | $/sqft | DOM | Units | Dist |
|---|---|---|---|---|---|---|---|---|
| 271 Garden Ln Fowlerville, MI | 2.0 | 1.0 | 975 | $1,125 | $1.15 | 1d | 1 | 0.30mi |
| 332 Garden Ln Fowlerville, MI | 2.0 | 1.0 | 900 | $995 | $1.11 | 24d | 1 | 0.33mi |
| 121 E Van Riper Rd Fowlerville, MI | 2.0 | 1.0 | 900 | $1,000 | $1.11 | 14d | 1 | 0.36mi |
HOA detail
- Monthly dues
- $529 · $6,348/yr
Listing history 17 events
-
2026-06-18days on market $30,000 Active 31 DOM
-
2026-06-17days on market $30,000 Active 30 DOM
-
2026-06-16days on market $30,000 Active 29 DOM
-
2026-06-15days on market $30,000 Active 28 DOM
-
2026-06-13days on market $30,000 Active 26 DOM
-
2026-06-13days on market $30,000 Active 25 DOM
-
2026-06-10price $30,000 Active 22 DOM
-
2026-06-09days on market $39,000 Active 22 DOM
-
2026-06-08days on market $39,000 Active 21 DOM
-
2026-06-07days on market $39,000 Active 20 DOM
-
2026-06-04days on market $39,000 Active 17 DOM
-
2026-06-03days on market $39,000 Active 16 DOM
-
2026-06-02days on market $39,000 Active 15 DOM
-
2026-06-01days on market $39,000 Active 14 DOM
-
2026-05-31days on market $39,000 Active 13 DOM
-
2026-05-18$39,000 Active
Show marketing remark (294 chars)
Spacious 3-bedroom, 2-bath double-wide manufactured home in a welcoming community! Features include an open floor plan, large kitchen, private primary suite, abundant natural light, and convenient single-level living. Close to shopping, dining, and major roadways. Affordable and move-in ready!
-
2026-05-18$39,000 Active 294-char remark
Show marketing remark (294 chars)
Spacious 3-bedroom, 2-bath double-wide manufactured home in a welcoming community! Features include an open floor plan, large kitchen, private primary suite, abundant natural light, and convenient single-level living. Close to shopping, dining, and major roadways. Affordable and move-in ready!
ⓘ Source: listings_history table (triggers on properties + properties_extension) + one-shot
backfill from property_details.listing_events for pre-trigger history.
Nearby sold comps map
Loading sold comps map…
Walkable amenities ~0.75 mi
Loading nearby amenities…
Taxation est. · year 1
- Rental income
- $12,548
- − Mortgage interest
- −$1,680
- − Property taxes
- −$450
- − Insurance
- −$150
- − Repairs & maintenance
- −$1,004
- − Management
- −$1,004
- − HOA
- −$6,348
- − Depreciation
- −$873
- Taxable income
- $1,039
- Est. tax owed @ 24.0%
- −$249
- After-tax cash flow
- $828/yr
For passive investors: Depreciation is non-cash, so a rental often shows a tax loss while cash-flowing — sheltering income. Rental losses are passive: they offset passive income freely, and up to $25,000/yr can offset ordinary (W-2) income if you actively participate and your MAGI is under $100k (phasing out to $0 by $150k); unused losses carry forward. On sale, claimed depreciation is recaptured at up to 25%, and gains may owe capital-gains tax (a 1031 exchange can defer both). Figures are a year-1 estimate at your 24.0% rate — not tax advice; consult a CPA.
Condition & rehab AI · 2 photos
This move-in ready, single-family home in Fowlerville MI is in good condition with a good exterior and interior. It offers a spacious floor plan and is located in a welcoming community. Minor updates to the exterior and interior can further enhance its value.
Value-add opportunities
- Both Paint exterior siding — Fresh paint can enhance curb appeal and the home's overall appearance.
- Both Clean and maintain gutters — Clean gutters improve drainage and prevent water damage, enhancing the home's value.
- Both Update landscaping — Fresh landscaping can improve curb appeal and add value to the home.
- Both Replace any worn-out windows — New windows can improve energy efficiency and increase the home's value.
- Both Upgrade HVAC system — A modern HVAC system can improve comfort and energy efficiency, boosting both resale and rental value.
Renovation cost estimate screening
Value-add ROI direction
- Both Paint exterior siding — Fresh paint can enhance curb appeal and the home's overall appearance. ↑
- Both Clean and maintain gutters — Clean gutters improve drainage and prevent water damage, enhancing the home's value. ↑
- Both Update landscaping — Fresh landscaping can improve curb appeal and add value to the home. ↑
- Both Replace any worn-out windows — New windows can improve energy efficiency and increase the home's value. ↑
- Both Upgrade HVAC system — A modern HVAC system can improve comfort and energy efficiency, boosting both resale and rental value. ↑
ⓘ Cost ranges are severity-bucket heuristics (US national rule-of-thumb). Get contractor quotes + a written scope before underwriting a rehab budget.
Schools (NCES district)
- District
- Fowlerville Community Schools
- NCES district ID
- 2614730
- Math proficiency
- 30% ▼ -10.00%
- Reading proficiency
- 42% ▼ -5.00%
- Median HH income
- $62,306
- Composite
- 32.31/100
- National rank
- #5748
- State rank
- #240 of 540 in MI
Livability — Handy
No livability data for this city. (Only ~50 U.S. cities are tracked.)
Census & demographics
- Census place
- Fowlerville, MI
- Population (ZIP)
- 14,978
Population outlook (Livingston County) Hauer SSP2
- Today (2025)
- 202,920 people
- By 2030
- 209,173 · +3.1%
- By 2040
- 216,878 · +6.9%
- By 2050
- 217,485 · +7.2%
- By 2075
- 217,590 · +7.2%
- By 2100
- 197,095 · -2.9%
Race, ethnicity, and origin ACS 2023
- Neighborhood character
- Predominantly White (96%)
- Race & ethnicity
- White 96% Two or more races 2%
- Common ancestry
- Romanian 7% Italian 6% Lithuanian 4%
- Foreign-born
- 1%
Political lean MEDSL · Livingston
- 2024 margin
- Strong R (+23.9) · D 37.4% · R 61.3% · Other 1.3%
- 2008→2024 swing
- -10.7pp toward R · 2008: -13.3pp · 2024: -23.9pp
- All cycles
- 2024: R+23.9 2020: R+22.6 2016: R+29.6 2012: R+23.3 2008: R+13.3
Not yet ingested
- Civics
- —
Market trends
- HPI YoY
- ▼ -150.44%
- Current HPI
- 201.7919
- Rent YoY
- —
- Metro
- —
- State GDP YoY
- ▲ 1.37%
- F500 in state
- 28
Industry mix (Fortune 500 HQ in MI)
| Industry | F500 HQs | Revenue |
|---|---|---|
| Automotive Parts | 3 | $48B |
|
||
| Automotive | 2 | $372B |
|
||
| Chemicals | 1 | $45B |
|
||
| Automotive Retail | 1 | $29B |
|
||
| Healthcare / Medical Devices | 1 | $23B |
|
||
| Automotive Technology | 1 | $20B |
|
||
Price history
+0.0% since first listed2 events — show timeline
- 2026-05-18 Listed $39,000 REALCOMP
- 2026-05-18 Listed $39,000 MiRealSource-MiMLS
Cash-flow waterfall
monthlySold comps — $/sqft
last 12 mo · ≤1 miLoading sold comps…