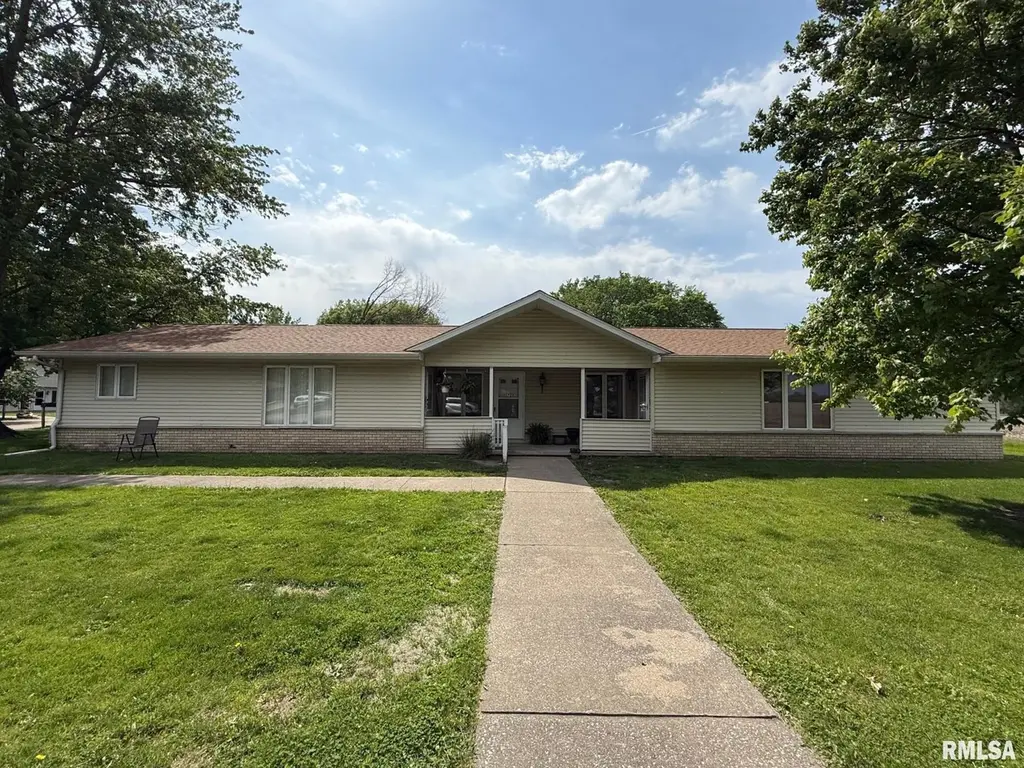
172 James Dr Unit C · Macomb, IL
Flood risk 1/10 · Minimal
- FEMA flood zone
- —
- Chance of flooding over 30 yrs
- 0.0%
- Est. flood insurance / yr
- —
Fire risk 1/10 · Minimal
- Est. fire insurance / yr
- $804 – $1,492
Heat risk 3/10 · Minor
- Hot days now (above 107°F)
- 7 days/yr
- Hot days in 30 yrs
- 17 days/yr
Wind risk 2/10 · Minimal
- Chance of severe wind over 30 yrs
- 0.0%
Air-quality risk 2/10 · Minimal
- Unhealthy air days now
- 0 days/yr
- Unhealthy air days in 30 yrs
- 1 days/yr
Risk factors via First Street. Map © Google.
Why this score? — see what drove the B grade
The composite is a weighted blend of 9 inputs, each scored 0–100. Each bar is that input's sub-score; the figure is the points it added to the 100-point composite (weight × sub-score).
- Cash flow +30.0/30.0
- ARV discount +12.2/15.0
- 1% rule +10.0/10.0
- DSCR +10.0/10.0
- Livability +3.5/5.0
- Condition / age +2.8/5.0
- Rent growth +2.5/5.0
- Schools +1.8/10.0
- Appreciation +0.0/10.0
$35,000
🖨 Deal sheet 📄 Offer letter ✓ Due diligence
Listing remarks
With a little bit of TLC, this will be a wonderful, cost effective, step-free one bedroom home. Includes covered parking. Located at the south end of Macomb close to schools and hospital. Being sold in "AS IS" condition.
Key facts
- Garage
- Built 1980
- Listed 36 days
Property features AI
Finance
- Other: Property is attached (unit C)
- HOA & community: Association maintains landscaping, grounds maintenance, snow removal, common area maintenance and irrigation
Exterior
- Parking: One covered carport and a 1-car garage
- Utilities: Public water; Public sewer
- Home design: Single-family residence; Living area approximately 588; Built in 1980
- Construction: No (not new construction)
- Exterior features: Level lot; Shingle roof
Interior
- Kitchen: Kitchen with laminate flooring (approximately 19' x 7'); Refrigerator
- Bedrooms: One bedroom on the main level (approximately 12' x 12')
- Flooring: Carpet in bedroom; Laminate in kitchen
- Bathrooms: One full bathroom
- Heating & cooling: Electric heating
- Interior features: Crawl space basement; Dryer, Refrigerator, Washer
- Laundry & utility: Washer and Dryer
Neighborhood map
What this means for you Summary
Snapshot
- This is a 1-bed/1.0-bath single-family listed at $35k. Condition is rated average.
Deal economics
- At list price, monthly cash flow is $310 ($4k/yr) — positive.
- The deal already cash-flows at list — no discount required.
- Meets the 1% rule at list price ($699 rent vs $35k).
- Recommended offer: $34k (3.0% below list) — sets the bar for market timing.
- Cap rate 16.9% vs local median 6.2% in Macomb — top-decile yield for the area; either an underpriced asset or a hidden risk that comps aren't pricing in. Stress-test before assuming the spread holds.
Location & tenants
- Location reads 70/100 on livability (#379 in IL) — a middle-class / working-renter tenant base. Strengths: cost of living A+, health & safety A+, housing B; Watch: crime D, amenities D, commute F.
- Macomb CUSD 185 (town): math 19% / reading 26% proficiency, ranked #410 of 620 in IL (top 66%) — low school quality limits family demand, transient renter base, plan for 1-2y turnover.
- Zoned schools: Macomb Senior High School (math 27% / reading 37%, grade F, #157 of 693 statewide, top 25%, 622 students, 0% FRL) — zoned schools average 0% FRL vs 40% district-wide (40 pts lower); this property's tenant base skews higher-income than the district average.
- Market conditions: 135 active listings in the ZIP; 1 comparable units currently listed for rent nearby.
- This rent is only 17% of the median local income ($49k/yr) — well below the 30% rent-burden line; pricing power to push rent on renewal without tenant pushback.
Forward outlook
- Local home prices are declining (-3.0%/yr); year-one equity from $242 of loan paydown is wiped out by about $1k of value loss. Plan a longer hold.
- At projected returns (-3.0% appreciation + 3.0% rent growth), your $10k cash investment doubles in ~4 years — after that, you're playing with house money.
Negotiation context
- It's been on market 37 days — a 3% lower offer ($34k) is reasonable based on typical stale-listing flexibility.
Questions for the listing agent
- It's been on market 37 days. Have you received any prior offers? Is the seller open to a 3% concession, seller financing, or rate buy-down credit?
- Is there a deadline driving the sale (1031 exchange, divorce, estate, relocation)? That informs how much negotiation room exists.
- Schools are D-rated, which usually means shorter tenancies and higher turnover. Who's the typical renter profile here, and what's been the actual vacancy rate?
- Crime grade is D in this area — have there been break-ins, vandalism, or insurance claims at this property in the last 3 years? What carrier currently insures it and at what premium?
- What's the average days-on-market for RENTAL listings here right now (not sales)? A rising rental-DOM trend means longer vacancies and softer asking-rent achievability than the comps imply.
- What's the recent tenant-quality profile in this submarket — average credit score on applications, eviction rate, late-payment / NSF rate, and stable-employment percentage? A property-management company in the area should have these aggregated.
- How much new for-sale + rental construction is in the pipeline within 1–3 miles? Heavy new supply typically softens prices + rents 12–24 months out; constrained supply supports both.
Investment metrics
- 1% rule
- 2.00% ✓
- Cap rate
- 16.93%
- Cash-on-cash
- 38.00%
- DSCR
- 2.69
- GRM
- 4.2
CMA / ARV
- ARV (median comp)
- $39,077
- List price
- $35,000
- Delta
- -10.43%
- Verdict
- UNDERPRICED
- Comps
- 5 within 1.0 mi
Show comp detail 2 sales within ~0.75 mi
| Address | Dist | Beds/Ba | Sqft | Sold | Price | $/sf | Match |
|---|---|---|---|---|---|---|---|
| 322 E Franklin St | 0.67mi | 1/1.0 | 560 (-5%) | 0mo | $53,000 | $95 | 61 |
| 729 S Randolph St | 0.61mi | 1/1.0 | 636 (+8%) | 9mo | $32,000 | $50 | 51 |
Match score weights: distance 35% · size 25% · config 20% · recency 20%. Top-matched comps best support the ARV.
Projected returns pro-forma
-3.0% appreciation · 3.0% rent growth · sell at horizon
- IRR
- 34.1%
- Equity multiple
- 2.44×
- Total profit
- $14,106
- Equity at exit
- $5,219
- IRR
- 41.0%
- Equity multiple
- 4.86×
- Total profit
- $37,780
- Equity at exit
- $3,026
Cash invested: $9,800 (down + closing). Projections, not guarantees.
Landlord ↔ Tenant lean methodology
- Overall (STATE)
- 43 Moderately Tenant-Leaning
- State Illinois
- 43 Moderately Tenant-Leaning · D+7
- County
- — inherits STATE
- City
- — inherits STATE
ZIP-level market 61455
- Home prices YoY
- -33.3%
- Active inventory
- 135
- Price-to-rent
- 4.2×
Monthly cashflow live
- Estimated rent
- $699 medium interval (Pro) →
- Mortgage (P&I)
- −$184
- Tax est. 1.5%
- −$44 /mo · $525/yr
- Insurance
- −$15
- HOA
- −$0
- Vacancy / Maint / Mgmt
- −$147
- Net cashflow
- $310
Break-even live
UW: 25.0% down · 7.5% · 30yr · 1.5% tax · 5.0% vac · 8.0% maint · 8.0% mgmt
Financing live
Cash to close
- Down payment
- $8,750
- Closing costs
- $1,050
- Reserves months
- —
- Total cash needed
- —
Loan-product check · same deal, 3 products live
Conventional
25% down · 7.5% · 30yr
- Down + closing
- —
- Monthly P&I
- —
- Monthly cashflow
- —
- DSCR
- —
- Eligible?
- —
Personal DTI + credit; lowest rate.
DSCR
20% down · 8.5% · 30yr
- Down + closing
- —
- Monthly P&I
- —
- Monthly cashflow
- —
- DSCR
- —
- Eligible?
- —
No personal income docs; deal must DSCR.
Hard money
10% down · 12.0% · 12mo
- Down + closing
- —
- Monthly P&I
- —
- Monthly cashflow
- —
- DSCR
- —
- Eligible?
- —
Short-term bridge; refi at stabilization.
Rent comps 1 comps
| Address | Beds | Baths | Sqft | Rent | $/sqft | DOM | Units | Dist |
|---|---|---|---|---|---|---|---|---|
| 303 S Dudley St Macomb, IL | 1.0 | 1.0 | 625 | $575 | $0.92 | 43d | 1 | 1.05mi |
Listing history 16 events
-
2026-06-19days on market $35,000 Active 37 DOM
-
2026-06-18days on market $35,000 Active 36 DOM
-
2026-06-17days on market $35,000 Active 35 DOM
-
2026-06-16days on market $35,000 Active 34 DOM
-
2026-06-15days on market $35,000 Active 33 DOM
-
2026-06-14days on market $35,000 Active 31 DOM
-
2026-06-12days on market $35,000 Active 30 DOM
-
2026-06-09days on market $35,000 Active 27 DOM
-
2026-06-08days on market $35,000 Active 26 DOM
-
2026-06-07days on market $35,000 Active 25 DOM
-
2026-06-04days on market $35,000 Active 21 DOM
-
2026-06-02days on market $35,000 Active 20 DOM
-
2026-06-01days on market $35,000 Active 19 DOM
-
2026-05-31days on market $35,000 Active 18 DOM
-
2026-05-31days on market $35,000 Active 17 DOM
-
2026-05-13$35,000 Active 230-char remark
ⓘ Source: listings_history table (triggers on properties + properties_extension) + one-shot
backfill from property_details.listing_events for pre-trigger history.
Climate risk First Street
- Flood 1/10 Low 0% chance over 30 yrs
- Wildfire 1/10 Low
- Heat 3/10 Moderate 7 d/yr ≥107°F today · 17 d/yr by 30 yrs out
- Wind 2/10 Low 0% chance of damaging wind over 30 yrs
- Air quality 2/10 Low 0 unhealthy d/yr today · 1 by 30 yrs out
Nearby sold comps map
Loading sold comps map…
Walkable amenities ~0.75 mi
Loading nearby amenities…
Taxation est. · year 1
- Rental income
- $8,388
- − Mortgage interest
- −$1,961
- − Property taxes
- −$525
- − Insurance
- −$175
- − Repairs & maintenance
- −$671
- − Management
- −$671
- − Depreciation
- −$1,018
- Taxable income
- $3,368
- Est. tax owed @ 24.0%
- −$808
- After-tax cash flow
- $2,916/yr
For passive investors: Depreciation is non-cash, so a rental often shows a tax loss while cash-flowing — sheltering income. Rental losses are passive: they offset passive income freely, and up to $25,000/yr can offset ordinary (W-2) income if you actively participate and your MAGI is under $100k (phasing out to $0 by $150k); unused losses carry forward. On sale, claimed depreciation is recaptured at up to 25%, and gains may owe capital-gains tax (a 1031 exchange can defer both). Figures are a year-1 estimate at your 24.0% rate — not tax advice; consult a CPA.
Condition & rehab AI · 11 photos
This home requires moderate renovations, primarily focusing on painting and updating the flooring. It has good curb appeal and a good foundation, making it a good investment opportunity.
Repairs flagged
- Major interior walls/paint — paint appears worn and needs repainting
- Major interior walls/paint — paint appears worn and needs repainting
Value-add opportunities
- Resale paint interior walls — Fresh paint can make a significant difference in the home's appearance and appeal
- Both install new flooring in kitchen and bathrooms — New flooring can improve the home's overall appearance and functionality
- Both install new lighting fixtures — New lighting can improve the home's ambiance and energy efficiency
Renovation cost estimate screening
| Repair item | Severity | Est. cost |
|---|---|---|
| interior walls/paint · paint appears worn and needs repainting | Major | $15,000–50,000 |
| interior walls/paint · paint appears worn and needs repainting | Major | $15,000–50,000 |
| Total estimated repair cost · 2 items | $30,000–100,000 |
Value-add ROI direction
- Resale paint interior walls — Fresh paint can make a significant difference in the home's appearance and appeal ↑
- Both install new flooring in kitchen and bathrooms — New flooring can improve the home's overall appearance and functionality ↑
- Both install new lighting fixtures — New lighting can improve the home's ambiance and energy efficiency ↑
ⓘ Cost ranges are severity-bucket heuristics (US national rule-of-thumb). Get contractor quotes + a written scope before underwriting a rehab budget.
Schools (NCES district)
- District
- Macomb CUSD 185
- NCES district ID
- 1723920
- Math proficiency
- 19% ▼ -7.00%
- Reading proficiency
- 26% ▼ -8.00%
- Median HH income
- $34,162
- Composite
- 18.45/100
- National rank
- #8927
- State rank
- #410 of 620 in IL
Livability — Macomb
- Score
- 70/100
- State rank
- #379
- US rank
- #7918
Category grades
Schools grade is shown separately in the Schools card above.
Census & demographics
- Census place
- Macomb, IL
- County
- McDonough County · 17,317 people
- City population
- 17,317
- Metro
- Macomb, IL
- Population (ZIP)
- 17,317
- Household income
- $48,679
- Rent vs Own
- Severe rent burden
- 1062.0
Population outlook (McDonough County) Hauer SSP2
- Today (2025)
- 33,242 people
- By 2030
- 33,318 · +0.2%
- By 2040
- 33,520 · +0.8%
- By 2050
- 33,630 · +1.2%
- By 2075
- 33,657 · +1.2%
- By 2100
- 33,127 · -0.3%
Race, ethnicity, and origin ACS 2023
- Neighborhood character
- Predominantly White (81%)
- Race & ethnicity
- White 81% Black 9% Two or more races 5% Hispanic / Latino 5% Asian 3%
- Common ancestry
- Romanian 3% Italian 3% Iranian 2%
- Foreign-born
- 4% · Canada, South Korea, China
- Languages at home
- 94% English-only · Spanish 2% Other Indo-European 1% Russian/Polish/Slavic 1%
Political lean MEDSL · McDonough
- 2024 margin
- R (+18.9) · D 39.7% · R 58.5% · Other 1.8%
- 2008→2024 swing
- -24.4pp toward R · 2008: 5.6pp · 2024: -18.9pp
- All cycles
- 2024: R+18.9 2020: R+16.6 2016: R+11.7 2012: R+1.5 2008: D+5.6
Not yet ingested
- Civics
- —
Market trends
- HPI YoY
- ▼ -70.20%
- Current HPI
- 140.4351
- Rent YoY
- —
- Metro
- Macomb, IL
- State GDP YoY
- ▲ 1.59%
- F500 in state
- 60
Industry mix (Fortune 500 HQ in IL)
| Industry | F500 HQs | Revenue |
|---|---|---|
| Insurance | 4 | $201B |
|
||
| Consumer Goods | 4 | $87B |
|
||
| Industrial Machinery | 3 | $64B |
|
||
| Healthcare | 2 | $55B |
|
||
| Retail / Pharmacy | 1 | $148B |
|
||
| Agriculture / Food | 1 | $86B |
|
||
Price history
1 event — show timeline
- 2026-05-13 Listed $35,000 RMLSA as Distributed by MLS Grid
Cash-flow waterfall
monthlySold comps — $/sqft
last 12 mo · ≤1 miLoading sold comps…