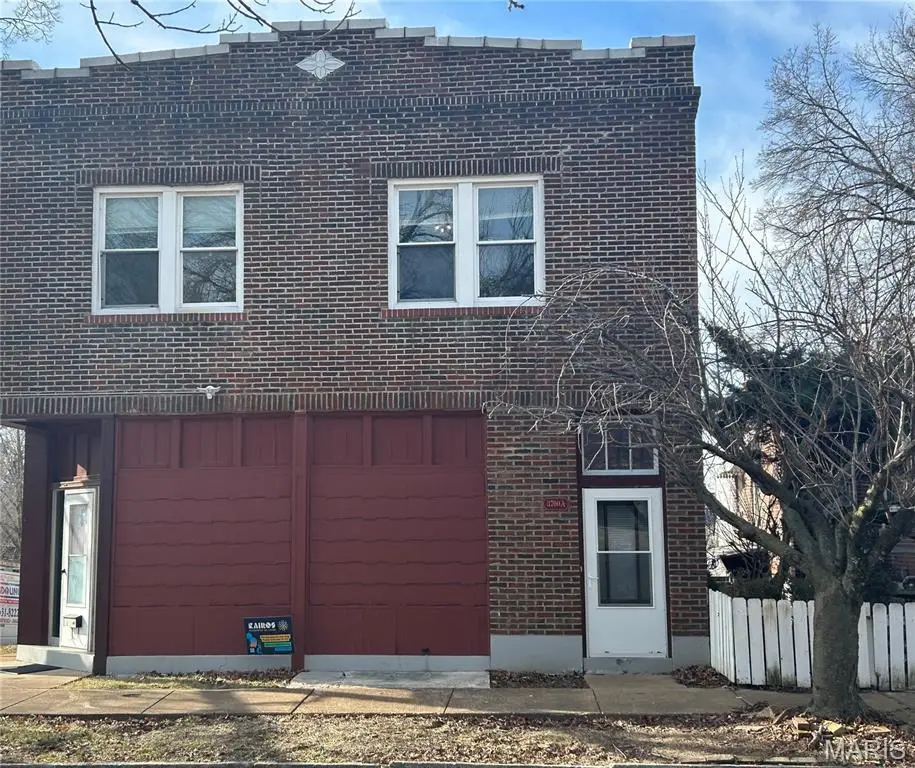
 Duplex
3700 Osceola St · St. Louis, MO
Flood risk 1/10 · Minimal
- FEMA flood zone
- X (unshaded)
- Chance of flooding over 30 yrs
- 0.0%
- Est. flood insurance / yr
- $473 – $860
Fire risk 1/10 · Minimal
- Est. fire insurance / yr
- $1,054 – $1,958
Heat risk 5/10 · Moderate
- Hot days now (above 108°F)
- 7 days/yr
- Hot days in 30 yrs
- 21 days/yr
Wind risk 2/10 · Minimal
- Chance of severe wind over 30 yrs
- 1.0%
Air-quality risk 3/10 · Minor
- Unhealthy air days now
- 3 days/yr
- Unhealthy air days in 30 yrs
- 4 days/yr
Risk factors via First Street. Map © Google.
Why this score? — see what drove the C grade
The composite is a weighted blend of 9 inputs, each scored 0–100. Each bar is that input's sub-score; the figure is the points it added to the 100-point composite (weight × sub-score).
- Cash flow +25.1/30.0
- DSCR +8.2/10.0
- ARV discount +7.4/15.0
- 1% rule +5.5/10.0
- Rent growth +3.2/5.0
- Livability +2.5/5.0
- Condition / age +2.5/5.0
- Schools +1.2/10.0
- Appreciation +0.0/10.0
$195,000
🖨 Deal sheet 📄 Offer letter ✓ Due diligence
Multi-family units
County records classify this as Multi-Family (2-4 Unit). Listing-text estimate: 2 units. confirmed
Listing remarks MLS
This beautiful duplex in St. Louis City is ideal for an owner-occupant or an investment opportunity. Both units are currently rented with long-term tenants in place. Each unit offers two bedrooms and one full bathroom, featuring original hardwood floors that preserve the home’s historic charm. Outside, the property includes off-street parking pads and a fenced, spacious backyard—perfect for added privacy and outdoor enjoyment. Don’t miss your chance to see all the beautiful updates this home has to offer. Showings available only with an accepted contract.
Key facts
- 3,750 sq ft lot
- Built 1925
- Listed 181 days
Neighborhood map
What this means for you Summary
Snapshot
- This is a 2 × 2-bed/1.0-bath units multifamily listed at $195k.
Deal economics
- At list price, monthly cash flow is $431 ($5k/yr) — positive. Per door: $215/mo.
- The deal already cash-flows at list — no discount required.
- Meets the 1% rule at list price ($2k rent vs $195k).
- Recommended offer: $172k (12.0% below list) — sets the bar for market timing.
- Cap rate 8.9% vs local median 5.0% in St. Louis — top-decile yield for the area; either an underpriced asset or a hidden risk that comps aren't pricing in. Stress-test before assuming the spread holds.
Location & tenants
- Location reads: area grade C — affects rentability + tenant quality, not the cash-flow math above.
- St. Louis City (urban): math 10% / reading 18% proficiency, ranked #312 of 324 in MO (top 96%) — low school quality limits family demand, transient renter base, plan for 1-2y turnover; 80% free/reduced lunch — lower-income household profile, screen leases tightly.
- Market conditions: Rents rising (+2.6%/yr); 255 active listings in the ZIP; 18 comparable units currently listed for rent nearby; rentals at typical pace (median 20d on market — plan ~3-4 weeks tenant-placement turnaround); 294 units permitted in St. Louis city in 2024 (227 in 5+ unit buildings).
- This rent runs 40% of the median local income ($61k/yr) — at the standard rent-burdened threshold; future hikes will face affordability resistance.
Forward outlook
- Local home prices are declining (-3.0%/yr); year-one equity from $1k of loan paydown is wiped out by about $6k of value loss. Plan a longer hold.
- St. Louis County population projected to shrink 6% by 2050 — rents likely to lag national; underwrite the cash flow, not the appreciation.
Negotiation context
- It's been on market 182 days — a 12% lower offer ($172k) is reasonable based on typical stale-listing flexibility.
- 2 sale attempts since 12y ago with the ask held roughly flat each time — persistent listings suggest the price (not the market) is what's stuck; bring a comps-based counter.
- Current owner paid $50k; list at $195k implies a 290% gain — meaningful room to come down on a strong offer.
Risks & watch-outs
- Watch-outs: built in 1925 — expect roof / HVAC / electrical / plumbing capex.
- Climate carrying-cost: extreme-heat days projected 7→21/yr by 2055 (HVAC capex compounding) — expect insurance premiums to compound above CPI over the hold.
Questions for the listing agent
- It's been on market 182 days. Have you received any prior offers? Is the seller open to a 12% concession, seller financing, or rate buy-down credit?
- Can we see the unit-by-unit rent roll, current vacancy, and any below-market leases? What's the average tenancy length?
- What capital expenditures (roof, boiler, parking lot, exteriors) have been made in the last 5 years, and what's planned in the next 2?
- Built in 1925 — when were the roof, HVAC, electrical panel, plumbing, and water heater last replaced?
- Why hasn't it sold? Are there any deal-killer items the seller is aware of (foundation, flood, title, zoning, code violations)?
- Is there a deadline driving the sale (1031 exchange, divorce, estate, relocation)? That informs how much negotiation room exists.
- What's the average days-on-market for RENTAL listings here right now (not sales)? A rising rental-DOM trend means longer vacancies and softer asking-rent achievability than the comps imply.
- What's the recent tenant-quality profile in this submarket — average credit score on applications, eviction rate, late-payment / NSF rate, and stable-employment percentage? A property-management company in the area should have these aggregated.
- How much new apartment / multifamily construction is in the pipeline within 1–3 miles? Heavy new supply (>2% of stock underway) typically softens rents 12–24 months out; light construction supports rent growth.
Investment metrics
- 1% rule
- 1.05% ✓
- Cap rate
- 8.94%
- Cash-on-cash
- 9.46%
- DSCR
- 1.42
- GRM
- 7.9
CMA / ARV
- ARV (median comp)
- $194,687
- List price
- $195,000
- Delta
- 0.16%
- Verdict
- FAIR
- Comps
- 20 within 1.0 mi
Show comp detail 12 sales within ~0.75 mi
| Address | Dist | Beds/Ba | Sqft | Sold | Price | $/sf | Match |
|---|---|---|---|---|---|---|---|
| 4331 S 38th St | 0.12mi | 4/4.0 | 2,088 (-1%) | 12mo | $180,000 | $86 | 76 |
| 3868 Meramec St | 0.32mi | 4/2.0 | 2,224 (+6%) | 8mo | $175,000 | $79 | 69 |
| 3442 Gasconade St | 0.33mi | 5/2.5 (+1) | 2,184 (+4%) | 5mo | $119,990 | $55 | 66 |
| 5042 Louisiana Ave | 0.62mi | 4/2.0 | 2,196 (+5%) | 8mo | $179,000 | $82 | 57 |
| 5044 Louisiana Ave | 0.62mi | 4/2.0 | 2,196 (+5%) | 8mo | $179,000 | $82 | 57 |
| 4676 S Grand Blvd | 0.34mi | 4/2.0 | 2,400 (+14%) | 12mo | $99,900 | $42 | 50 |
| 4536 S Compton | 0.56mi | 4/2.0 | 2,304 (+10%) | 12mo | $184,900 | $80 | 48 |
| 4443 Minnesota Ave | 0.59mi | 3/2.0 (-1) | 2,236 (+6%) | 12mo | $139,000 | $62 | 46 |
| 3237 Delor St | 0.72mi | 5/2.0 (+1) | 2,294 (+9%) | 6mo | $185,000 | $81 | 41 |
| 3225 Delor St | 0.73mi | 5/2.0 (+1) | 2,294 (+9%) | 6mo | $229,900 | $100 | 40 |
| 3743 Louisiana Ave | 0.73mi | 4/2.0 | 2,356 (+12%) | 7mo | $209,900 | $89 | 40 |
| 3750 Dunnica Ave | 0.55mi | 3/2.0 (-1) | 1,804 (-14%) | 8mo | $145,000 | $80 | 39 |
Match score weights: distance 35% · size 25% · config 20% · recency 20%. Top-matched comps best support the ARV.
Projected returns pro-forma
-3.0% appreciation · 2.62% rent growth · sell at horizon
- IRR
- -2.5%
- Equity multiple
- 0.91×
- Total profit
- $-5,023
- Equity at exit
- $29,075
- IRR
- 6.8%
- Equity multiple
- 1.50×
- Total profit
- $27,486
- Equity at exit
- $16,860
Cash invested: $54,600 (down + closing). Projections, not guarantees.
Landlord ↔ Tenant lean methodology
- Overall (STATE)
- 81 Strongly Landlord-Friendly
- State Missouri
- 81 Strongly Landlord-Friendly · R+10
- County
- — inherits STATE
- City
- — inherits STATE
ZIP-level market 63116
- Rents YoY
- 2.6%
- Active inventory
- 255
- Price-to-rent
- 15.9×
Monthly cashflow live
- Estimated rent
- $2,049 high interval (Pro) →
- Mortgage (P&I)
- −$1,023
- Tax from tax record
- −$84 /mo · $1,012/yr
- Insurance
- −$81
- HOA
- −$0
- Vacancy / Maint / Mgmt
- −$430
- Net cashflow
- $431
Break-even live
2-unit breakdown (identical units grouped — click to expand)
| Units | Beds | Baths | Est. rent |
|---|---|---|---|
| 2× units | 2 | 1 | $2,050 |
| #1 | 2 | 1 | $1,025 |
| #2 | 2 | 1 | $1,025 |
| Total (2 units) | $2,049 | ||
UW: 25.0% down · 7.5% · 30yr · 1.5% tax · 5.0% vac · 8.0% maint · 8.0% mgmt
Financing live
Cash to close
- Down payment
- $48,750
- Closing costs
- $5,850
- Reserves months
- —
- Total cash needed
- —
Loan-product check · same deal, 3 products live
Conventional
25% down · 7.5% · 30yr
- Down + closing
- —
- Monthly P&I
- —
- Monthly cashflow
- —
- DSCR
- —
- Eligible?
- —
Personal DTI + credit; lowest rate.
DSCR
20% down · 8.5% · 30yr
- Down + closing
- —
- Monthly P&I
- —
- Monthly cashflow
- —
- DSCR
- —
- Eligible?
- —
No personal income docs; deal must DSCR.
Hard money
10% down · 12.0% · 12mo
- Down + closing
- —
- Monthly P&I
- —
- Monthly cashflow
- —
- DSCR
- —
- Eligible?
- —
Short-term bridge; refi at stabilization.
Rent comps 18 comps
| Address | Beds | Baths | Sqft | Rent | $/sqft | DOM | Units | Dist |
|---|---|---|---|---|---|---|---|---|
| 4222 S 38th St Unit 4222 St. Louis, MO | 3.0 | 2.0 | 1836 | $1,400 | $0.76 | 20d | 1 | 0.14mi |
| 3637 Meramec St Saint Louis, MO | 3.0 | 1.5 | 1632 | $1,925 | $1.18 | 17d | 1 | 0.18mi |
| 4145 S Compton Ave Saint Louis, MO | 3.0 | 2.0 | 1656 | $1,520 | $0.92 | 43d | 1 | 0.44mi |
| 4135 S Compton Ave Saint Louis, MO | 3.0 | 2.0 | 2104 | $1,600 | $0.76 | 43d | 1 | 0.45mi |
| 3146 Keokuk St Saint Louis, MO | 3.0 | 1.0 | 1528 | $1,500 | $0.98 | 23d | 1 | 0.66mi |
| 4450 Pennsylvania Ave Saint Louis, MO | 3.0 | 1.0 | 1500 | $1,100 | $0.73 | 4d | 1 | 0.68mi |
| 3131 Keokuk St #3131 Saint Louis, MO | 3.0 | 2.0 | 1500 | $1,475 | $0.98 | 14d | 1 | 0.69mi |
| 4312 Oregon Ave Saint Louis, MO | 4.0 | 2.0 | 2032 | $2,000 | $0.98 | 1d | 1 | 0.76mi |
| 3526 S Spring Ave Saint Louis, MO | 4.0 | 2.0 | 2244 | $2,877 | $1.28 | 43d | 1 | 0.92mi |
| 3807 Potomac St Saint Louis, MO | 3.0 | 1.0 | 2588 | $1,300 | $0.50 | 7d | 1 | 1.01mi |
| 3807 Potomac St Saint Louis, MO | 3.0 | 1.0 | 2588 | $1,100 | $0.43 | 43d | 1 | 1.01mi |
| 3458 Giles Ave Saint Louis, MO | 3.0 | 2.5 | 2204 | $2,400 | $1.09 | 7d | 1 | 1.02mi |
| 3540 Michigan Ave Saint Louis, MO | 4.0 | 2.0 | 1758 | $1,800 | $1.02 | 1d | 1 | 1.02mi |
| 3411 Cherokee St St. Louis, MO | 4.0 | 2.0 | 1568 | $1,850 | $1.18 | 43d | 1 | 1.15mi |
| 3908 McDonald Ave Saint Louis, MO | 3.0 | 2.0 | 1927 | $2,500 | $1.30 | 4d | 1 | 1.17mi |
| 3510 California Ave Saint Louis, MO | 3.0 | 2.0 | 1800 | $1,200 | $0.67 | 43d | 1 | 1.25mi |
| 3628 Wyoming St Unit 2F St. Louis, MO | 4.0 | 1.0 | 1700 | $1,950 | $1.15 | 43d | 1 | 1.33mi |
| 3429 Ohio Ave Saint Louis, MO | 3.0 | 3.0 | 1938 | $2,250 | $1.16 | 16d | 1 | 1.39mi |
Listing history 19 events
-
2026-06-18days on market $195,000 Active 182 DOM
-
2026-06-17days on market $195,000 Active 181 DOM
-
2026-06-16days on market $195,000 Active 180 DOM
-
2026-06-15days on market $195,000 Active 179 DOM
-
2026-06-13days on market $195,000 Active 177 DOM
-
2026-06-09days on market $195,000 Active 173 DOM
-
2026-06-08days on market $195,000 Active 172 DOM
-
2026-06-08days on market $195,000 Active 171 DOM
-
2026-06-05days on market $195,000 Active 168 DOM
-
2026-06-03days on market $195,000 Active 167 DOM
-
2026-06-02days on market $195,000 Active 166 DOM
-
2026-06-01days on market $195,000 Active 165 DOM
-
2026-05-31days on market $195,000 Active 164 DOM
-
2025-12-19$195,000 Active 581-char remark
Show marketing remark (581 chars)
This beautiful duplex in St. Louis City is ideal for an owner-occupant or an investment opportunity. Both units are currently rented with long-term tenants in place. Each unit offers two bedrooms and one full bathroom, featuring original hardwood floors that preserve the home’s historic charm. Outside, the property includes off-street parking pads and a fenced, spacious backyard—perfect for added privacy and outdoor enjoyment. Don’t miss your chance to see all the beautiful updates this home has to offer. Showings available only with an accepted contract.
-
2025-12-18historical $195,000 581-char remark
Show marketing remark (581 chars)
This beautiful duplex in St. Louis City is ideal for an owner-occupant or an investment opportunity. Both units are currently rented with long-term tenants in place. Each unit offers two bedrooms and one full bathroom, featuring original hardwood floors that preserve the home’s historic charm. Outside, the property includes off-street parking pads and a fenced, spacious backyard—perfect for added privacy and outdoor enjoyment. Don’t miss your chance to see all the beautiful updates this home has to offer. Showings available only with an accepted contract.
-
2014-09-17soldstatus $50,000
-
2014-09-12soldstatus 885-char remark
Show marketing remark (885 chars)
Clear occupancy inspections on both units. Ready to go at under $31 per square foot! Well maintained two-family building on large fenced corner lot, with additional parking on the rear pad. Both units have updated kitchens and baths, some glass block windows, ceiling fans, nice closet space, and inside entrances to the laundry hookup in the basement. 1st floor unit has central heat and air; 2nd floor unit has boiler heat and window AC unit. 1st floor unit comes with a gas stove, dishwasher and refrigerator. The 2nd floor unit comes with an electric stove, built-in microwave and refrigerator. The wall between the living and dining rooms on the 2nd floor unit was removed to create one huge room, and there is access to a deck off the kitchen and bedroom. Convenient location, great value and condition for this price! This building is one you really don't want to miss!
-
2014-03-12$59,500 885-char remark
Show marketing remark (885 chars)
Clear occupancy inspections on both units. Ready to go at under $31 per square foot! Well maintained two-family building on large fenced corner lot, with additional parking on the rear pad. Both units have updated kitchens and baths, some glass block windows, ceiling fans, nice closet space, and inside entrances to the laundry hookup in the basement. 1st floor unit has central heat and air; 2nd floor unit has boiler heat and window AC unit. 1st floor unit comes with a gas stove, dishwasher and refrigerator. The 2nd floor unit comes with an electric stove, built-in microwave and refrigerator. The wall between the living and dining rooms on the 2nd floor unit was removed to create one huge room, and there is access to a deck off the kitchen and bedroom. Convenient location, great value and condition for this price! This building is one you really don't want to miss!
-
1991-05-15soldstatus
ⓘ Source: listings_history table (triggers on properties + properties_extension) + one-shot
backfill from property_details.listing_events for pre-trigger history.
Tax reassessment forecast MO · Resets to sale price
- Current annual tax
- $1,012 · $84/mo
- Projected year-2 tax
- $1,892 · $158/mo
- Expected delta
- +$880/yr (+$73/mo · 87.0%)
ⓘ Screening estimate from a state-policy table — verify with the county assessor before closing.
Climate risk First Street
- Flood 1/10 Low FEMA zone X (unshaded) · 0% chance over 30 yrs
- Wildfire 1/10 Low
- Heat 5/10 Major 7 d/yr ≥108°F today · 21 d/yr by 30 yrs out
- Wind 2/10 Low 100% chance of damaging wind over 30 yrs
- Air quality 3/10 Moderate 3 unhealthy d/yr today · 4 by 30 yrs out
Nearby sold comps map
Loading sold comps map…
Walkable amenities ~0.75 mi
Loading nearby amenities…
Taxation est. · year 1
- Rental income
- $24,588
- − Mortgage interest
- −$10,923
- − Property taxes
- −$1,012
- − Insurance
- −$975
- − Repairs & maintenance
- −$1,967
- − Management
- −$1,967
- − Depreciation
- −$5,673
- Taxable income
- $2,072
- Est. tax owed @ 24.0%
- −$497
- After-tax cash flow
- $4,670/yr
For passive investors: Depreciation is non-cash, so a rental often shows a tax loss while cash-flowing — sheltering income. Rental losses are passive: they offset passive income freely, and up to $25,000/yr can offset ordinary (W-2) income if you actively participate and your MAGI is under $100k (phasing out to $0 by $150k); unused losses carry forward. On sale, claimed depreciation is recaptured at up to 25%, and gains may owe capital-gains tax (a 1031 exchange can defer both). Figures are a year-1 estimate at your 24.0% rate — not tax advice; consult a CPA.
Schools (NCES district)
- District
- St. Louis City
- NCES district ID
- 2929280
- Math proficiency
- 10% ▼ -6.00%
- Reading proficiency
- 18% ▼ -3.00%
- Median HH income
- $35,685
- Composite
- 11.54/100
- National rank
- #9699
- State rank
- #312 of 324 in MO
Livability — St. Louis
No livability data for this city. (Only ~50 U.S. cities are tracked.)
Census & demographics
- Census place
- St. Louis, MO
- County
- Saint Louis City · 254,015 people
- City population
- 283,259
- Metro
- St. Louis, MO-IL
- Population (ZIP)
- 42,170
- Household income
- $61,433
- Rent vs Own
- Severe rent burden
- 1923.0
Population outlook (St. Louis County) Hauer SSP2
- Today (2025)
- 315,737 people
- By 2030
- 313,865 · -0.6%
- By 2040
- 305,439 · -3.3%
- By 2050
- 296,529 · -6.1%
- By 2075
- 271,028 · -14.2%
- By 2100
- 255,359 · -19.1%
Race, ethnicity, and origin ACS 2023
- Neighborhood character
- Diverse neighborhood (Simpson 0.63)
- Race & ethnicity
- White 54% Black 27% Hispanic / Latino 10% Two or more races 8% Asian 5%
- Hispanic origin (detail)
- Mexican 7%
- Common ancestry
- Lithuanian 4% Romanian 2% Italian 2%
- Foreign-born
- 11% · Canada, Vietnam, Philippines
- Languages at home
- 85% English-only · Spanish 6% Vietnamese 2% Arabic 2%
Political lean MEDSL · St. Louis
- 2024 margin
- Solid D (+64.7) · D 81.4% · R 16.7% · Other 2.0%
- 2008→2024 swing
- -3.5pp toward R · 2008: 68.2pp · 2024: 64.7pp
- All cycles
- 2024: D+64.7 2020: D+66.2 2016: D+63.7 2012: D+66.6 2008: D+68.2
Not yet ingested
- Civics
- —
Market trends
- HPI YoY
- ▼ -271.19%
- Current HPI
- 215.7108
- Rent YoY
- ▲ 2.62%
- Metro
- St. Louis, MO-IL
- State GDP YoY
- ▲ 1.84%
- F500 in state
- 20
Industry mix (Fortune 500 HQ in MO)
| Industry | F500 HQs | Revenue |
|---|---|---|
| Healthcare | 1 | $163B |
|
||
| Insurance | 1 | $21B |
|
||
| Industrial Technology | 1 | $17B |
|
||
| Retail | 1 | $16B |
|
||
| Industrial Distribution | 1 | $10B |
|
||
| Utilities | 1 | $9B |
|
||
Price history
+227.7% since first listed6 events — show timeline
- 2025-12-19 Listed $195,000 MARIS as Distributed by MLS Grid
- 2025-12-18 Coming Soon $195,000 MARIS as Distributed by MLS Grid
- 2014-09-17 Sold (Public Records) $50,000 Public Records
- 2014-09-12 Sold (MLS) — MARIS as Distributed by MLS Grid
- 2014-03-12 Listed $59,500 MARIS as Distributed by MLS Grid
- 1991-05-15 Sold (Public Records) — Public Records
Property tax history
+3.8%/yrLatest (2024): $1,012 · +5.0% YoY. Source: county tax records.
Cash-flow waterfall
monthlySold comps — $/sqft
last 12 mo · ≤1 miLoading sold comps…