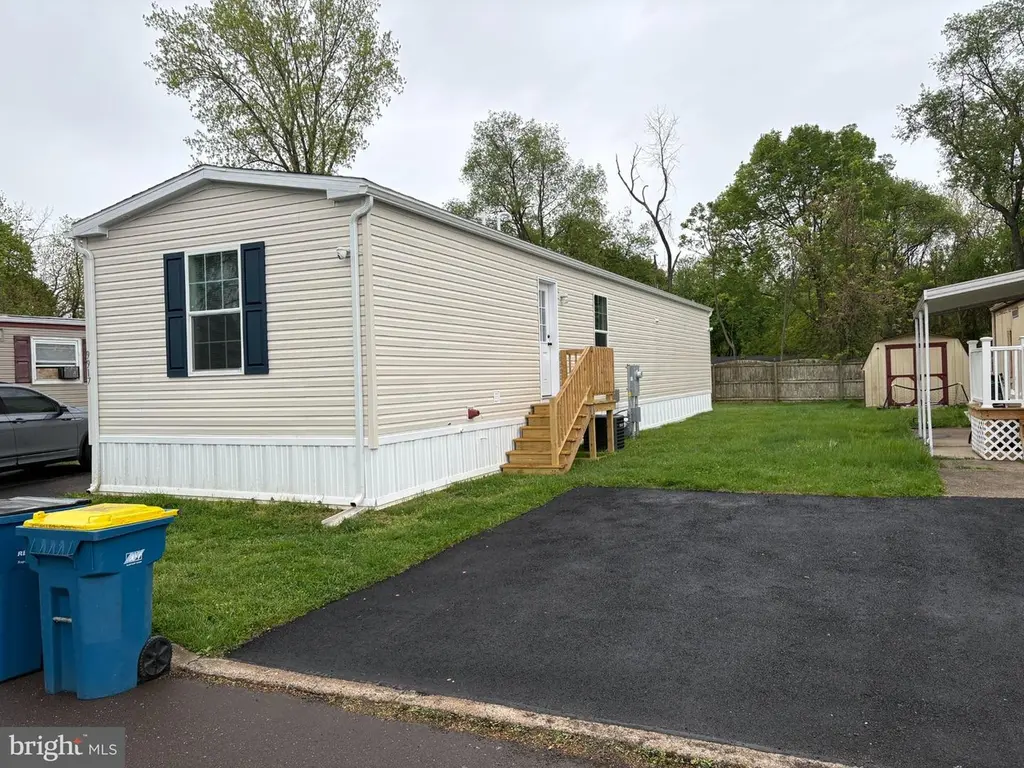
9917 Lindley Dr · Falls, PA
Flood risk 1/10 · Minimal
- FEMA flood zone
- X (unshaded)
- Chance of flooding over 30 yrs
- 0.0%
- Est. flood insurance / yr
- $507 – $1,088
Fire risk 1/10 · Minimal
- Est. fire insurance / yr
- $511 – $949
Heat risk 6/10 · Moderate
- Hot days now (above 103°F)
- 7 days/yr
- Hot days in 30 yrs
- 15 days/yr
Wind risk 6/10 · Moderate
- Chance of severe wind over 30 yrs
- 27.0%
Air-quality risk 5/10 · Moderate
- Unhealthy air days now
- 6 days/yr
- Unhealthy air days in 30 yrs
- 8 days/yr
Risk factors via First Street. Map © Google.
Why this score? — see what drove the C+ grade
The composite is a weighted blend of 9 inputs, each scored 0–100. Each bar is that input's sub-score; the figure is the points it added to the 100-point composite (weight × sub-score).
- Cash flow +30.0/30.0
- 1% rule +10.0/10.0
- DSCR +10.0/10.0
- Schools +5.2/10.0
- Rent growth +3.3/5.0
- Livability +2.5/5.0
- Condition / age +2.5/5.0
- ARV discount +0.0/15.0
- Appreciation +0.0/10.0
$160,000
🖨 Deal sheet 📄 Offer letter ✓ Due diligence
Listing remarks MLS
Discover the charm of modern living in this newly constructed Champion Advantage Lancaster mobile home, nestled in the vibrant Pennwood Crossing community. Completed in 2025, this meticulously designed single-wide home boasts 3 spacious bedrooms and 2 full bathrooms, offering a perfect blend of comfort and style. Step inside to experience the excellent condition of this modular home, featuring a well-thought-out layout that maximizes space and functionality. The main floor laundry adds convenience to your daily routine, while the inviting patio provides a serene outdoor space for relaxation or entertaining. Pennwood Crossing is more than just a place to live; it's a thriving community that fosters connection and engagement. Enjoy access to a beautifully fenced community pool, perfect for those warm summer days. The neighborhood is surrounded by lush parks, offering ample opportunities for outdoor activities, picnics, and leisurely strolls. With 24-hour security features, including motion detectors and exterior cameras, peace of mind is a priority here. This home is not just a residence; it's a lifestyle choice that embraces community spirit and modern conveniences. Don't miss your chance to be part of this exceptional neighborhood-schedule a viewing today and envision your future in this delightful home! Great highway access along with SEPTA regional rail are an added plus for commuters. State of the art Slomin Security system is offered if the buyer will accept transfer of the contract along with financial terms. Any and all interested buyers will need to be approved by the Property Mgt. Co. Go to ABC Homes/Pennwood Crossing for the application.
Key facts
- Newly constructed
- Modern living
- Inviting patio
Tags
Neighborhood map
What this means for you Summary
Snapshot
- This is a 3-bed/2.0-bath manufactured listed at $160k.
Deal economics
- At list price, monthly cash flow is $1k ($14k/yr) — positive.
- The deal already cash-flows at list — no discount required.
- Meets the 1% rule at list price ($3k rent vs $160k).
- Recommended offer: $155k (3.0% below list) — sets the bar for market timing.
Location & tenants
- Location reads: area grade C — affects rentability + tenant quality, not the cash-flow math above.
- Pennsbury SD (suburban): math 46% / reading 69% proficiency, ranked #67 of 539 in PA (top 12%) — acceptable for families but not a draw, mixed tenant base, ~2y average lease; only 15% free/reduced lunch — higher-income household profile.
- Market conditions: Rents rising (+3.1%/yr); 168 active listings in the ZIP; 3 comparable units currently listed for rent nearby; rentals leasing fast (median 2d on market — plan ~1-2 weeks tenant-placement turnaround); high-income renter base; 663 units permitted in Bucks County in 2024 (106 in 5+ unit buildings).
Forward outlook
- Local home prices are declining (-3.0%/yr); year-one equity from $1k of loan paydown is wiped out by about $5k of value loss. Plan a longer hold.
- Bucks County population projected to shrink 7% by 2050 — rents likely to lag national; underwrite the cash flow, not the appreciation.
- At projected returns (-3.0% appreciation + 3.1% rent growth), your $45k cash investment doubles in ~4 years — after that, you're playing with house money.
Negotiation context
- It's been on market 60 days — a 3% lower offer ($155k) is reasonable based on typical stale-listing flexibility.
Risks & watch-outs
- Climate carrying-cost: major wind risk, 27% chance of damaging wind over 30y; extreme-heat days projected 7→15/yr by 2055 (HVAC capex compounding) — expect insurance premiums to compound above CPI over the hold.
Questions for the listing agent
- It's been on market 60 days. Have you received any prior offers? Is the seller open to a 3% concession, seller financing, or rate buy-down credit?
- Is there a deadline driving the sale (1031 exchange, divorce, estate, relocation)? That informs how much negotiation room exists.
- What's the average days-on-market for RENTAL listings here right now (not sales)? A rising rental-DOM trend means longer vacancies and softer asking-rent achievability than the comps imply.
- What's the recent tenant-quality profile in this submarket — average credit score on applications, eviction rate, late-payment / NSF rate, and stable-employment percentage? A property-management company in the area should have these aggregated.
- How much new for-sale + rental construction is in the pipeline within 1–3 miles? Heavy new supply typically softens prices + rents 12–24 months out; constrained supply supports both.
Investment metrics
- 1% rule
- 1.75% ✓
- Cap rate
- 15.13%
- Cash-on-cash
- 31.57%
- DSCR
- 2.40
- GRM
- 4.8
CMA / ARV
- ARV (median comp)
- $109,347
- List price
- $160,000
- Delta
- 46.32%
- Verdict
- OVERPRICED
- Comps
- 20 within 1.0 mi
Show comp detail 2 sales within ~0.75 mi
| Address | Dist | Beds/Ba | Sqft | Sold | Price | $/sf | Match |
|---|---|---|---|---|---|---|---|
| 1047 Aldrich Dr | 0.39mi | 3/2.0 | 924 (-8%) | 4mo | $130,000 | $141 | 66 |
| 1445 Old Bristol Pike #71 | 0.14mi | 2/1.0 (-1) | 900 (-10%) | 7mo | $59,900 | $67 | 61 |
Match score weights: distance 35% · size 25% · config 20% · recency 20%. Top-matched comps best support the ARV.
Projected returns pro-forma
-3.0% appreciation · 3.12% rent growth · sell at horizon
- IRR
- 26.6%
- Equity multiple
- 2.10×
- Total profit
- $49,472
- Equity at exit
- $23,857
- IRR
- 34.3%
- Equity multiple
- 4.15×
- Total profit
- $141,108
- Equity at exit
- $13,834
Cash invested: $44,800 (down + closing). Projections, not guarantees.
Landlord ↔ Tenant lean methodology
- Overall (STATE)
- 62 Landlord-Friendly
- State Pennsylvania
- 62 Landlord-Friendly · EVEN
- County
- — inherits STATE
- City
- — inherits STATE
ZIP-level market 19067
- Rents YoY
- 3.1%
- Active inventory
- 168
- Price-to-rent
- 4.8×
Monthly cashflow live
- Estimated rent
- $2,795 medium interval (Pro) →
- Mortgage (P&I)
- −$839
- Tax from tax record
- −$123 /mo · $1,481/yr
- Insurance
- −$67
- HOA
- −$0
- Vacancy / Maint / Mgmt
- −$587
- Net cashflow
- $1,179
Break-even live
UW: 25.0% down · 7.5% · 30yr · 1.5% tax · 5.0% vac · 8.0% maint · 8.0% mgmt
Financing live
Cash to close
- Down payment
- $40,000
- Closing costs
- $4,800
- Reserves months
- —
- Total cash needed
- —
Loan-product check · same deal, 3 products live
Conventional
25% down · 7.5% · 30yr
- Down + closing
- —
- Monthly P&I
- —
- Monthly cashflow
- —
- DSCR
- —
- Eligible?
- —
Personal DTI + credit; lowest rate.
DSCR
20% down · 8.5% · 30yr
- Down + closing
- —
- Monthly P&I
- —
- Monthly cashflow
- —
- DSCR
- —
- Eligible?
- —
No personal income docs; deal must DSCR.
Hard money
10% down · 12.0% · 12mo
- Down + closing
- —
- Monthly P&I
- —
- Monthly cashflow
- —
- DSCR
- —
- Eligible?
- —
Short-term bridge; refi at stabilization.
Rent comps 3 comps
| Address | Beds | Baths | Sqft | Rent | $/sqft | DOM | Units | Dist |
|---|---|---|---|---|---|---|---|---|
| 5 Nickelhill Ln Levittown, PA | 4.0 | 2.0 | 1200 | $3,000 | $2.50 | 2d | 1 | 1.03mi |
| 5 Nickelhill Ln Levittown, PA | 4.0 | 2.0 | 1200 | $2,850 | $2.38 | 10d | 1 | 1.03mi |
| 9071 Mill Creek Rd Levittown, PA | 1.0–2.0 | 1.0 | 917 | $2,013 | $2.19 | 2d | 8 | 1.33mi |
Listing history 15 events
-
2026-06-18days on market $160,000 Active 60 DOM
-
2026-06-17days on market $160,000 Active 59 DOM
-
2026-06-16days on market $160,000 Active 58 DOM
-
2026-06-15days on market $160,000 Active 57 DOM
-
2026-06-13days on market $160,000 Active 55 DOM
-
2026-06-13days on market $160,000 Active 54 DOM
-
2026-06-09days on market $160,000 Active 51 DOM
-
2026-06-08days on market $160,000 Active 50 DOM
-
2026-06-07days on market $160,000 Active 49 DOM
-
2026-06-04days on market $160,000 Active 46 DOM
-
2026-06-03days on market $160,000 Active 45 DOM
-
2026-06-02days on market $160,000 Active 44 DOM
-
2026-06-01days on market $160,000 Active 43 DOM
-
2026-05-31days on market $160,000 Active 42 DOM
-
2026-04-19$160,000 Active 1675-char remark
Show marketing remark (1675 chars)
Discover the charm of modern living in this newly constructed Champion Advantage Lancaster mobile home, nestled in the vibrant Pennwood Crossing community. Completed in 2025, this meticulously designed single-wide home boasts 3 spacious bedrooms and 2 full bathrooms, offering a perfect blend of comfort and style. Step inside to experience the excellent condition of this modular home, featuring a well-thought-out layout that maximizes space and functionality. The main floor laundry adds convenience to your daily routine, while the inviting patio provides a serene outdoor space for relaxation or entertaining. Pennwood Crossing is more than just a place to live; it's a thriving community that fosters connection and engagement. Enjoy access to a beautifully fenced community pool, perfect for those warm summer days. The neighborhood is surrounded by lush parks, offering ample opportunities for outdoor activities, picnics, and leisurely strolls. With 24-hour security features, including motion detectors and exterior cameras, peace of mind is a priority here. This home is not just a residence; it's a lifestyle choice that embraces community spirit and modern conveniences. Don't miss your chance to be part of this exceptional neighborhood-schedule a viewing today and envision your future in this delightful home! Great highway access along with SEPTA regional rail are an added plus for commuters. State of the art Slomin Security system is offered if the buyer will accept transfer of the contract along with financial terms. Any and all interested buyers will need to be approved by the Property Mgt. Co. Go to ABC Homes/Pennwood Crossing for the application.
ⓘ Source: listings_history table (triggers on properties + properties_extension) + one-shot
backfill from property_details.listing_events for pre-trigger history.
Tax reassessment forecast PA · Partial reset (capped growth)
- Current annual tax
- $1,481 · $123/mo
- Projected year-2 tax
- $2,005 · $167/mo
- Expected delta
- +$523/yr (+$44/mo · 35.3%)
ⓘ Screening estimate from a state-policy table — verify with the county assessor before closing.
Climate risk First Street
- Flood 1/10 Low FEMA zone X (unshaded) · 0% chance over 30 yrs
- Wildfire 1/10 Low
- Heat 6/10 Major 7 d/yr ≥103°F today · 15 d/yr by 30 yrs out
- Wind 6/10 Major 27% chance of damaging wind over 30 yrs
- Air quality 5/10 Major 6 unhealthy d/yr today · 8 by 30 yrs out
Nearby sold comps map
Loading sold comps map…
Walkable amenities ~0.75 mi
Loading nearby amenities…
Taxation est. · year 1
- Rental income
- $33,536
- − Mortgage interest
- −$8,962
- − Property taxes
- −$1,481
- − Insurance
- −$800
- − Repairs & maintenance
- −$2,683
- − Management
- −$2,683
- − Depreciation
- −$4,655
- Taxable income
- $12,272
- Est. tax owed @ 24.0%
- −$2,945
- After-tax cash flow
- $11,198/yr
For passive investors: Depreciation is non-cash, so a rental often shows a tax loss while cash-flowing — sheltering income. Rental losses are passive: they offset passive income freely, and up to $25,000/yr can offset ordinary (W-2) income if you actively participate and your MAGI is under $100k (phasing out to $0 by $150k); unused losses carry forward. On sale, claimed depreciation is recaptured at up to 25%, and gains may owe capital-gains tax (a 1031 exchange can defer both). Figures are a year-1 estimate at your 24.0% rate — not tax advice; consult a CPA.
Schools (NCES district)
- District
- Pennsbury SD
- NCES district ID
- 4218840
- Math proficiency
- 46% ▼ -13.00%
- Reading proficiency
- 69% ▼ -8.00%
- Median HH income
- $85,495
- Composite
- 52.3/100
- National rank
- #1594
- State rank
- #67 of 539 in PA
Livability — Falls
No livability data for this city. (Only ~50 U.S. cities are tracked.)
Census & demographics
- County
- Bucks County · 506,477 people
- Metro
- Philadelphia-Camden-Wilmington, PA-NJ-DE-MD
- Population (ZIP)
- 53,885
- Household income
- $133,630
- Rent vs Own
- Severe rent burden
- 1036.0
Population outlook (Bucks County) Hauer SSP2
- Today (2025)
- 630,973 people
- By 2030
- 627,093 · -0.6%
- By 2040
- 609,680 · -3.4%
- By 2050
- 584,225 · -7.4%
- By 2075
- 539,840 · -14.4%
- By 2100
- 483,970 · -23.3%
Race, ethnicity, and origin ACS 2023
- Neighborhood character
- Predominantly White (80%)
- Race & ethnicity
- White 80% Hispanic / Latino 7% Asian 6% Two or more races 5% Black 4%
- Hispanic origin (detail)
- Mexican 2% Puerto Rican 1% Dominican 1%
- Common ancestry
- Romanian 10% Scotch-Irish 2% Italian 2%
- Foreign-born
- 11% · Canada, China, Jamaica
- Languages at home
- 88% English-only · Spanish 5% Other Indo-European 3% Russian/Polish/Slavic 2%
Political lean MEDSL · Bucks
- 2024 margin
- Toss-up / Even · D 49.5% · R 49.5%
- 2008→2024 swing
- -8.7pp toward R · 2008: 8.7pp · 2024: -0.1pp
- All cycles
- 2024: R+0.1 2020: D+4.4 2016: D+0.6 2012: D+1.2 2008: D+8.7
Not yet ingested
- Civics
- —
Market trends
- HPI YoY
- ▼ -435.62%
- Current HPI
- 281.8167
- Rent YoY
- ▲ 3.12%
- Metro
- Philadelphia-Camden-Wilmington, PA-NJ-DE-MD
- State GDP YoY
- ▲ 1.68%
- F500 in state
- 34
Industry mix (Fortune 500 HQ in PA)
| Industry | F500 HQs | Revenue |
|---|---|---|
| Healthcare | 2 | $309B |
|
||
| Insurance | 2 | $27B |
|
||
| Telecommunications / Media | 1 | $124B |
|
||
| Industrial Distribution | 1 | $22B |
|
||
| Financial Services | 1 | $20B |
|
||
| Chemicals / Materials | 1 | $18B |
|
||
Price history
1 event — show timeline
- 2026-04-19 Listed $160,000 BRIGHT MLS
Property tax history
+6.8%/yrLatest (2026): $1,481 · +168.3% YoY. Source: county tax records.
Cash-flow waterfall
monthlySold comps — $/sqft
last 12 mo · ≤1 miLoading sold comps…