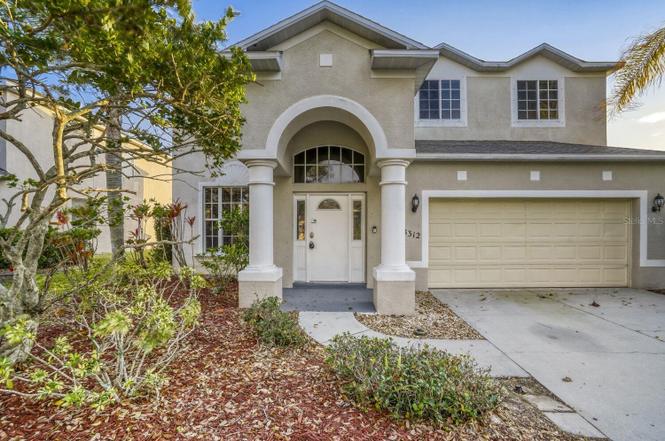
8312 Haven Harbour Way · Lakewood Ranch, FL
Flood risk 3/10 · Minor
- FEMA flood zone
- X (unshaded)
- Chance of flooding over 30 yrs
- 0.12%
- Est. flood insurance / yr
- $507 – $1,088
Fire risk 1/10 · Minimal
- Est. fire insurance / yr
- $947 – $1,759
Heat risk 10/10 · Severe
- Hot days now (above 107°F)
- 7 days/yr
- Hot days in 30 yrs
- 29 days/yr
Wind risk 10/10 · Severe
- Chance of severe wind over 30 yrs
- 99.0%
Air-quality risk 3/10 · Minor
- Unhealthy air days now
- 3 days/yr
- Unhealthy air days in 30 yrs
- 3 days/yr
Risk factors via First Street. Map © Google.
Why this score? — see what drove the B- grade
The composite is a weighted blend of 9 inputs, each scored 0–100. Each bar is that input's sub-score; the figure is the points it added to the 100-point composite (weight × sub-score).
- Cash flow +22.3/30.0
- ARV discount +15.0/15.0
- DSCR +7.2/10.0
- 1% rule +6.8/10.0
- Schools +4.4/10.0
- Appreciation +4.1/10.0
- Livability +2.5/5.0
- Condition / age +2.5/5.0
- Rent growth +1.6/5.0
$399,900
🖨 Deal sheet 📄 Offer letter ✓ Due diligence
Listing remarks MLS
Don't miss the opportunity to see this large home in prestigious Stoneybrook at Heritage Harbour. The spacious open Boca Grande floorplan with 4 bedrooms and 3.5 baths offers many upgrades including arched doorways, gourmet style kitchen, and two walk-in closets in the master bedroom with huge en suite. Enjoy the scenery and natural setting surrounding the lake while relaxing on the private screened lanai. The Stoneybrook Recreation Center comprises 6.3 acres and includes many wonderful resort style amenities including a pool, clubhouse, lighted tennis courts, sand volleyball court, and exercise studio. Outdoor activities are an important benefit of living in Heritage Harbour and in Florida. Heritage Harbour residents live a short distance from a variety of entertainment opportunities. In the Bradenton/Sarasota and St. Petersburg/Tampa areas, there are theaters, museums, sports facilities, and other entertainment venues just an hour or less from home. From sunny days at the pool to your every fitness need, this community has it all! Don't miss this chance to own in the popular Suncoast area!
Key facts
- Open living spaces
- Screened back porch
- Roomy closets
Tags
Neighborhood map
What this means for you Summary
Snapshot
- This is a 4-bed/4.0-bath single-family listed at $400k.
Deal economics
- At list price, monthly cash flow is $662 ($8k/yr) — positive.
- The deal already cash-flows at list — no discount required.
- Meets the 1% rule at list price ($5k rent vs $400k).
- Recommended offer: $364k (9.0% below list) — sets the bar for market timing.
- Cap rate 8.3% vs local median 3.3% in Lakewood Ranch — top-decile yield for the area; either an underpriced asset or a hidden risk that comps aren't pricing in. Stress-test before assuming the spread holds.
Location & tenants
- Location reads: area grade B — affects rentability + tenant quality, not the cash-flow math above.
- Manatee (suburban): math 54% / reading 50% proficiency, ranked #26 of 73 in FL (top 36%) — acceptable for families but not a draw, mixed tenant base, ~2y average lease.
- Market conditions: Rents falling (-3.4%/yr); 479 active listings in the ZIP; 22 comparable units currently listed for rent nearby; rentals at typical pace (median 24d on market — plan ~3-4 weeks tenant-placement turnaround); high-income renter base; 7,472 units permitted in Manatee County in 2024 (1,782 in 5+ unit buildings).
- This rent runs 45% of the median local income ($125k/yr) — at the standard rent-burdened threshold; future hikes will face affordability resistance.
Forward outlook
- Local home prices are declining (-1.8%/yr); year-one equity from $3k of loan paydown is wiped out by about $7k of value loss. Plan a longer hold.
- Manatee County population projected at +43% by 2050 — long-run rental-demand tailwind backs the buy-and-hold thesis.
Negotiation context
- It's been on market 106 days — a 9% lower offer ($364k) is reasonable based on typical stale-listing flexibility.
- 4 sale attempts since 17y ago; this cycle's ask has dropped $140k (26%) from the opening price — seller is motivated, your offer sets the floor, not the list.
- Current owner paid $274k; 46% above their basis — modest negotiation headroom, anchor on the comps not their cost.
Risks & watch-outs
- Climate carrying-cost: severe wind risk, 99% chance of damaging wind over 30y; extreme-heat days projected 7→29/yr by 2055 (HVAC capex compounding) — expect insurance premiums to compound above CPI over the hold.
Questions for the listing agent
- It's been on market 106 days. Have you received any prior offers? Is the seller open to a 9% concession, seller financing, or rate buy-down credit?
- What does the HOA fee cover, when was the last increase, and are there any pending special assessments or reserve-fund shortfalls?
- Why hasn't it sold? Are there any deal-killer items the seller is aware of (foundation, flood, title, zoning, code violations)?
- Is there a deadline driving the sale (1031 exchange, divorce, estate, relocation)? That informs how much negotiation room exists.
- What's the average days-on-market for RENTAL listings here right now (not sales)? A rising rental-DOM trend means longer vacancies and softer asking-rent achievability than the comps imply.
- What's the recent tenant-quality profile in this submarket — average credit score on applications, eviction rate, late-payment / NSF rate, and stable-employment percentage? A property-management company in the area should have these aggregated.
- How much new for-sale + rental construction is in the pipeline within 1–3 miles? Heavy new supply typically softens prices + rents 12–24 months out; constrained supply supports both.
Investment metrics
- 1% rule
- 1.18% ✓
- Cap rate
- 8.28%
- Cash-on-cash
- 7.09%
- DSCR
- 1.32
- GRM
- 7.1
CMA / ARV
- ARV (on-the-fly)
- $656,320
- Comps found
- 12
Show comp detail 12 sales within ~0.75 mi
| Address | Dist | Beds/Ba | Sqft | Sold | Price | $/sf | Match |
|---|---|---|---|---|---|---|---|
| 8312 Haven Harbour Way | 0.00mi | 4/3.5 | 2,930 (0%) | 1mo | $390,000 | $133 | 98 |
| 8323 Haven Harbour Way | 0.04mi | 4/3.5 | 2,930 (0%) | 4mo | $505,000 | $172 | 93 |
| 8212 River Preserve Dr | 0.40mi | 4/3.0 | 2,926 (-0%) | 4mo | $920,000 | $314 | 74 |
| 9003 Willowbrook Cir | 0.40mi | 4/3.5 | 2,909 (-1%) | 6mo | $465,000 | $160 | 73 |
| 9010 Kingsbury Pl | 0.53mi | 4/3.0 | 2,880 (-2%) | 1mo | $645,000 | $224 | 68 |
| 7531 Camden Harbour Dr | 0.54mi | 4/3.0 | 2,948 (+1%) | 3mo | $522,500 | $177 | 67 |
| 7215 Heritage Grand Pl | 0.64mi | 4/3.0 | 2,901 (-1%) | 6mo | $866,000 | $299 | 59 |
| 428 Grand Preserve Cv | 0.47mi | 4/3.0 | 2,680 (-8%) | 2mo | $477,474 | $178 | 58 |
| 7581 Camden Harbour Dr | 0.63mi | 4/3.0 | 2,826 (-4%) | 4mo | $725,000 | $257 | 57 |
| 8840 Brookfield Ter | 0.63mi | 4/3.0 | 2,868 (-2%) | 10mo | $700,000 | $244 | 55 |
| 223 Heritage Isles Way | 0.21mi | 3/2.5 (-1) | 2,526 (-14%) | 9mo | $530,000 | $210 | 49 |
| 610 Moorings Way | 0.68mi | 4/3.0 | 2,533 (-14%) | 2mo | $970,000 | $383 | 40 |
Match score weights: distance 35% · size 25% · config 20% · recency 20%. Top-matched comps best support the ARV.
Projected returns pro-forma
-1.82% appreciation · 0.0% rent growth · sell at horizon
- IRR
- -3.6%
- Equity multiple
- 0.86×
- Total profit
- $-16,086
- Equity at exit
- $81,030
- IRR
- 0.7%
- Equity multiple
- 1.05×
- Total profit
- $6,084
- Equity at exit
- $72,482
Cash invested: $111,972 (down + closing). Projections, not guarantees.
Landlord ↔ Tenant lean methodology
- Overall (STATE)
- 87 Strongly Landlord-Friendly
- State Florida
- 87 Strongly Landlord-Friendly · R+3
- County
- — inherits STATE
- City
- — inherits STATE
ZIP-level market 34212
- Home prices YoY
- -0.7%
- Rents YoY
- -3.4%
- Active inventory
- 479
- Price-to-rent
- 7.1×
Monthly cashflow live
- Estimated rent
- $4,706 high interval (Pro) →
- Mortgage (P&I)
- −$2,097
- Tax from tax record
- −$652 /mo · $7,826/yr
- Insurance
- −$167
- HOA
- −$140
- Vacancy / Maint / Mgmt
- −$988
- Net cashflow
- $662
Break-even live
UW: 25.0% down · 7.5% · 30yr · 1.5% tax · 5.0% vac · 8.0% maint · 8.0% mgmt
Financing live
Cash to close
- Down payment
- $99,975
- Closing costs
- $11,997
- Reserves months
- —
- Total cash needed
- —
Loan-product check · same deal, 3 products live
Conventional
25% down · 7.5% · 30yr
- Down + closing
- —
- Monthly P&I
- —
- Monthly cashflow
- —
- DSCR
- —
- Eligible?
- —
Personal DTI + credit; lowest rate.
DSCR
20% down · 8.5% · 30yr
- Down + closing
- —
- Monthly P&I
- —
- Monthly cashflow
- —
- DSCR
- —
- Eligible?
- —
No personal income docs; deal must DSCR.
Hard money
10% down · 12.0% · 12mo
- Down + closing
- —
- Monthly P&I
- —
- Monthly cashflow
- —
- DSCR
- —
- Eligible?
- —
Short-term bridge; refi at stabilization.
Rent comps 22 comps
| Address | Beds | Baths | Sqft | Rent | $/sqft | DOM | Units | Dist |
|---|---|---|---|---|---|---|---|---|
| 115 River Enclave Ct Bradenton, FL | 3.0 | 2.0 | 2074 | $6,900 | $3.33 | 3d | 1 | 0.30mi |
| 135 River Enclave Ct Bradenton, FL | 3.0 | 2.0 | 2062 | $1,950 | $0.95 | 3d | 1 | 0.35mi |
| 8820 Heritage Sound Dr Bradenton, FL | 3.0 | 2.0 | 2036 | $5,000 | $2.46 | 23d | 1 | 0.39mi |
| 7742 Camden Harbour Dr Bradenton, FL | 4.0 | 3.0 | 2996 | $8,900 | $2.97 | 23d | 1 | 0.41mi |
| 7510 Camden Harbour Dr Unit 1546329P Bradenton, FL | 4.0 | 3.0 | 3013 | $7,096 | $2.36 | 15d | 1 | 0.49mi |
| 404 Golden Harbour Trl Bradenton, FL | 3.0 | 2.0 | 2204 | $3,700 | $1.68 | 3d | 1 | 0.49mi |
| 339 River Enclave Ct Bradenton, FL | 3.0 | 2.0 | 2074 | $6,900 | $3.33 | 23d | 1 | 0.55mi |
| 7287 Ketch Pl Bradenton, FL | 3.0 | 2.5 | 1968 | $2,295 | $1.17 | 15d | 1 | 0.68mi |
| 7276 Ketch Pl Bradenton, FL | 3.0 | 2.5 | 1986 | $2,050 | $1.03 | 11d | 1 | 0.70mi |
| 7156 Marsh View Ter Bradenton, FL | 4.0 | 3.0 | 2006 | $3,950 | $1.97 | 3d | 1 | 0.71mi |
| 7156 Marsh View Ter Bradenton, FL | 4.0 | 3.0 | 2032 | $3,950 | $1.94 | 15d | 1 | 0.71mi |
| 416 Winding Brook Ln #102 Bradenton, FL | 3.0 | 2.0 | 2108 | $3,000 | $1.42 | 23d | 1 | 0.77mi |
| 7312 River Hammock Dr #103 Bradenton, FL | 3.0 | 2.0 | 2099 | $4,000 | $1.91 | 23d | 1 | 0.77mi |
| 10016 Rembrandt Way #101 Bradenton, FL | 3.0 | 2.0 | 1962 | $4,250 | $2.17 | 23d | 1 | 0.80mi |
| 10016 Rembrandt Way #202 Bradenton, FL | 3.0 | 2.0 | 2661 | $3,750 | $1.41 | 23d | 1 | 0.80mi |
| 7015 Grand Estuary Trl #103 Bradenton, FL | 3.0 | 2.0 | 2108 | $2,500 | $1.19 | 15d | 1 | 0.95mi |
| 7112 Grand Estuary Trl #103 Bradenton, FL | 3.0 | 2.0 | 2108 | $3,200 | $1.52 | 23d | 1 | 0.96mi |
| 652 Planters Manor Way Bradenton, FL | 3.0 | 2.0 | 2370 | $3,300 | $1.39 | 23d | 1 | 1.00mi |
| 6911 Grand Estuary Trl #102 Bradenton, FL | 3.0 | 2.0 | 2108 | $6,500 | $3.08 | 23d | 1 | 1.02mi |
| 6888 Willowshire Way Bradenton, FL | 4.0 | 3.0 | 2006 | $4,000 | $1.99 | 23d | 1 | 1.07mi |
| 6808 Wild Lake Ter Bradenton, FL | 4.0 | 3.0 | 2287 | $4,800 | $2.10 | 23d | 1 | 1.07mi |
| 6512 Grand Estuary Trl #102 Bradenton, FL | 3.0 | 2.0 | 2108 | $3,400 | $1.61 | 23d | 1 | 1.47mi |
HOA detail
- Monthly dues
- $140 · $1,680/yr
- Likely covers
- pool
Listing history 15 events
-
2026-03-31status Pending
-
2026-03-19status Active
-
2026-03-06status Pending
-
2026-03-02price $399,900
-
2026-02-20price $439,000
-
2026-02-11price $469,900
-
2026-01-30price $495,900
-
2026-01-23price $509,900
-
2026-01-10price $524,500
-
2025-12-02$539,900 Active
-
2013-03-07soldstatus $274,500 1108-char remark
Show marketing remark (1108 chars)
Don't miss the opportunity to see this large home in prestigious Stoneybrook at Heritage Harbour. The spacious open Boca Grande floorplan with 4 bedrooms and 3.5 baths offers many upgrades including arched doorways, gourmet style kitchen, and two walk-in closets in the master bedroom with huge en suite. Enjoy the scenery and natural setting surrounding the lake while relaxing on the private screened lanai. The Stoneybrook Recreation Center comprises 6.3 acres and includes many wonderful resort style amenities including a pool, clubhouse, lighted tennis courts, sand volleyball court, and exercise studio. Outdoor activities are an important benefit of living in Heritage Harbour and in Florida. Heritage Harbour residents live a short distance from a variety of entertainment opportunities. In the Bradenton/Sarasota and St. Petersburg/Tampa areas, there are theaters, museums, sports facilities, and other entertainment venues just an hour or less from home. From sunny days at the pool to your every fitness need, this community has it all! Don't miss this chance to own in the popular Suncoast area!
-
2013-01-09$275,000 1108-char remark
Show marketing remark (1108 chars)
Don't miss the opportunity to see this large home in prestigious Stoneybrook at Heritage Harbour. The spacious open Boca Grande floorplan with 4 bedrooms and 3.5 baths offers many upgrades including arched doorways, gourmet style kitchen, and two walk-in closets in the master bedroom with huge en suite. Enjoy the scenery and natural setting surrounding the lake while relaxing on the private screened lanai. The Stoneybrook Recreation Center comprises 6.3 acres and includes many wonderful resort style amenities including a pool, clubhouse, lighted tennis courts, sand volleyball court, and exercise studio. Outdoor activities are an important benefit of living in Heritage Harbour and in Florida. Heritage Harbour residents live a short distance from a variety of entertainment opportunities. In the Bradenton/Sarasota and St. Petersburg/Tampa areas, there are theaters, museums, sports facilities, and other entertainment venues just an hour or less from home. From sunny days at the pool to your every fitness need, this community has it all! Don't miss this chance to own in the popular Suncoast area!
-
2010-11-23historical
-
2009-12-14$210,000
-
2003-02-28soldstatus $463,300
ⓘ Source: listings_history table (triggers on properties + properties_extension) + one-shot
backfill from property_details.listing_events for pre-trigger history.
Tax reassessment forecast FL · Resets to sale price
- Current annual tax
- $7,826 · $652/mo
- Projected year-2 tax
- $7,826 · $652/mo
- Expected delta
- $0/yr ($0/mo · 0.0%)
ⓘ Screening estimate from a state-policy table — verify with the county assessor before closing.
Climate risk First Street
- Flood 3/10 Moderate FEMA zone X (unshaded) · 12% chance over 30 yrs
- Wildfire 1/10 Low
- Heat 10/10 Extreme 7 d/yr ≥107°F today · 29 d/yr by 30 yrs out
- Wind 10/10 Extreme 99% chance of damaging wind over 30 yrs
- Air quality 3/10 Moderate 3 unhealthy d/yr today · 3 by 30 yrs out
Nearby sold comps map
Loading sold comps map…
Walkable amenities ~0.75 mi
Loading nearby amenities…
Taxation est. · year 1
- Rental income
- $56,468
- − Mortgage interest
- −$22,401
- − Property taxes
- −$7,826
- − Insurance
- −$2,000
- − Repairs & maintenance
- −$4,517
- − Management
- −$4,517
- − HOA
- −$1,680
- − Depreciation
- −$11,633
- Taxable income
- $1,894
- Est. tax owed @ 24.0%
- −$454
- After-tax cash flow
- $7,484/yr
For passive investors: Depreciation is non-cash, so a rental often shows a tax loss while cash-flowing — sheltering income. Rental losses are passive: they offset passive income freely, and up to $25,000/yr can offset ordinary (W-2) income if you actively participate and your MAGI is under $100k (phasing out to $0 by $150k); unused losses carry forward. On sale, claimed depreciation is recaptured at up to 25%, and gains may owe capital-gains tax (a 1031 exchange can defer both). Figures are a year-1 estimate at your 24.0% rate — not tax advice; consult a CPA.
Schools (NCES district)
- District
- Manatee
- NCES district ID
- 1201230
- Math proficiency
- 54% ▼ -6.00%
- Reading proficiency
- 50% ▼ -2.00%
- Median HH income
- $49,607
- Composite
- 44.43/100
- National rank
- #2806
- State rank
- #26 of 73 in FL
Livability — Lakewood Ranch
No livability data for this city. (Only ~50 U.S. cities are tracked.)
Census & demographics
- County
- Manatee County · 416,364 people
- City population
- 52,177
- Metro
- North Port-Sarasota-Bradenton, FL
- Population (ZIP)
- 25,536
- Household income
- $125,486
- Rent vs Own
- Severe rent burden
- 383.0
Population outlook (Manatee County) Hauer SSP2
- Today (2025)
- 447,342 people
- By 2030
- 488,911 · +9.3%
- By 2040
- 567,934 · +27.0%
- By 2050
- 637,995 · +42.6%
- By 2075
- 781,970 · +74.8%
- By 2100
- 848,272 · +89.6%
Race, ethnicity, and origin ACS 2023
- Neighborhood character
- Predominantly White (81%)
- Race & ethnicity
- White 81% Hispanic / Latino 10% Two or more races 8% Black 3% Asian 2%
- Hispanic origin (detail)
- Mexican 1% Puerto Rican 2% Cuban 1%
- Common ancestry
- Romanian 5% Lithuanian 3% Slovak 2%
- Foreign-born
- 9% · Canada, Vietnam, China
- Languages at home
- 89% English-only · Spanish 6% Other Indo-European 2% Vietnamese 2%
Political lean MEDSL · Manatee
- 2024 margin
- Strong R (+23.5) · D 37.9% · R 61.4%
- 2008→2024 swing
- -16.5pp toward R · 2008: -7.0pp · 2024: -23.5pp
- All cycles
- 2024: R+23.5 2020: R+16.1 2016: R+17.1 2012: R+12.5 2008: R+7.0
Not yet ingested
- Civics
- —
Market trends
- HPI YoY
- ▼ -1.82%
- Current HPI
- 276.7636
- Rent YoY
- ▼ -3.44%
- Metro
- North Port-Sarasota-Bradenton, FL
- State GDP YoY
- ▲ 3.28%
- F500 in state
- 36
Industry mix (Fortune 500 HQ in FL)
| Industry | F500 HQs | Revenue |
|---|---|---|
| Industrial Technology | 2 | $29B |
|
||
| Insurance | 2 | $17B |
|
||
| Retail | 1 | $60B |
|
||
| Technology Distribution | 1 | $58B |
|
||
| Homebuilding | 1 | $35B |
|
||
| Technology Manufacturing | 1 | $35B |
|
||
Price history
-13.7% since first listed15 events — show timeline
- 2026-03-31 Pending — Stellar MLS as Distributed by MLS Grid
- 2026-03-19 Relisted — Stellar MLS as Distributed by MLS Grid
- 2026-03-06 Pending — Stellar MLS as Distributed by MLS Grid
- 2026-03-02 Price Changed $399,900 Stellar MLS as Distributed by MLS Grid
- 2026-02-20 Price Changed $439,000 Stellar MLS as Distributed by MLS Grid
- 2026-02-11 Price Changed $469,900 Stellar MLS as Distributed by MLS Grid
- 2026-01-30 Price Changed $495,900 Stellar MLS as Distributed by MLS Grid
- 2026-01-23 Price Changed $509,900 Stellar MLS as Distributed by MLS Grid
- 2026-01-10 Price Changed $524,500 Stellar MLS as Distributed by MLS Grid
- 2025-12-02 Listed $539,900 Stellar MLS as Distributed by MLS Grid
- 2013-03-07 Sold (MLS) $274,500 Stellar MLS as Distributed by MLS Grid
- 2013-01-09 Listed $275,000 Stellar MLS as Distributed by MLS Grid
- 2010-11-23 Listing Removed — Stellar MLS as Distributed by MLS Grid
- 2009-12-14 Listed $210,000 Stellar MLS as Distributed by MLS Grid
- 2003-02-28 Sold (Public Records) $463,300 Public Records
Property tax history
+6.3%/yrLatest (2025): $7,826 · +2.4% YoY. Source: county tax records.
Cash-flow waterfall
monthlySold comps — $/sqft
last 12 mo · ≤1 miLoading sold comps…