82 Vista Cir · Fetters Hot Springs-Agua Caliente, CA
Flood risk 6/10 · Moderate
- FEMA flood zone
- X (unshaded)
- Chance of flooding over 30 yrs
- 0.74%
- Est. flood insurance / yr
- $507 – $1,088
Fire risk 6/10 · Moderate
- Est. fire insurance / yr
- $659 – $1,223
Heat risk 4/10 · Minor
- Hot days now (above 97°F)
- 7 days/yr
- Hot days in 30 yrs
- 16 days/yr
Wind risk 1/10 · Minimal
- Chance of severe wind over 30 yrs
- —
Air-quality risk 9/10 · Severe
- Unhealthy air days now
- 19 days/yr
- Unhealthy air days in 30 yrs
- 19 days/yr
Risk factors via First Street. Map © Google.
Why this score? — see what drove the C+ grade
The composite is a weighted blend of 9 inputs, each scored 0–100. Each bar is that input's sub-score; the figure is the points it added to the 100-point composite (weight × sub-score).
- Cash flow +26.7/30.0
- DSCR +9.1/10.0
- ARV discount +7.5/15.0
- 1% rule +7.2/10.0
- Schools +3.4/10.0
- Rent growth +2.7/5.0
- Livability +2.5/5.0
- Condition / age +2.5/5.0
- Appreciation +0.0/10.0
$199,000
🖨 Deal sheet 📄 Offer letter ✓ Due diligence
Listing remarks MLS
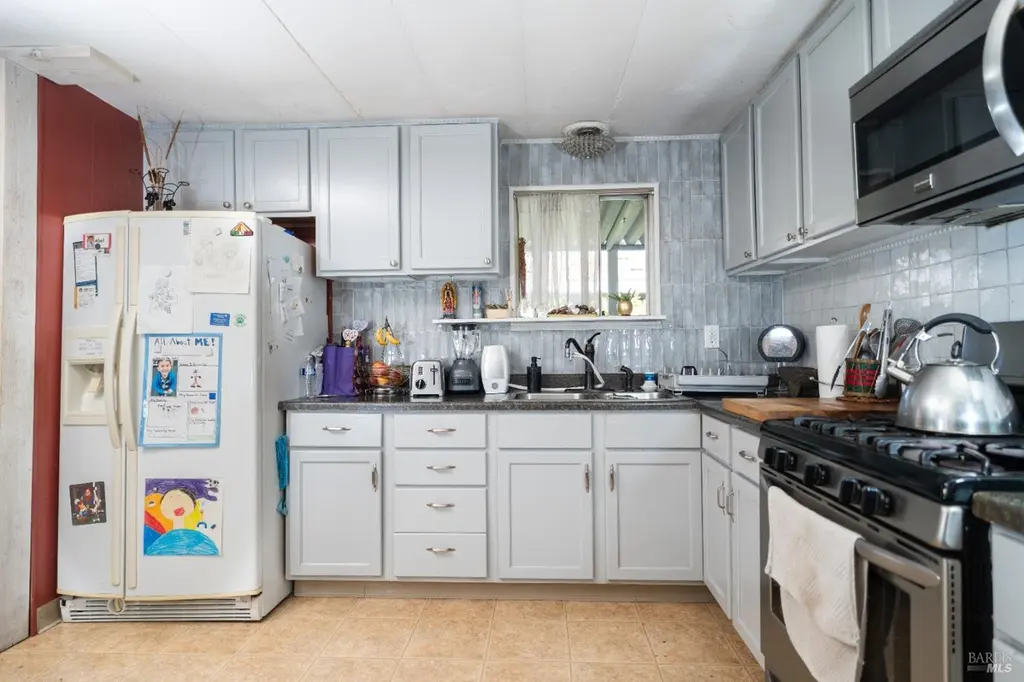
Beautiful mobile home offering a great opportunity to own in the heart of Sonoma! Located at 82 Vista Circle, Sonoma, CA, this well-kept home provides a peaceful and quiet setting to call home. Enjoy comfortable living with a functional layout and inviting spaces throughout. During the summer months, take advantage of the community pool, perfect for relaxing and entertaining. Conveniently located near local amenities, shopping, and dining, this home offers both comfort and lifestyle. Don't miss this amazing opportunity to enjoy Sonoma living at an affordable price.
Key facts
- Community pool
- Functional layout
- Local amenities
Tags
Neighborhood map
What this means for you Summary
Snapshot
- This is a 2-bed/1.0-bath manufactured listed at $199k.
Deal economics
- At list price, monthly cash flow is $537 ($6k/yr) — positive.
- The deal already cash-flows at list — no discount required.
- Meets the 1% rule at list price ($2k rent vs $199k).
- Recommended offer: $175k (12.0% below list) — sets the bar for market timing.
Location & tenants
- Location reads: area grade C — affects rentability + tenant quality, not the cash-flow math above.
- Sonoma Valley Unified (town): math 27% / reading 42% proficiency, ranked #849 of 1,400 in CA (top 61%) — families likely to look elsewhere, expect single-tenant / working-renter base with shorter leases.
- Market conditions: Rents flat; 263 active listings in the ZIP; 5 comparable units currently listed for rent nearby; rentals lingering (median 44d on market — plan ~5-8 weeks vacancy on turnover, expect pricing pressure); 60% of comp listings sitting > 30 days — soft ceiling on asking rent; solid renter incomes; 1,039 units permitted in Sonoma County in 2024 (185 in 5+ unit buildings).
Forward outlook
- Local home prices are declining (-3.0%/yr); year-one equity from $1k of loan paydown is wiped out by about $6k of value loss. Plan a longer hold.
- Sonoma County population projected at +8% by 2050 — modest demand growth; plan on rents tracking national, not racing it.
Negotiation context
- It's been on market 191 days — a 12% lower offer ($175k) is reasonable based on typical stale-listing flexibility.
Risks & watch-outs
- Climate carrying-cost: major flood risk; major wildfire risk — expect insurance premiums to compound above CPI over the hold.
Questions for the listing agent
- It's been on market 191 days. Have you received any prior offers? Is the seller open to a 12% concession, seller financing, or rate buy-down credit?
- Built in 1971 — when were the roof, HVAC, electrical panel, plumbing, and water heater last replaced?
- Why hasn't it sold? Are there any deal-killer items the seller is aware of (foundation, flood, title, zoning, code violations)?
- Is there a deadline driving the sale (1031 exchange, divorce, estate, relocation)? That informs how much negotiation room exists.
- What's the average days-on-market for RENTAL listings here right now (not sales)? A rising rental-DOM trend means longer vacancies and softer asking-rent achievability than the comps imply.
- What's the recent tenant-quality profile in this submarket — average credit score on applications, eviction rate, late-payment / NSF rate, and stable-employment percentage? A property-management company in the area should have these aggregated.
- How much new for-sale + rental construction is in the pipeline within 1–3 miles? Heavy new supply typically softens prices + rents 12–24 months out; constrained supply supports both.
Investment metrics
- 1% rule
- 1.22% ✓
- Cap rate
- 9.53%
- Cash-on-cash
- 11.56%
- DSCR
- 1.51
- GRM
- 6.9
CMA / ARV
- ARV (median comp)
- $96,000
- List price
- $199,000
- Delta
- 107.29%
- Verdict
- OVERPRICED
- Comps
- 4 within 2.0 mi
Show comp detail 1 sale within ~0.75 mi
| Address | Dist | Beds/Ba | Sqft | Sold | Price | $/sf | Match |
|---|---|---|---|---|---|---|---|
| 92 Vista Cir | 0.01mi | 2/1.0 | 624 (-7%) | 22mo | $70,000 | $112 | 70 |
Match score weights: distance 35% · size 25% · config 20% · recency 20%. Top-matched comps best support the ARV.
Projected returns pro-forma
-3.0% appreciation · 0.79% rent growth · sell at horizon
- IRR
- -1.6%
- Equity multiple
- 0.94×
- Total profit
- $-3,284
- Equity at exit
- $29,672
- IRR
- 5.6%
- Equity multiple
- 1.37×
- Total profit
- $20,645
- Equity at exit
- $17,206
Cash invested: $55,720 (down + closing). Projections, not guarantees.
Landlord ↔ Tenant lean methodology
- Overall (STATE)
- 18 Strongly Tenant-Friendly
- State California
- 18 Strongly Tenant-Friendly · D+13
- County
- — inherits STATE
- City
- — inherits STATE
ZIP-level market 95476
- Rents YoY
- 0.8%
- Active inventory
- 263
- Price-to-rent
- 6.9×
Monthly cashflow live
- Estimated rent
- $2,420 high interval (Pro) →
- Mortgage (P&I)
- −$1,044
- Tax est. 1.5%
- −$249 /mo · $2,985/yr
- Insurance
- −$83
- HOA
- −$0
- Vacancy / Maint / Mgmt
- −$508
- Net cashflow
- $537
Break-even live
UW: 25.0% down · 7.5% · 30yr · 1.5% tax · 5.0% vac · 8.0% maint · 8.0% mgmt
Financing live
Cash to close
- Down payment
- $49,750
- Closing costs
- $5,970
- Reserves months
- —
- Total cash needed
- —
Loan-product check · same deal, 3 products live
Conventional
25% down · 7.5% · 30yr
- Down + closing
- —
- Monthly P&I
- —
- Monthly cashflow
- —
- DSCR
- —
- Eligible?
- —
Personal DTI + credit; lowest rate.
DSCR
20% down · 8.5% · 30yr
- Down + closing
- —
- Monthly P&I
- —
- Monthly cashflow
- —
- DSCR
- —
- Eligible?
- —
No personal income docs; deal must DSCR.
Hard money
10% down · 12.0% · 12mo
- Down + closing
- —
- Monthly P&I
- —
- Monthly cashflow
- —
- DSCR
- —
- Eligible?
- —
Short-term bridge; refi at stabilization.
Rent comps 5 comps
| Address | Beds | Baths | Sqft | Rent | $/sqft | DOM | Units | Dist |
|---|---|---|---|---|---|---|---|---|
| 17353 Park Ave Unit 17351 Sonoma, CA | 2.0 | 1.0 | 700 | $2,150 | $3.07 | 14d | 1 | 0.32mi |
| 16914 Sonoma Hwy Sonoma, CA | 2.0 | 1.0 | 750 | $2,595 | $3.46 | 43d | 1 | 0.44mi |
| 400 Calle Del Monte Unit B Sonoma, CA | 1.0 | 1.0 | 650 | $2,150 | $3.31 | 43d | 1 | 0.77mi |
| 120 Buena Vida Ct Unit 120 Sonoma, CA | 1.0 | 1.0 | 500 | $1,900 | $3.80 | 43d | 1 | 1.10mi |
| 120 Buena Vida Ct Unit 128 Sonoma, CA | 1.0 | 1.0 | 500 | $1,800 | $3.60 | 23d | 1 | 1.10mi |
Listing history 18 events
-
2026-06-18days on market $199,000 Active 191 DOM
-
2026-06-17days on market $199,000 Active 190 DOM
-
2026-06-16days on market $199,000 Active 189 DOM
-
2026-06-15days on market $199,000 Active 188 DOM
-
2026-06-14days on market $199,000 Active 186 DOM
-
2026-06-13days on market $199,000 Active 185 DOM
-
2026-06-10days on market $199,000 Active 183 DOM
-
2026-06-09days on market $199,000 Active 182 DOM
-
2026-06-08days on market $199,000 Active 181 DOM
-
2026-06-07days on market $199,000 Active 180 DOM
-
2026-06-05days on market $199,000 Active 177 DOM
-
2026-06-03days on market $199,000 Active 176 DOM
-
2026-06-02days on market $199,000 Active 175 DOM
-
2026-06-01days on market $199,000 Active 174 DOM
-
2026-05-31days on market $199,000 Active 173 DOM
-
2026-05-30days on market $199,000 Active 172 DOM
-
2026-03-26price $199,000 571-char remark
Show marketing remark (571 chars)
Beautiful mobile home offering a great opportunity to own in the heart of Sonoma! Located at 82 Vista Circle, Sonoma, CA, this well-kept home provides a peaceful and quiet setting to call home. Enjoy comfortable living with a functional layout and inviting spaces throughout. During the summer months, take advantage of the community pool, perfect for relaxing and entertaining. Conveniently located near local amenities, shopping, and dining, this home offers both comfort and lifestyle. Don't miss this amazing opportunity to enjoy Sonoma living at an affordable price.
-
2025-12-09$220,000 Active 571-char remark
Show marketing remark (571 chars)
Beautiful mobile home offering a great opportunity to own in the heart of Sonoma! Located at 82 Vista Circle, Sonoma, CA, this well-kept home provides a peaceful and quiet setting to call home. Enjoy comfortable living with a functional layout and inviting spaces throughout. During the summer months, take advantage of the community pool, perfect for relaxing and entertaining. Conveniently located near local amenities, shopping, and dining, this home offers both comfort and lifestyle. Don't miss this amazing opportunity to enjoy Sonoma living at an affordable price.
ⓘ Source: listings_history table (triggers on properties + properties_extension) + one-shot
backfill from property_details.listing_events for pre-trigger history.
Climate risk First Street
- Flood 6/10 Major FEMA zone X (unshaded) · 74% chance over 30 yrs
- Wildfire 6/10 Major
- Heat 4/10 Moderate 7 d/yr ≥97°F today · 16 d/yr by 30 yrs out
- Wind 1/10 Low
- Air quality 9/10 Extreme 19 unhealthy d/yr today · 19 by 30 yrs out
Nearby sold comps map
Loading sold comps map…
Walkable amenities ~0.75 mi
Loading nearby amenities…
Taxation est. · year 1
- Rental income
- $29,044
- − Mortgage interest
- −$11,147
- − Property taxes
- −$2,985
- − Insurance
- −$995
- − Repairs & maintenance
- −$2,324
- − Management
- −$2,324
- − Depreciation
- −$5,789
- Taxable income
- $3,481
- Est. tax owed @ 24.0%
- −$835
- After-tax cash flow
- $5,607/yr
For passive investors: Depreciation is non-cash, so a rental often shows a tax loss while cash-flowing — sheltering income. Rental losses are passive: they offset passive income freely, and up to $25,000/yr can offset ordinary (W-2) income if you actively participate and your MAGI is under $100k (phasing out to $0 by $150k); unused losses carry forward. On sale, claimed depreciation is recaptured at up to 25%, and gains may owe capital-gains tax (a 1031 exchange can defer both). Figures are a year-1 estimate at your 24.0% rate — not tax advice; consult a CPA.
Schools (NCES district)
- District
- Sonoma Valley Unified
- NCES district ID
- 0637200
- Math proficiency
- 27% ▼ -1.00%
- Reading proficiency
- 42% ▲ 1.00%
- Median HH income
- $63,880
- Composite
- 33.88/100
- National rank
- #10355
- State rank
- #849 of 1400 in CA
Livability — Fetters Hot Springs-Agua Caliente
No livability data for this city. (Only ~50 U.S. cities are tracked.)
Census & demographics
- Census place
- Fetters Hot Springs-Agua Caliente, CA
- County
- Sonoma County · 449,805 people
- Metro
- Santa Rosa-Petaluma, CA
- Population (ZIP)
- 35,196
- Household income
- $105,374
- Rent vs Own
- Severe rent burden
- 1218.0
Population outlook (Sonoma County) Hauer SSP2
- Today (2025)
- 539,935 people
- By 2030
- 554,870 · +2.8%
- By 2040
- 573,262 · +6.2%
- By 2050
- 580,715 · +7.6%
- By 2075
- 579,229 · +7.3%
- By 2100
- 547,835 · +1.5%
Race, ethnicity, and origin ACS 2023
- Neighborhood character
- Predominantly White (66%)
- Race & ethnicity
- White 66% Hispanic / Latino 28% Two or more races 13% Asian 2% Black 1%
- Hispanic origin (detail)
- Mexican 23%
- Common ancestry
- Italian 5% Lithuanian 4% Portuguese 3%
- Foreign-born
- 16% · Canada, Dominican Republic
- Languages at home
- 75% English-only · Spanish 21% Other Indo-European 1% Other Asian/Pacific 0%
Political lean MEDSL · Sonoma
- 2024 margin
- Solid D (+46.2) · D 71.4% · R 25.2% · Other 3.3%
- 2008→2024 swing
- -3.4pp toward R · 2008: 49.6pp · 2024: 46.2pp
- All cycles
- 2024: D+46.2 2020: D+51.5 2016: D+47.9 2012: D+44.9 2008: D+49.6
Not yet ingested
- Civics
- —
Market trends
- HPI YoY
- ▼ -1116.03%
- Current HPI
- 236.6408
- Rent YoY
- ▲ 0.79%
- Metro
- Santa Rosa-Petaluma, CA
- State GDP YoY
- ▲ 3.21%
- F500 in state
- 116
Industry mix (Fortune 500 HQ in CA)
| Industry | F500 HQs | Revenue |
|---|---|---|
| Technology | 27 | $1,492B |
|
||
| Financial Services | 3 | $174B |
|
||
| Retail | 3 | $44B |
|
||
| Insurance | 3 | $26B |
|
||
| Media / Entertainment | 2 | $115B |
|
||
| Pharmaceuticals / Biotech | 2 | $62B |
|
||
Price history
-9.5% since first listed2 events — show timeline
- 2026-03-26 Price Changed $199,000 BAREIS
- 2025-12-09 Listed $220,000 BAREIS
Property tax history
-2.6%/yrLatest (2025): $101 · -0.2% YoY. Source: county tax records.
Cash-flow waterfall
monthlySold comps — $/sqft
last 12 mo · ≤1 miLoading sold comps…