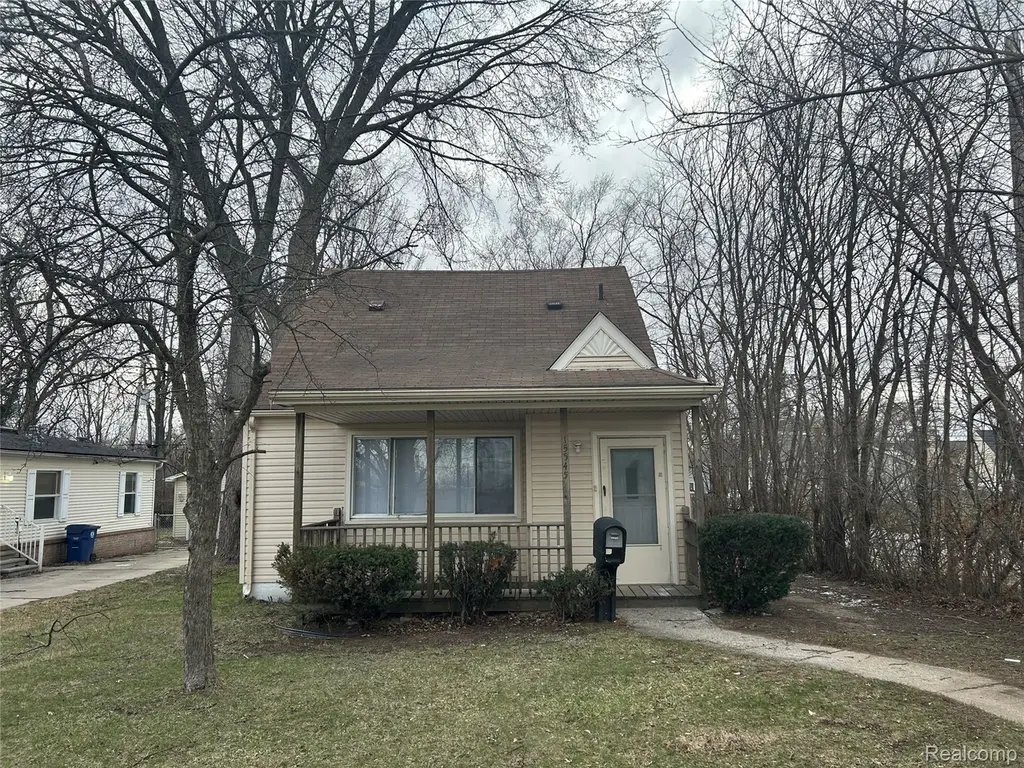
15545 Woodbine · Redford, MI
Flood risk 1/10 · Minimal
- FEMA flood zone
- X (unshaded)
- Chance of flooding over 30 yrs
- 0.0%
- Est. flood insurance / yr
- $507 – $1,088
Fire risk 1/10 · Minimal
- Est. fire insurance / yr
- $784 – $1,456
Heat risk 3/10 · Minor
- Hot days now (above 98°F)
- 7 days/yr
- Hot days in 30 yrs
- 15 days/yr
Wind risk 2/10 · Minimal
- Chance of severe wind over 30 yrs
- —
Air-quality risk 3/10 · Minor
- Unhealthy air days now
- 2 days/yr
- Unhealthy air days in 30 yrs
- 3 days/yr
Risk factors via First Street. Map © Google.
Why this score? — see what drove the D+ grade
The composite is a weighted blend of 9 inputs, each scored 0–100. Each bar is that input's sub-score; the figure is the points it added to the 100-point composite (weight × sub-score).
- ARV discount +15.0/15.0
- Cash flow +14.9/30.0
- DSCR +4.6/10.0
- 1% rule +3.5/10.0
- Rent growth +3.3/5.0
- Livability +2.5/5.0
- Condition / age +2.5/5.0
- Schools +1.4/10.0
- Appreciation +0.0/10.0
$139,900
🖨 Deal sheet 📄 Offer letter ✓ Due diligence
Listing remarks MLS
* * * Make this your primary residence or investment property * * * . Conveniently located in Redford near Telegraph, on a corner lot, is this quaint two-bedroom bungalow with a den that has sliding patio doors that lead to the deck in the backyard and the garage. Spacious kitchen. Appliances included. Sorry no basement and no central air. Fresh paint and new carpet throughout. All measurements are estimated, buyer/agent to verify all information. Warranty Deed. Sorry no land contracts. * * This property is also listed for rent (mls# 20261020939), whichever happens first, the other will be withdrawn * * . * Listing broker is the Seller. *
Key facts
- Fresh paint
- New carpet
- Deck in the backyard
Tags
Property features AI
Exterior
- Parking: Detached 2-car garage
- Utilities: Public water; Sewer available
- Home design: Single-family residence; One-and-a-half story; Ground-level entry
- Construction: Vinyl siding; Slab foundation
- Exterior features: Paved road access; Pets allowed (cats and dogs)
Interior
- Bathrooms: 1 full bathroom
- Heating & cooling: Forced air heating (natural gas); No central cooling
- Interior features: Gas water heater; Total of 3 rooms
Neighborhood map
What this means for you Summary
Snapshot
- This is a 2-bed/1.0-bath single-family listed at $140k.
Deal economics
- At list price, monthly cash flow is $41 ($494/yr) — positive.
- The deal already cash-flows at list — no discount required.
- To meet the 1% rule (rent ≥ 1% of price), the offer needs to be $118k (15.3% below list).
- Recommended offer: $118k (15.3% below list) — sets the bar for 1% rule.
Location & tenants
- Location reads: area grade D — affects rentability + tenant quality, not the cash-flow math above.
- Redford Union Schools District No. 1 (suburban): math 8% / reading 23% proficiency, ranked #489 of 540 in MI (top 91%) — low school quality limits family demand, transient renter base, plan for 1-2y turnover; 66% free/reduced lunch — lower-income household profile, screen leases tightly.
- Market conditions: Rents rising (+3.2%/yr); 188 active listings in the ZIP; 40 comparable units currently listed for rent nearby; rentals lingering (median 44d on market — plan ~5-8 weeks vacancy on turnover, expect pricing pressure); 85% of comp listings sitting > 30 days — soft ceiling on asking rent; 2,639 units permitted in Wayne County in 2024 (1,216 in 5+ unit buildings).
Forward outlook
- Local home prices are declining (-3.0%/yr); year-one equity from $967 of loan paydown is wiped out by about $4k of value loss. Plan a longer hold.
- Wayne County population projected at -17% by 2050 — secular population decline; favor cash flow + early exit over multi-decade hold.
Negotiation context
- It's been on market 23 days — a 2% lower offer ($138k) is reasonable based on typical stale-listing flexibility.
- 10 sale attempts since 21y ago with the ask held roughly flat each time — persistent listings suggest the price (not the market) is what's stuck; bring a comps-based counter.
Risks & watch-outs
- Watch-outs: built in 1948 — expect roof / HVAC / electrical / plumbing capex.
Questions for the listing agent
- Built in 1948 — when were the roof, HVAC, electrical panel, plumbing, and water heater last replaced?
- Is there a deadline driving the sale (1031 exchange, divorce, estate, relocation)? That informs how much negotiation room exists.
- The area grade is low — what's the realistic commute time and amenity access for the typical tenant pool here? Any planned neighborhood developments (good or bad) we should know about?
- What's the average days-on-market for RENTAL listings here right now (not sales)? A rising rental-DOM trend means longer vacancies and softer asking-rent achievability than the comps imply.
- What's the recent tenant-quality profile in this submarket — average credit score on applications, eviction rate, late-payment / NSF rate, and stable-employment percentage? A property-management company in the area should have these aggregated.
- How much new for-sale + rental construction is in the pipeline within 1–3 miles? Heavy new supply typically softens prices + rents 12–24 months out; constrained supply supports both.
Investment metrics
- 1% rule
- 0.85% ✗
- Cap rate
- 6.65%
- Cash-on-cash
- 1.26%
- DSCR
- 1.06
- GRM
- 9.8
CMA / ARV
- ARV (on-the-fly)
- $172,134
- Comps found
- 12
Show comp detail 12 sales within ~0.75 mi
| Address | Dist | Beds/Ba | Sqft | Sold | Price | $/sf | Match |
|---|---|---|---|---|---|---|---|
| 15342 Wormer | 0.24mi | 2/2.0 | 1,199 (-9%) | 2mo | $65,000 | $54 | 69 |
| 16101 Salem St | 0.42mi | 3/2.0 (+1) | 1,333 (+1%) | 3mo | $70,000 | $53 | 67 |
| 15869 Wormer | 0.19mi | 2/1.0 | 1,508 (+15%) | 7mo | $85,000 | $56 | 60 |
| 16186 Fenton St | 0.36mi | 2/1.0 | 1,488 (+13%) | 4mo | $60,000 | $40 | 58 |
| 24850 Midland | 0.36mi | 3/1.0 (+1) | 1,136 (-14%) | 1mo | $161,500 | $142 | 55 |
| 15711 Wormer | 0.07mi | 3/2.5 (+1) | 1,508 (+15%) | 14mo | $230,000 | $153 | 50 |
| 15552 Dixie | 0.31mi | 3/1.0 (+1) | 1,156 (-12%) | 15mo | $151,000 | $131 | 48 |
| 16166 W Parkway St | 0.68mi | 3/1.0 (+1) | 1,416 (+8%) | 4mo | $35,000 | $25 | 48 |
| 15847 Knight | 0.35mi | 3/2.0 (+1) | 1,452 (+10%) | 14mo | $295,000 | $203 | 46 |
| 15920 Bramell St | 0.74mi | 3/1.0 (+1) | 1,409 (+7%) | 11mo | $55,000 | $39 | 40 |
| 15122 Salem Ct | 0.56mi | 3/1.5 (+1) | 1,139 (-13%) | 13mo | $215,000 | $189 | 34 |
| 16004 Sumner St | 0.73mi | 3/1.0 (+1) | 1,136 (-14%) | 7mo | $155,000 | $136 | 32 |
Match score weights: distance 35% · size 25% · config 20% · recency 20%. Top-matched comps best support the ARV.
Projected returns pro-forma
-3.0% appreciation · 3.25% rent growth · sell at horizon
- IRR
- -14.1%
- Equity multiple
- 0.50×
- Total profit
- $-19,776
- Equity at exit
- $20,860
- IRR
- -4.9%
- Equity multiple
- 0.68×
- Total profit
- $-12,720
- Equity at exit
- $12,096
Cash invested: $39,172 (down + closing). Projections, not guarantees.
Landlord ↔ Tenant lean methodology
- Overall (STATE)
- 62 Landlord-Friendly
- State Michigan
- 62 Landlord-Friendly · EVEN
- County
- — inherits STATE
- City
- — inherits STATE
ZIP-level market 48239
- Rents YoY
- 3.2%
- Active inventory
- 188
- Price-to-rent
- 9.8×
Monthly cashflow live
- Estimated rent
- $1,185 high interval (Pro) →
- Mortgage (P&I)
- −$734
- Tax from tax record
- −$103 /mo · $1,237/yr
- Insurance
- −$58
- HOA
- −$0
- Vacancy / Maint / Mgmt
- −$249
- Net cashflow
- $41
Break-even live
UW: 25.0% down · 7.5% · 30yr · 1.5% tax · 5.0% vac · 8.0% maint · 8.0% mgmt
Financing live
Cash to close
- Down payment
- $34,975
- Closing costs
- $4,197
- Reserves months
- —
- Total cash needed
- —
Loan-product check · same deal, 3 products live
Conventional
25% down · 7.5% · 30yr
- Down + closing
- —
- Monthly P&I
- —
- Monthly cashflow
- —
- DSCR
- —
- Eligible?
- —
Personal DTI + credit; lowest rate.
DSCR
20% down · 8.5% · 30yr
- Down + closing
- —
- Monthly P&I
- —
- Monthly cashflow
- —
- DSCR
- —
- Eligible?
- —
No personal income docs; deal must DSCR.
Hard money
10% down · 12.0% · 12mo
- Down + closing
- —
- Monthly P&I
- —
- Monthly cashflow
- —
- DSCR
- —
- Eligible?
- —
Short-term bridge; refi at stabilization.
Rent comps 40 comps
| Address | Beds | Baths | Sqft | Rent | $/sqft | DOM | Units | Dist |
|---|---|---|---|---|---|---|---|---|
| 15490 Dixie Redford, MI | 3.0 | 1.0 | 912 | $1,600 | $1.75 | 4d | 1 | 0.29mi |
| 16131 Dale St Detroit, MI | 3.0 | 1.0 | 1100 | $1,500 | $1.36 | 17d | 1 | 0.30mi |
| 16207 Woodbine St Detroit, MI | 3.0 | 1.0 | 1000 | $1,294 | $1.29 | 4d | 1 | 0.33mi |
| 16800 Wormer St Detroit, MI | 3.0 | 1.0 | 912 | $1,250 | $1.37 | 17d | 1 | 0.57mi |
| 16896 Salem St Detroit, MI | 3.0 | 1.0 | 1150 | $1,300 | $1.13 | 43d | 1 | 0.73mi |
| 15847 Chatham St Detroit, MI | 3.0 | 1.0 | 909 | $1,325 | $1.46 | 4d | 1 | 0.76mi |
| 17324 Salem St Detroit, MI | 2.0 | 1.0 | 989 | $1,200 | $1.21 | 24d | 1 | 0.97mi |
| 14292 Riverview St Detroit, MI | 2.0 | 1.0 | 900 | $900 | $1.00 | 43d | 1 | 1.00mi |
| 14286 Riverview St Unit HF Detroit, MI | 2.0 | 1.0 | 900 | $900 | $1.00 | 43d | 1 | 1.00mi |
| 14302 Riverview St Detroit, MI | 2.0 | 1.0 | 900 | $900 | $1.00 | 43d | 1 | 1.01mi |
| 14296 Riverview St Detroit, MI | 2.0 | 1.0 | 900 | $985 | $1.09 | 43d | 1 | 1.01mi |
| 14294 Riverview St Detroit, MI | 2.0 | 1.0 | 900 | $900 | $1.00 | 43d | 1 | 1.01mi |
| 14300 Riverview St Detroit, MI | 2.0 | 1.0 | 900 | $985 | $1.09 | 43d | 1 | 1.01mi |
| 14298 Riverview St Detroit, MI | 2.0 | 1.0 | 900 | $985 | $1.09 | 43d | 1 | 1.01mi |
| 14262 Riverview St Detroit, MI | 2.0 | 1.0 | 900 | $985 | $1.09 | 43d | 1 | 1.01mi |
| 14260 Riverview St Detroit, MI | 2.0 | 1.0 | 900 | $900 | $1.00 | 43d | 1 | 1.01mi |
| 14266 Riverview St Detroit, MI | 2.0 | 1.0 | 900 | $900 | $1.00 | 43d | 1 | 1.01mi |
| 14268 Riverview St Detroit, MI | 2.0 | 1.0 | 900 | $850 | $0.94 | 43d | 1 | 1.01mi |
| 14264 Riverview St Detroit, MI | 2.0 | 1.0 | 900 | $900 | $1.00 | 43d | 1 | 1.01mi |
| 14284 Riverview St Detroit, MI | 2.0 | 1.0 | 900 | $985 | $1.09 | 43d | 1 | 1.01mi |
| 14282 Riverview St Detroit, MI | 2.0 | 1.0 | 900 | $800 | $0.89 | 43d | 1 | 1.01mi |
| 14252 Riverview St Detroit, MI | 2.0 | 1.0 | 900 | $985 | $1.09 | 43d | 1 | 1.01mi |
| 14310 Riverview St Detroit, MI | 2.0 | 1.0 | 900 | $900 | $1.00 | 43d | 1 | 1.01mi |
| 14250 Riverview St Detroit, MI | 2.0 | 1.0 | 900 | $900 | $1.00 | 43d | 1 | 1.01mi |
| 14246 Riverview St Unit RB Detroit, MI | 2.0 | 1.0 | 900 | $895 | $0.99 | 43d | 1 | 1.01mi |
| 14246 Riverview St Unit A Detroit, MI | 2.0 | 1.0 | 900 | $985 | $1.09 | 43d | 1 | 1.01mi |
| 14246 Riverview St Detroit, MI | 2.0 | 1.0 | 900 | $900 | $1.00 | 43d | 1 | 1.01mi |
| 14244 Riverview St Detroit, MI | 2.0 | 1.0 | 900 | $900 | $1.00 | 43d | 1 | 1.01mi |
| 14283 Riverview St Detroit, MI | 2.0 | 1.0 | 900 | $900 | $1.00 | 43d | 1 | 1.01mi |
| 14248 Riverview St Detroit, MI | 2.0 | 1.0 | 900 | $985 | $1.09 | 43d | 1 | 1.02mi |
| 14258 Riverview St Detroit, MI | 2.0 | 1.0 | 900 | $900 | $1.00 | 43d | 1 | 1.02mi |
| 14280 Riverview St Detroit, MI | 2.0 | 1.0 | 900 | $985 | $1.09 | 43d | 1 | 1.02mi |
| 14276 Riverview St Detroit, MI | 2.0 | 1.0 | 900 | $900 | $1.00 | 43d | 1 | 1.02mi |
| 14278 Riverview St Detroit, MI | 2.0 | 1.0 | 900 | $900 | $1.00 | 43d | 1 | 1.03mi |
| 14274 Riverview St Detroit, MI | 2.0 | 1.0 | 900 | $900 | $1.00 | 43d | 1 | 1.03mi |
| 14270 Riverview St Detroit, MI | 2.0 | 1.0 | 900 | $900 | $1.00 | 43d | 1 | 1.03mi |
| 14254 Riverview St Detroit, MI | 2.0 | 1.0 | 900 | $985 | $1.09 | 43d | 1 | 1.03mi |
| 14253 Riverview St Detroit, MI | 2.0 | 1.0 | 900 | $985 | $1.09 | 43d | 1 | 1.03mi |
| 14251 Riverview St Detroit, MI | 2.0 | 1.0 | 900 | $985 | $1.09 | 43d | 1 | 1.03mi |
| 14256 Riverview St Detroit, MI | 2.0 | 1.0 | 900 | $985 | $1.09 | 43d | 1 | 1.03mi |
Listing history 36 events
-
2026-06-18days on market $139,900 Active 23 DOM
-
2026-06-17days on market $139,900 Active 22 DOM
-
2026-06-16days on market $139,900 Active 21 DOM
-
2026-06-15days on market $139,900 Active 20 DOM
-
2026-06-13days on market $139,900 Active 18 DOM
-
2026-06-13days on market $139,900 Active 17 DOM
-
2026-06-09days on market $139,900 Active 14 DOM
-
2026-06-08days on market $139,900 Active 13 DOM
-
2026-06-07days on market $139,900 Active 12 DOM
-
2026-06-04days on market $139,900 Active 9 DOM
-
2026-06-03days on market $139,900 Active 8 DOM
-
2026-06-02days on market $139,900 Active 7 DOM
-
2026-06-01remarks 657-char remark
-
2026-06-01days on market $139,900 Active 6 DOM
-
2026-05-31days on market $139,900 Active 5 DOM
-
2026-05-26$139,900 Active
-
2026-05-24$139,900 Active 652-char remark
Show marketing remark (652 chars)
* * * Make this your primary residence or investment property * * * . Conveniently located in Redford near Telegraph, on a corner lot, is this quaint two-bedroom bungalow with a den that has sliding patio doors that lead to the deck in the backyard and the garage. Spacious kitchen. Appliances included. Sorry no basement and no central air. Fresh paint and new carpet throughout. All measurements are estimated, buyer/agent to verify all information. Warranty Deed. Sorry no land contracts. * * This property is also listed for rent (mls# 20261020939), whichever happens first, the other will be withdrawn * * . * Listing broker is the Seller. *
-
2026-05-16$1,350
-
2026-05-16historical $1,350
-
2026-05-16$1,350
-
2026-04-27historical $1,350
-
2026-04-01$1,350
-
2017-11-21soldstatus $264,000
-
2011-05-06soldstatus $14,000 163-char remark
Show marketing remark (163 chars)
HUD Home sold 'As-Is'. FHA #261-879033. FHA insurability code IE, Lead Based Paint notices. Up to 3% commission to selling broker. Access w/ HUD key, show anytime.
-
2011-05-06soldstatus $14,000
Show marketing remark (163 chars)
HUD Home sold 'As-Is'. FHA #261-879033. FHA insurability code IE, Lead Based Paint notices. Up to 3% commission to selling broker. Access w/ HUD key, show anytime.
-
2011-03-18historical 163-char remark
Show marketing remark (163 chars)
HUD Home sold 'As-Is'. FHA #261-879033. FHA insurability code IE, Lead Based Paint notices. Up to 3% commission to selling broker. Access w/ HUD key, show anytime.
-
2011-01-25$14,000 163-char remark
Show marketing remark (163 chars)
HUD Home sold 'As-Is'. FHA #261-879033. FHA insurability code IE, Lead Based Paint notices. Up to 3% commission to selling broker. Access w/ HUD key, show anytime.
-
2011-01-25$14,000
Show marketing remark (163 chars)
HUD Home sold 'As-Is'. FHA #261-879033. FHA insurability code IE, Lead Based Paint notices. Up to 3% commission to selling broker. Access w/ HUD key, show anytime.
-
2010-09-16historical
-
2009-03-31$18,900
-
2009-02-02historical
-
2008-12-09$59,900
-
2006-06-13historical
-
2005-10-19$119,900
-
2000-07-27soldstatus $80,000
-
1997-09-08soldstatus $65,000
ⓘ Source: listings_history table (triggers on properties + properties_extension) + one-shot
backfill from property_details.listing_events for pre-trigger history.
Tax reassessment forecast MI · Partial reset (capped growth)
- Current annual tax
- $1,237 · $103/mo
- Projected year-2 tax
- $1,696 · $141/mo
- Expected delta
- +$459/yr (+$38/mo · 37.1%)
ⓘ Screening estimate from a state-policy table — verify with the county assessor before closing.
Climate risk First Street
- Flood 1/10 Low FEMA zone X (unshaded) · 0% chance over 30 yrs
- Wildfire 1/10 Low
- Heat 3/10 Moderate 7 d/yr ≥98°F today · 15 d/yr by 30 yrs out
- Wind 2/10 Low
- Air quality 3/10 Moderate 2 unhealthy d/yr today · 3 by 30 yrs out
Nearby sold comps map
Loading sold comps map…
Walkable amenities ~0.75 mi
Loading nearby amenities…
Taxation est. · year 1
- Rental income
- $14,220
- − Mortgage interest
- −$7,837
- − Property taxes
- −$1,237
- − Insurance
- −$700
- − Repairs & maintenance
- −$1,138
- − Management
- −$1,138
- − Depreciation
- −$4,070
- Taxable loss
- −$1,898
- Est. tax savings @ 24.0%
- +$455
- After-tax cash flow
- $949/yr
For passive investors: Depreciation is non-cash, so a rental often shows a tax loss while cash-flowing — sheltering income. Rental losses are passive: they offset passive income freely, and up to $25,000/yr can offset ordinary (W-2) income if you actively participate and your MAGI is under $100k (phasing out to $0 by $150k); unused losses carry forward. On sale, claimed depreciation is recaptured at up to 25%, and gains may owe capital-gains tax (a 1031 exchange can defer both). Figures are a year-1 estimate at your 24.0% rate — not tax advice; consult a CPA.
Schools (NCES district)
- District
- Redford Union Schools District No. 1
- NCES district ID
- 2629460
- Math proficiency
- 8% ▼ -6.00%
- Reading proficiency
- 23% ▬ 0.00%
- Median HH income
- $49,778
- Composite
- 14.1/100
- National rank
- #9460
- State rank
- #489 of 540 in MI
Livability — Redford
No livability data for this city. (Only ~50 U.S. cities are tracked.)
Census & demographics
- County
- Wayne County · 1,562,939 people
- City population
- 572,865
- Metro
- Detroit-Warren-Dearborn, MI
- Population (ZIP)
- 36,976
- Household income
- $71,151
- Rent vs Own
- Severe rent burden
- 1052.0
Population outlook (Wayne County) Hauer SSP2
- Today (2025)
- 1,675,273 people
- By 2030
- 1,620,300 · -3.3%
- By 2040
- 1,502,341 · -10.3%
- By 2050
- 1,384,039 · -17.4%
- By 2075
- 1,124,592 · -32.9%
- By 2100
- 881,193 · -47.4%
Race, ethnicity, and origin ACS 2023
- Neighborhood character
- Majority Black (58%)
- Race & ethnicity
- Black 58% White 34% Hispanic / Latino 4% Two or more races 4%
- Common ancestry
- Romanian 7% Slovak 2% Lithuanian 2%
- Foreign-born
- 2% · Canada
- Languages at home
- 96% English-only · Spanish 1% Other Indo-European 1% Arabic 1%
Political lean MEDSL · Wayne
- 2024 margin
- Strong D (+29.0) · D 62.7% · R 33.7% · Other 3.6%
- 2008→2024 swing
- -20.5pp toward R · 2008: 49.5pp · 2024: 29.0pp
- All cycles
- 2024: D+29.0 2020: D+38.1 2016: D+37.3 2012: D+46.9 2008: D+49.5
Not yet ingested
- Civics
- —
Market trends
- HPI YoY
- ▼ -202.97%
- Current HPI
- 236.1136
- Rent YoY
- ▲ 3.25%
- Metro
- Detroit-Warren-Dearborn, MI
- State GDP YoY
- ▲ 1.37%
- F500 in state
- 28
Industry mix (Fortune 500 HQ in MI)
| Industry | F500 HQs | Revenue |
|---|---|---|
| Automotive Parts | 3 | $48B |
|
||
| Automotive | 2 | $372B |
|
||
| Chemicals | 1 | $45B |
|
||
| Automotive Retail | 1 | $29B |
|
||
| Healthcare / Medical Devices | 1 | $23B |
|
||
| Automotive Technology | 1 | $20B |
|
||
Price history
+115.2% since first listed21 events — show timeline
- 2026-05-26 Listed $139,900 REALCOMP
- 2026-05-24 Listed $139,900 MiRealSource-MiMLS
- 2026-05-16 Listed for Rent $1,350 REALSOURCE
- 2026-05-16 Rental Removed $1,350 REALCOMP
- 2026-05-16 Listed for Rent $1,350 REALCOMP
- 2026-04-27 Rental Removed $1,350 REALSOURCE
- 2026-04-01 Listed for Rent $1,350 REALSOURCE
- 2017-11-21 Sold (Public Records) $264,000 Public Records
- 2011-05-06 Sold (MLS) $14,000 REALCOMP
- 2011-05-06 Sold (MLS) $14,000 MiRealSource-MiMLS
- 2011-03-18 Listing Removed — MiRealSource-MiMLS
- 2011-01-25 Listed $14,000 REALCOMP
- 2011-01-25 Listed $14,000 MiRealSource-MiMLS
- 2010-09-16 Listing Removed — REALCOMP
- 2009-03-31 Listed $18,900 REALCOMP
- 2009-02-02 Listing Removed — REALCOMP
- 2008-12-09 Listed $59,900 REALCOMP
- 2006-06-13 Listing Removed — REALCOMP
- 2005-10-19 Listed $119,900 REALCOMP
- 2000-07-27 Sold (Public Records) $80,000 Public Records
- 1997-09-08 Sold (Public Records) $65,000 Public Records
Property tax history
-2.3%/yrLatest (2025): $1,237 · -47.5% YoY. Source: county tax records.
Cash-flow waterfall
monthlySold comps — $/sqft
last 12 mo · ≤1 miLoading sold comps…