 🏷️ Likely Rental
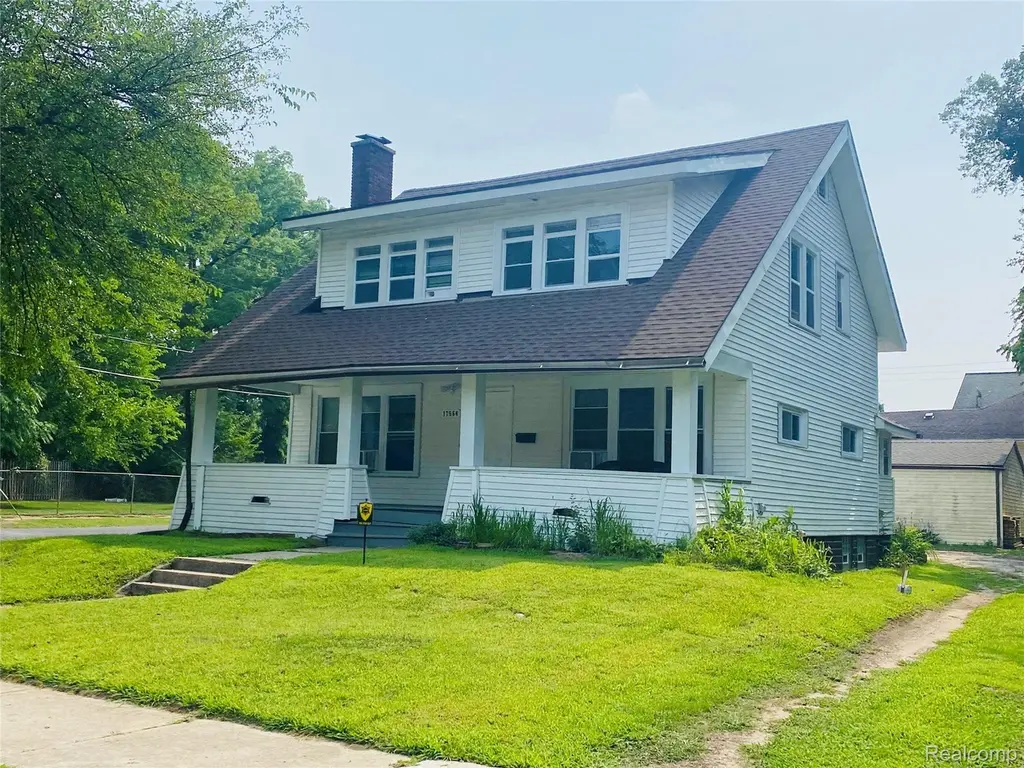
17564 Cooley St · Detroit, MI
Flood risk 7/10 · Major
- FEMA flood zone
- X (unshaded)
- Chance of flooding over 30 yrs
- 0.76%
- Est. flood insurance / yr
- $473 – $860
Fire risk 1/10 · Minimal
- Est. fire insurance / yr
- $784 – $1,456
Heat risk 3/10 · Minor
- Hot days now (above 98°F)
- 7 days/yr
- Hot days in 30 yrs
- 15 days/yr
Wind risk 2/10 · Minimal
- Chance of severe wind over 30 yrs
- —
Air-quality risk 3/10 · Minor
- Unhealthy air days now
- 2 days/yr
- Unhealthy air days in 30 yrs
- 3 days/yr
Risk factors via First Street. Map © Google.
Why this score? — see what drove the B+ grade
The composite is a weighted blend of 9 inputs, each scored 0–100. Each bar is that input's sub-score; the figure is the points it added to the 100-point composite (weight × sub-score).
- Cash flow +30.0/30.0
- ARV discount +15.0/15.0
- 1% rule +10.0/10.0
- DSCR +10.0/10.0
- Rent growth +4.5/5.0
- Livability +3.7/5.0
- Condition / age +2.5/5.0
- Schools +1.3/10.0
- Appreciation +0.0/10.0
$89,900
🖨 Deal sheet (PDF) 📄 Offer letter ✓ Due diligence
Listing remarks MLS
This charming 3-bedroom, 1-bathroom colonial-style single-family home offers immediate income potential in the established Old Redford neighborhood on Detroit's west side. currently rented to a good-paying tenant - perfect for investors seeking turnkey cash flow without the hassle of vacancy. Spacious layout with classic colonial architecture. The property is being sold as-is with a tenant in place - do not disturb Tennant Old Redford is a historic, residential neighborhood known for its walkable streets, brick homes, community feel, and proximity to amenities along Grand River Avenue (shops, the historic Redford Theatre, cafes, and more). The area offers good transit options, a mix of long-term residents, and revitalization potential in northwest Detroit. Convenient access to major roads, the Rouge River greenway, and city-wide opportunities. This is a solid investment opportunity in a buyer-friendly market: turnkey rental income, Contact me today for more details, to review current rental terms, or to schedule a showing (tenant-occupied, so please respect privacy). Let's get this property producing for its next owner!
Key facts
- Good transit options
- Turnkey cash flow
- Rouge river greenway
Tags
Property features AI
Exterior
- Parking: No garage
- Utilities: Public water available; Public sewer available
- Home design: Two-story single-family residence; Ground-level entry with steps
- Construction: Vinyl siding; Brick/mortar foundation
- Exterior features: Paved road access; Lot roughly 50 x 125 (0.14 acres)
Interior
- Bathrooms: One full bathroom
- Heating & cooling: Forced air heating (natural gas); No cooling
- Interior features: 6 total rooms; Unfinished basement
Neighborhood map
What this means for you Summary
Snapshot
- This is a 3-bed/1.5-bath single-family listed at $90k.
Deal economics
- At list price, monthly cash flow is $453 ($5k/yr) — positive.
- The deal already cash-flows at list — no discount required.
- Meets the 1% rule at list price ($1k rent vs $90k).
- Cap rate 13.1% vs local median 10.2% in Detroit — meaningfully above typical; check what's discounted (condition, days-on-market, listing class) to confirm the premium yield is real.
Location & tenants
- Location reads 73/100 on livability (#218 in MI) — a middle-class / working-renter tenant base. Strengths: amenities A+, commute A+, cost of living A+; Watch: schools F, crime F, employment F.
- Detroit Public Schools Community District (urban): math 10% / reading 24% proficiency, ranked #499 of 540 in MI (top 92%) — low school quality limits family demand, transient renter base, plan for 1-2y turnover; 90% free/reduced lunch — lower-income household profile, screen leases tightly.
- Market conditions: Rents rising fast (+8.0%/yr); 305 active listings in the ZIP; 18 comparable units currently listed for rent nearby; rentals lingering (median 45d on market — plan ~5-8 weeks vacancy on turnover, expect pricing pressure); 67% of comp listings sitting > 30 days — soft ceiling on asking rent; lower-income renter base — watch delinquency; 2,639 units permitted in Wayne County in 2024 (1,216 in 5+ unit buildings).
- This rent runs 39% of the median local income ($44k/yr) — at the standard rent-burdened threshold; future hikes will face affordability resistance.
Forward outlook
- Local home prices are declining (-3.0%/yr); year-one equity from $622 of loan paydown is wiped out by about $3k of value loss. Plan a longer hold.
- Wayne County population projected at -17% by 2050 — secular population decline; favor cash flow + early exit over multi-decade hold.
- At projected returns (-3.0% appreciation + 8.0% rent growth), your $25k cash investment doubles in ~5 years — after that, you're playing with house money.
Negotiation context
- Only 4 days on market — expect competitive offers; lowballing is unlikely to land.
- 10 sale attempts since 28y ago with the ask held roughly flat each time — persistent listings suggest the price (not the market) is what's stuck; bring a comps-based counter.
Risks & watch-outs
- Watch-outs: flood insurance adds $56/mo; built in 1918 — expect roof / HVAC / electrical / plumbing capex.
- Climate carrying-cost: major flood risk — expect insurance premiums to compound above CPI over the hold.
Questions for the listing agent
- Built in 1918 — when were the roof, HVAC, electrical panel, plumbing, and water heater last replaced?
- What's the actual annual flood-insurance premium (NFIP or private), and is the property in a SFHA with mandatory coverage?
- Is there a deadline driving the sale (1031 exchange, divorce, estate, relocation)? That informs how much negotiation room exists.
- Schools are F-rated, which usually means shorter tenancies and higher turnover. Who's the typical renter profile here, and what's been the actual vacancy rate?
- Crime grade is F in this area — have there been break-ins, vandalism, or insurance claims at this property in the last 3 years? What carrier currently insures it and at what premium?
- What's the average days-on-market for RENTAL listings here right now (not sales)? A rising rental-DOM trend means longer vacancies and softer asking-rent achievability than the comps imply.
- What's the recent tenant-quality profile in this submarket — average credit score on applications, eviction rate, late-payment / NSF rate, and stable-employment percentage? A property-management company in the area should have these aggregated.
- How much new for-sale + rental construction is in the pipeline within 1–3 miles? Heavy new supply typically softens prices + rents 12–24 months out; constrained supply supports both.
Investment metrics
- 1% rule
- 1.59% ✓
- Cap rate
- 13.08%
- Cash-on-cash
- 24.23%
- DSCR
- 2.08
- GRM
- 5.2
CMA / ARV
- ARV (median comp)
- $130,276
- List price
- $89,900
- Delta
- -30.99%
- Verdict
- UNDERPRICED
- Comps
- 20 within 1.0 mi
Show comp detail 12 sales within ~0.75 mi
| Address | Dist | Beds/Ba | Sqft | Sold | Price | $/sf | Match |
|---|---|---|---|---|---|---|---|
| 18017 Bentler St | 0.33mi | 3/1.0 | 1,548 (-7%) | 19mo | $73,000 | $47 | 55 |
| 17440 Bentler St | 0.35mi | 3/2.0 | 1,792 (+8%) | 18mo | $149,900 | $84 | 54 |
| 22450 Argus Ave | 0.29mi | 3/1.5 | 1,833 (+10%) | 19mo | $168,000 | $92 | 53 |
| 17601 Patton St | 0.73mi | 4/2.0 (+1) | 1,650 (-1%) | 7mo | $220,000 | $133 | 51 |
| 17786 Beaverland St | 0.31mi | 4/1.5 (+1) | 1,886 (+13%) | 12mo | $190,000 | $101 | 48 |
| 18121 Bentler St | 0.36mi | 3/2.0 | 1,426 (-14%) | 14mo | $107,000 | $75 | 46 |
| 16775 Blackstone St | 0.68mi | 3/1.0 | 1,518 (-9%) | 10mo | $79,900 | $53 | 43 |
| 20821 Santa Clara | 0.60mi | 3/1.5 | 1,414 (-15%) | 7mo | $203,000 | $144 | 42 |
| 16753 Burgess | 0.55mi | 4/1.5 (+1) | 1,434 (-14%) | 8mo | $172,500 | $120 | 40 |
| 18517 Burt Rd | 0.72mi | 3/1.5 | 1,863 (+12%) | 9mo | $160,000 | $86 | 39 |
| 16904 Pierson St | 0.75mi | 3/1.0 | 1,512 (-9%) | 16mo | $120,000 | $79 | 34 |
| 18497 Burt Rd | 0.71mi | 3/1.5 | 1,430 (-14%) | 16mo | $80,000 | $56 | 30 |
Match score weights: distance 35% · size 25% · config 20% · recency 20%. Top-matched comps best support the ARV.
Projected returns pro-forma
-3.0% appreciation · 8.0% rent growth · sell at horizon
- IRR
- 20.0%
- Equity multiple
- 1.87×
- Total profit
- $21,883
- Equity at exit
- $13,404
- IRR
- 31.6%
- Equity multiple
- 4.61×
- Total profit
- $90,810
- Equity at exit
- $7,773
Cash invested: $25,172 (down + closing). Projections, not guarantees.
Landlord ↔ Tenant lean methodology
- Overall (STATE)
- 62 Landlord-Friendly
- State Michigan
- 62 Landlord-Friendly · EVEN
- County
- — inherits STATE
- City
- — inherits STATE
ZIP-level market 48219
- Home prices YoY
- -10.3%
- Rents YoY
- 8.0%
- Active inventory
- 305
- Price-to-rent
- 5.2×
Monthly cashflow live
- Estimated rent
- $1,430 high interval (Pro) →
- Mortgage (P&I)
- −$471
- Tax est. 1.5%
- −$112 /mo · $1,348/yr
- Insurance
- −$37
- Flood insurance flood zone
- −$56 /mo · $666/yr
- HOA
- −$0
- Vacancy / Maint / Mgmt
- −$300
- Net cashflow
- $453
Break-even live
Sensitivity live
| Price | -10% $515 | -5% $484 | +0% $453 | +5% $422 | +10% $391 |
|---|---|---|---|---|---|
| Rent | -10% $340 | -5% $396 | +0% $453 | +5% $509 | +10% $566 |
| Rate | -1.0pp $498 | -0.5pp $476 | base $453 | +0.5pp $429 | +1.0pp $406 |
UW: 25.0% down · 7.5% · 30yr · 1.5% tax · 5.0% vac · 8.0% maint · 8.0% mgmt
Financing live
Cash to close
- Down payment
- $22,475
- Closing costs
- $2,697
- Reserves months
- —
- Total cash needed
- —
Loan-product check · same deal, 3 products live
Conventional
25% down · 7.5% · 30yr
- Down + closing
- —
- Monthly P&I
- —
- Monthly cashflow
- —
- DSCR
- —
- Eligible?
- —
Personal DTI + credit; lowest rate.
DSCR
20% down · 8.5% · 30yr
- Down + closing
- —
- Monthly P&I
- —
- Monthly cashflow
- —
- DSCR
- —
- Eligible?
- —
No personal income docs; deal must DSCR.
Hard money
10% down · 12.0% · 12mo
- Down + closing
- —
- Monthly P&I
- —
- Monthly cashflow
- —
- DSCR
- —
- Eligible?
- —
Short-term bridge; refi at stabilization.
Rent comps 18 comps
| Address | Beds | Baths | Sqft | Rent | $/sqft | DOM | Units | Dist |
|---|---|---|---|---|---|---|---|---|
| 17328 McIntyre St Unit 2 Detroit, MI | 3.0 | 1.0 | 1200 | $1,250 | $1.04 | 44d | 1 | 0.27mi |
| 17355 McIntyre St Detroit, MI | 3.0 | 1.0 | 1500 | $1,250 | $0.83 | 44d | 1 | 0.27mi |
| 17255 Westbrook St Detroit, MI | 3.0 | 2.0 | 1500 | $1,450 | $0.97 | 12d | 1 | 0.47mi |
| 16717 Trinity St Detroit, MI | 3.0 | 1.5 | 1101 | $1,250 | $1.14 | 44d | 1 | 0.75mi |
| 16565 Blackstone St Detroit, MI | 3.0 | 1.5 | 1592 | $1,575 | $0.99 | 44d | 1 | 0.78mi |
| 17624 Patton St Detroit, MI | 3.0 | 1.0 | 1260 | $1,695 | $1.35 | 44d | 1 | 0.79mi |
| 19501 Redfern St Detroit, MI | 2.0 | 1.5 | 1816 | $1,350 | $0.74 | 44d | 1 | 1.05mi |
| 18134 Vaughan St Detroit, MI | 3.0 | 1.0 | 1060 | $1,150 | $1.08 | 17d | 1 | 1.08mi |
| 16131 Dale St Detroit, MI | 3.0 | 1.0 | 1100 | $1,500 | $1.36 | 18d | 1 | 1.11mi |
| 22649 Frisbee St Detroit, MI | 3.0 | 1.0 | 1100 | $1,495 | $1.36 | 44d | 1 | 1.17mi |
| 22238 Pembroke Ave Detroit, MI | 3.0 | 1.5 | 1100 | $1,500 | $1.36 | 44d | 1 | 1.21mi |
| 19810 Blackstone St Detroit, MI | 3.0 | 1.0 | 1216 | $1,395 | $1.15 | 44d | 1 | 1.28mi |
| 16896 Salem St Detroit, MI | 3.0 | 1.0 | 1150 | $1,300 | $1.13 | 44d | 1 | 1.33mi |
| 17678 Edinborough Rd Detroit, MI | 3.0 | 1.5 | 1528 | $1,650 | $1.08 | 17d | 1 | 1.35mi |
| 17678 Edinborough Rd Detroit, MI | 3.0 | 1.5 | 1528 | $1,650 | $1.08 | 15d | 1 | 1.35mi |
| 15815 Evergreen Rd Detroit, MI | 3.0 | 1.0 | 1350 | $1,300 | $0.96 | 44d | 1 | 1.42mi |
| 19457 Evergreen Rd Detroit, MI | 2.0 | 1.0 | 1100 | $1,200 | $1.09 | 44d | 1 | 1.48mi |
| 15712 Vaughan St Detroit, MI | 3.0 | 1.0 | 1280 | $1,400 | $1.09 | 15d | 1 | 1.48mi |
Listing history 42 events
-
2026-06-18days on market $89,900 Active 4 DOM
-
2026-06-17days on market $89,900 Active 3 DOM
-
2026-06-16days on market $89,900 Active 2 DOM
-
2026-06-15$89,900 Active 1 DOM
-
2026-06-15remarks 699-char remark
-
2026-06-15days on market $89,900 Active 1 DOM
-
2026-06-13days on market $89,900 Active 313 DOM
-
2026-06-13days on market $89,900 Active 312 DOM
-
2026-06-09days on market $89,900 Active 309 DOM
-
2026-06-08days on market $89,900 Active 308 DOM
-
2026-06-07days on market $89,900 Active 307 DOM
-
2026-06-04days on market $89,900 Active 304 DOM
-
2026-06-03days on market $89,900 Active 303 DOM
-
2026-06-01days on market $89,900 Active 301 DOM
-
2026-05-31days on market $89,900 Active 300 DOM
-
2026-04-22price $89,900 232-char remark
-
2026-04-22price $89,900 232-char remark
-
2026-03-20price $90,900 232-char remark
-
2026-03-19price $90,900 232-char remark
-
2026-02-18price $94,900 232-char remark
-
2026-02-18price $94,900 232-char remark
-
2025-12-27price $96,900 232-char remark
-
2025-12-26price $96,900 232-char remark
-
2025-12-02price $97,990 232-char remark
-
2025-12-01price $97,990 232-char remark
-
2025-08-04$100,000 Active 232-char remark
-
2025-08-04$100,000 Active 232-char remark
-
2022-02-25soldstatus $91,900
-
2020-07-28historical
-
2020-07-28historical
-
2020-06-02$39,900 Active
-
2020-06-02$39,900 Active
-
2012-03-21historical
-
2012-03-21historical
-
2012-01-21$10,000
-
2012-01-21$10,000
-
2007-06-04soldstatus $74,900
-
2007-04-02$74,900
-
1998-11-17soldstatus $89,900
-
1998-10-07soldstatus $89,900
-
1998-08-06soldstatus $35,000
-
1998-07-14$89,900
ⓘ Source: listings_history table (triggers on properties + properties_extension) + one-shot
backfill from property_details.listing_events for pre-trigger history.
Climate risk First Street
- Flood 7/10 Severe FEMA zone X (unshaded) · 76% chance over 30 yrs
- Wildfire 1/10 Low
- Heat 3/10 Moderate 7 d/yr ≥98°F today · 15 d/yr by 30 yrs out
- Wind 2/10 Low
- Air quality 3/10 Moderate 2 unhealthy d/yr today · 3 by 30 yrs out
Nearby sold comps map
Loading sold comps map…
Walkable amenities ~0.75 mi
Loading nearby amenities…
Taxation est. · year 1
- Rental income
- $17,159
- − Mortgage interest
- −$5,036
- − Property taxes
- −$1,348
- − Insurance
- −$1,116
- − Repairs & maintenance
- −$1,373
- − Management
- −$1,373
- − Depreciation
- −$2,615
- Taxable income
- $4,298
- Est. tax owed @ 24.0%
- −$1,031
- After-tax cash flow
- $4,402/yr
For passive investors: Depreciation is non-cash, so a rental often shows a tax loss while cash-flowing — sheltering income. Rental losses are passive: they offset passive income freely, and up to $25,000/yr can offset ordinary (W-2) income if you actively participate and your MAGI is under $100k (phasing out to $0 by $150k); unused losses carry forward. On sale, claimed depreciation is recaptured at up to 25%, and gains may owe capital-gains tax (a 1031 exchange can defer both). Figures are a year-1 estimate at your 24.0% rate — not tax advice; consult a CPA.
Schools (NCES district)
- District
- Detroit Public Schools Community District
- NCES district ID
- 2601103
- Math proficiency
- 10% ▼ -2.00%
- Reading proficiency
- 24% ▲ 6.00%
- Median HH income
- $25,815
- Composite
- 13.06/100
- National rank
- #9564
- State rank
- #499 of 540 in MI
Livability — Detroit
- Score
- 73/100
- State rank
- #218
- US rank
- #5427
Category grades
Schools grade is shown separately in the Schools card above.
Census & demographics
- Census place
- Detroit, MI
- County
- Wayne County · 1,562,939 people
- City population
- 572,865
- Metro
- Detroit-Warren-Dearborn, MI
- Population (ZIP)
- 47,208
- Household income
- $43,655
- Rent vs Own
- Severe rent burden
- 3584.0
Population outlook (Wayne County) Hauer SSP2
- Today (2025)
- 1,675,273 people
- By 2030
- 1,620,300 · -3.3%
- By 2040
- 1,502,341 · -10.3%
- By 2050
- 1,384,039 · -17.4%
- By 2075
- 1,124,592 · -32.9%
- By 2100
- 881,193 · -47.4%
Race, ethnicity, and origin ACS 2023
- Neighborhood character
- Predominantly Black (88%)
- Race & ethnicity
- Black 88% White 5% Two or more races 4% Hispanic / Latino 1%
- Common ancestry
- Romanian 1% Lithuanian 1%
- Foreign-born
- 2% · Canada
- Languages at home
- 96% English-only · Spanish 1% French/Haitian/Cajun 1%
Political lean MEDSL · Wayne
- 2024 margin
- Strong D (+29.0) · D 62.7% · R 33.7% · Other 3.6%
- 2008→2024 swing
- -20.5pp toward R · 2008: 49.5pp · 2024: 29.0pp
- All cycles
- 2024: D+29.0 2020: D+38.1 2016: D+37.3 2012: D+46.9 2008: D+49.5
Not yet ingested
- Civics
- —
Market trends
- HPI YoY
- ▼ -65.06%
- Current HPI
- 563.3263
- Rent YoY
- ▲ 8.04%
- Metro
- Detroit-Warren-Dearborn, MI
- State GDP YoY
- ▲ 1.37%
- F500 in state
- 28
Industry mix (Fortune 500 HQ in MI)
| Industry | F500 HQs | Revenue |
|---|---|---|
| Automotive Parts | 3 | $48B |
|
||
| Automotive | 2 | $372B |
|
||
| Chemicals | 1 | $45B |
|
||
| Automotive Retail | 1 | $29B |
|
||
| Healthcare / Medical Devices | 1 | $23B |
|
||
| Automotive Technology | 1 | $20B |
|
||
Price history
+0.0% since first listed31 events — show timeline
- 2026-06-14 Listing Removed — MiRealSource-MiMLS
- 2026-06-14 Listed $89,900 MiRealSource-MiMLS
- 2026-06-14 Listed $89,900 REALCOMP
- 2026-06-14 Listing Removed — REALCOMP
- 2026-04-22 Price Changed $89,900 MiRealSource-MiMLS
- 2026-04-22 Price Changed $89,900 REALCOMP
- 2026-03-20 Price Changed $90,900 MiRealSource-MiMLS
- 2026-03-19 Price Changed $90,900 REALCOMP
- 2026-02-18 Price Changed $94,900 MiRealSource-MiMLS
- 2026-02-18 Price Changed $94,900 REALCOMP
- 2025-12-27 Price Changed $96,900 MiRealSource-MiMLS
- 2025-12-26 Price Changed $96,900 REALCOMP
- 2025-12-02 Price Changed $97,990 MiRealSource-MiMLS
- 2025-12-01 Price Changed $97,990 REALCOMP
- 2025-08-04 Listed $100,000 REALCOMP
- 2025-08-04 Listed $100,000 MiRealSource-MiMLS
- 2022-02-25 Sold (Public Records) $91,900 Public Records
- 2020-07-28 Listing Removed — REALCOMP
- 2020-07-28 Listing Removed — MiRealSource-MiMLS
- 2020-06-02 Listed $39,900 MiRealSource-MiMLS
- 2020-06-02 Listed $39,900 REALCOMP
- 2012-03-21 Listing Removed — REALCOMP
- 2012-03-21 Listing Removed — MiRealSource-MiMLS
- 2012-01-21 Listed $10,000 REALCOMP
- 2012-01-21 Listed $10,000 MiRealSource-MiMLS
- 2007-06-04 Sold (MLS) $74,900 REALCOMP
- 2007-04-02 Listed $74,900 REALCOMP
- 1998-11-17 Sold (Public Records) $89,900 Public Records
- 1998-10-07 Sold (MLS) $89,900 REALCOMP
- 1998-08-06 Sold (Public Records) $35,000 Public Records
- 1998-07-14 Listed $89,900 REALCOMP
Property tax history
+11.3%/yrLatest (2025): $4,737 · +97.7% YoY. Source: county tax records.
Cash-flow waterfall
monthlySold comps — $/sqft
last 12 mo · ≤1 miLoading sold comps…