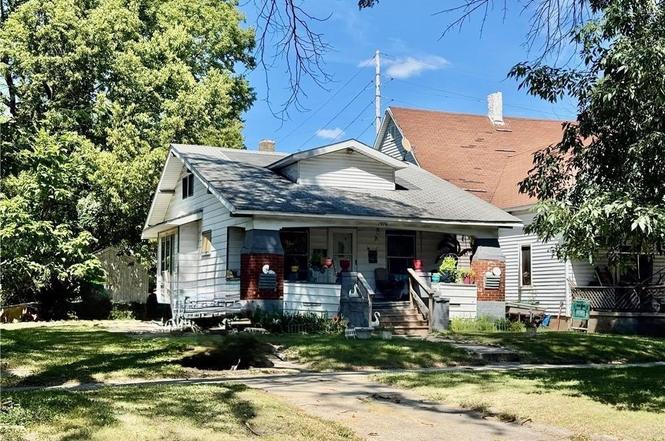
1976 E William St · Decatur, IL
Flood risk 1/10 · Minimal
- FEMA flood zone
- X (unshaded)
- Chance of flooding over 30 yrs
- 0.0%
- Est. flood insurance / yr
- $473 – $860
Fire risk 1/10 · Minimal
- Est. fire insurance / yr
- $804 – $1,492
Heat risk 3/10 · Minor
- Hot days now (above 106°F)
- 7 days/yr
- Hot days in 30 yrs
- 18 days/yr
Wind risk 2/10 · Minimal
- Chance of severe wind over 30 yrs
- 1.0%
Air-quality risk 2/10 · Minimal
- Unhealthy air days now
- 1 days/yr
- Unhealthy air days in 30 yrs
- 1 days/yr
Risk factors via First Street. Map © Google.
Why this score? — see what drove the B- grade
The composite is a weighted blend of 9 inputs, each scored 0–100. Each bar is that input's sub-score; the figure is the points it added to the 100-point composite (weight × sub-score).
- Cash flow +30.0/30.0
- 1% rule +10.0/10.0
- DSCR +10.0/10.0
- ARV discount +7.5/15.0
- Livability +3.0/5.0
- Rent growth +2.5/5.0
- Condition / age +2.5/5.0
- Schools +0.4/10.0
- Appreciation +0.0/10.0
$38,897
🖨 Deal sheet 📄 Offer letter ✓ Due diligence
Listing remarks
2 BEDROOM 1 BATH. NEWER TUB AND SURROUND, FRONT STAIRS, FLOORING & HOT WATER. CURRENTLY USED AS A RENTAL PROPERTY, PLEASE INQUIRE WITH AGENT FOR MORE DETAILS. CAN ALSO BE SOLD IN PKG @ $275,897 - 6 PROPERTIES - 2152 E DECATUR; 2038 E WHITMER; 1720 N GULICK; 936 E MOORE; 621 E SAWYER; 1976 E WILLIAM.
Key facts
- 3,485 sq ft lot
- Built 1922
- Listed 2 days
Property features AI
Exterior
- Utilities: Public water; Public sewer
- Home design: Single family residence; One story
- Construction: Vinyl siding
- Exterior features: Asphalt roof; Gravel road access
Interior
- Kitchen: Range; Refrigerator
- Bathrooms: 1 full bathroom
- Heating & cooling: Natural gas heating; Has cooling (type: Other)
- Interior features: Gas water heater; Range; Refrigerator; Full unfinished basement
Neighborhood map
What this means for you Summary
Snapshot
- This is a 2-bed/1.0-bath other listed at $39k.
Deal economics
- At list price, monthly cash flow is $449 ($5k/yr) — positive.
- The deal already cash-flows at list — no discount required.
- Meets the 1% rule at list price ($909 rent vs $39k).
- Cap rate 20.2% vs local median 7.0% in Decatur — top-decile yield for the area; either an underpriced asset or a hidden risk that comps aren't pricing in. Stress-test before assuming the spread holds.
Location & tenants
- Location reads 59/100 on livability (#1,076 in IL) — a working-class tenant base; expect higher turnover. Strengths: cost of living A+, housing A+; Watch: schools F, crime F, amenities F.
- Decatur SD 61 (urban): math 3% / reading 6% proficiency, ranked #605 of 620 in IL (top 98%) — low school quality limits family demand, transient renter base, plan for 1-2y turnover; 73% free/reduced lunch — lower-income household profile, screen leases tightly.
- Market conditions: 193 active listings in the ZIP; 14 comparable units currently listed for rent nearby; rentals lingering (median 44d on market — plan ~5-8 weeks vacancy on turnover, expect pricing pressure); 93% of comp listings sitting > 30 days — soft ceiling on asking rent; 63 units permitted in Macon County in 2024 (0 in 5+ unit buildings).
- This rent is only 16% of the median local income ($66k/yr) — well below the 30% rent-burden line; pricing power to push rent on renewal without tenant pushback.
Forward outlook
- Local home prices are declining (-3.0%/yr); year-one equity from $269 of loan paydown is wiped out by about $1k of value loss. Plan a longer hold.
- Macon County population projected at -24% by 2050 — secular population decline; favor cash flow + early exit over multi-decade hold.
- At projected returns (-3.0% appreciation + 3.0% rent growth), your $11k cash investment doubles in ~3 years — after that, you're playing with house money.
Negotiation context
- Only 3 days on market — expect competitive offers; lowballing is unlikely to land.
- Current owner paid $16k; list at $39k implies a 143% gain — meaningful room to come down on a strong offer.
Risks & watch-outs
- Watch-outs: built in 1922 — expect roof / HVAC / electrical / plumbing capex.
Questions for the listing agent
- Built in 1922 — when were the roof, HVAC, electrical panel, plumbing, and water heater last replaced?
- Is there a deadline driving the sale (1031 exchange, divorce, estate, relocation)? That informs how much negotiation room exists.
- Schools are F-rated, which usually means shorter tenancies and higher turnover. Who's the typical renter profile here, and what's been the actual vacancy rate?
- Crime grade is F in this area — have there been break-ins, vandalism, or insurance claims at this property in the last 3 years? What carrier currently insures it and at what premium?
- What's the average days-on-market for RENTAL listings here right now (not sales)? A rising rental-DOM trend means longer vacancies and softer asking-rent achievability than the comps imply.
- What's the recent tenant-quality profile in this submarket — average credit score on applications, eviction rate, late-payment / NSF rate, and stable-employment percentage? A property-management company in the area should have these aggregated.
- How much new for-sale + rental construction is in the pipeline within 1–3 miles? Heavy new supply typically softens prices + rents 12–24 months out; constrained supply supports both.
Investment metrics
- 1% rule
- 2.34% ✓
- Cap rate
- 20.15%
- Cash-on-cash
- 49.50%
- DSCR
- 3.20
- GRM
- 3.6
CMA / ARV
No comps found within radius.
Projected returns pro-forma
-3.0% appreciation · 3.0% rent growth · sell at horizon
- IRR
- 47.2%
- Equity multiple
- 3.05×
- Total profit
- $22,324
- Equity at exit
- $5,800
- IRR
- 52.9%
- Equity multiple
- 6.17×
- Total profit
- $56,339
- Equity at exit
- $3,363
Cash invested: $10,891 (down + closing). Projections, not guarantees.
Landlord ↔ Tenant lean methodology
- Overall (STATE)
- 43 Moderately Tenant-Leaning
- State Illinois
- 43 Moderately Tenant-Leaning · D+7
- County
- — inherits STATE
- City
- — inherits STATE
ZIP-level market 62521
- Home prices YoY
- -9.0%
- Active inventory
- 193
- Price-to-rent
- 3.6×
Monthly cashflow live
- Estimated rent
- $909 high interval (Pro) →
- Mortgage (P&I)
- −$204
- Tax from tax record
- −$49 /mo · $587/yr
- Insurance
- −$16
- HOA
- −$0
- Vacancy / Maint / Mgmt
- −$191
- Net cashflow
- $449
Break-even live
UW: 25.0% down · 7.5% · 30yr · 1.5% tax · 5.0% vac · 8.0% maint · 8.0% mgmt
Financing live
Cash to close
- Down payment
- $9,724
- Closing costs
- $1,167
- Reserves months
- —
- Total cash needed
- —
Loan-product check · same deal, 3 products live
Conventional
25% down · 7.5% · 30yr
- Down + closing
- —
- Monthly P&I
- —
- Monthly cashflow
- —
- DSCR
- —
- Eligible?
- —
Personal DTI + credit; lowest rate.
DSCR
20% down · 8.5% · 30yr
- Down + closing
- —
- Monthly P&I
- —
- Monthly cashflow
- —
- DSCR
- —
- Eligible?
- —
No personal income docs; deal must DSCR.
Hard money
10% down · 12.0% · 12mo
- Down + closing
- —
- Monthly P&I
- —
- Monthly cashflow
- —
- DSCR
- —
- Eligible?
- —
Short-term bridge; refi at stabilization.
Rent comps 14 comps
| Address | Beds | Baths | Sqft | Rent | $/sqft | DOM | Units | Dist |
|---|---|---|---|---|---|---|---|---|
| 2032 E North St Decatur, IL | 2.0 | 1.0 | 754 | $900 | $1.19 | 43d | 1 | 0.08mi |
| 249 N 17th St Decatur, IL | 3.0 | 2.0 | 700 | $995 | $1.42 | 43d | 1 | 0.24mi |
| 347 N Stone St Decatur, IL | 2.0 | 1.0 | 850 | $875 | $1.03 | 43d | 1 | 0.43mi |
| 165 S East Ave Unit NA Decatur, IL | 2.0 | 1.0 | 850 | $800 | $0.94 | 43d | 1 | 0.44mi |
| 2448 E Wood St Decatur, IL | 3.0 | 1.0 | 800 | $995 | $1.24 | 13d | 1 | 0.63mi |
| 1237 E Johns Ave Decatur, IL | 2.0 | 1.0 | 1000 | $895 | $0.90 | 43d | 1 | 0.67mi |
| 1245 Sedgwick St Decatur, IL | 2.0 | 1.0 | 1055 | $895 | $0.85 | 43d | 1 | 0.71mi |
| 1304 E Lawrence St Decatur, IL | 2.0 | 1.0 | 850 | $850 | $1.00 | 43d | 1 | 0.77mi |
| 1455 E Whitmer St Decatur, IL | 2.0 | 1.0 | 1050 | $915 | $0.87 | 43d | 1 | 0.77mi |
| 698 S Stone St Decatur, IL | 2.0 | 1.0 | 900 | $795 | $0.88 | 43d | 1 | 0.78mi |
| 1718 E Cantrell St Decatur, IL | 3.0 | 2.0 | 900 | $1,000 | $1.11 | 43d | 1 | 0.79mi |
| 1729 N Woodford St Decatur, IL | 2.0 | 1.0 | 728 | $825 | $1.13 | 43d | 1 | 1.08mi |
| 759 E Lawrence St Decatur, IL | 3.0 | 1.0 | 1080 | $695 | $0.64 | 43d | 1 | 1.10mi |
| 803 E Whitmer St Decatur, IL | 3.0 | 1.0 | 900 | $935 | $1.04 | 43d | 1 | 1.12mi |
Listing history 5 events
-
2026-06-19days on market $38,897 Active 3 DOM
-
2026-06-18remarks 302-char remark
-
2026-06-18days on market $38,897 Active 2 DOM
-
2026-06-17remarks 160-char remark
-
2026-06-17$38,897 Active 1 DOM
ⓘ Source: listings_history table (triggers on properties + properties_extension) + one-shot
backfill from property_details.listing_events for pre-trigger history.
Tax reassessment forecast IL · Partial reset (capped growth)
- Current annual tax
- $587 · $49/mo
- Projected year-2 tax
- $735 · $61/mo
- Expected delta
- +$148/yr (+$12/mo · 25.2%)
ⓘ Screening estimate from a state-policy table — verify with the county assessor before closing.
Climate risk First Street
- Flood 1/10 Low FEMA zone X (unshaded) · 0% chance over 30 yrs
- Wildfire 1/10 Low
- Heat 3/10 Moderate 7 d/yr ≥106°F today · 18 d/yr by 30 yrs out
- Wind 2/10 Low 100% chance of damaging wind over 30 yrs
- Air quality 2/10 Low 1 unhealthy d/yr today · 1 by 30 yrs out
Nearby sold comps map
Loading sold comps map…
Walkable amenities ~0.75 mi
Loading nearby amenities…
Taxation est. · year 1
- Rental income
- $10,912
- − Mortgage interest
- −$2,179
- − Property taxes
- −$587
- − Insurance
- −$194
- − Repairs & maintenance
- −$873
- − Management
- −$873
- − Depreciation
- −$1,132
- Taxable income
- $5,074
- Est. tax owed @ 24.0%
- −$1,218
- After-tax cash flow
- $4,173/yr
For passive investors: Depreciation is non-cash, so a rental often shows a tax loss while cash-flowing — sheltering income. Rental losses are passive: they offset passive income freely, and up to $25,000/yr can offset ordinary (W-2) income if you actively participate and your MAGI is under $100k (phasing out to $0 by $150k); unused losses carry forward. On sale, claimed depreciation is recaptured at up to 25%, and gains may owe capital-gains tax (a 1031 exchange can defer both). Figures are a year-1 estimate at your 24.0% rate — not tax advice; consult a CPA.
Schools (NCES district)
- District
- Decatur SD 61
- NCES district ID
- 1711850
- Math proficiency
- 3% ▼ -4.00%
- Reading proficiency
- 6% ▼ -6.00%
- Median HH income
- $38,864
- Composite
- 3.99/100
- National rank
- #10059
- State rank
- #605 of 620 in IL
Livability — Decatur
- Score
- 59/100
- State rank
- #1076
- US rank
- #20533
Category grades
Schools grade is shown separately in the Schools card above.
Census & demographics
- Census place
- Decatur, IL
- County
- Macon County · 78,333 people
- City population
- 78,333
- Metro
- Decatur, IL
- Population (ZIP)
- 32,665
- Household income
- $66,337
- Rent vs Own
- Severe rent burden
- 640.0
Population outlook (Macon County) Hauer SSP2
- Today (2025)
- 99,568 people
- By 2030
- 94,973 · -4.6%
- By 2040
- 85,250 · -14.4%
- By 2050
- 75,920 · -23.8%
- By 2075
- 55,962 · -43.8%
- By 2100
- 36,468 · -63.4%
Race, ethnicity, and origin ACS 2023
- Neighborhood character
- Predominantly White (75%)
- Race & ethnicity
- White 75% Black 17% Two or more races 5% Hispanic / Latino 3%
- Common ancestry
- Slovak 3% Romanian 2% Lithuanian 2%
- Foreign-born
- 3% · Canada
- Languages at home
- 96% English-only · Spanish 2% Russian/Polish/Slavic 1% Other Indo-European 0%
Political lean MEDSL · Macon
- 2024 margin
- R (+18.9) · D 39.8% · R 58.7% · Other 1.4%
- 2008→2024 swing
- -20.0pp toward R · 2008: 1.1pp · 2024: -18.9pp
- All cycles
- 2024: R+18.9 2020: R+17.7 2016: R+18.1 2012: R+5.2 2008: D+1.1
Not yet ingested
- Civics
- —
Market trends
- HPI YoY
- ▼ -17.96%
- Current HPI
- 180.9274
- Rent YoY
- —
- Metro
- Decatur, IL
- State GDP YoY
- ▲ 1.59%
- F500 in state
- 60
Industry mix (Fortune 500 HQ in IL)
| Industry | F500 HQs | Revenue |
|---|---|---|
| Insurance | 4 | $201B |
|
||
| Consumer Goods | 4 | $87B |
|
||
| Industrial Machinery | 3 | $64B |
|
||
| Healthcare | 2 | $55B |
|
||
| Retail / Pharmacy | 1 | $148B |
|
||
| Agriculture / Food | 1 | $86B |
|
||
Price history
+691.1% since first listed3 events — show timeline
- 2026-06-16 Listed $38,897 CIBR
- 2017-10-30 Sold (Public Records) $16,000 Public Records
- 2016-07-26 Sold (Public Records) $4,917 Public Records
Property tax history
-1.0%/yrLatest (2024): $587 · +0.8% YoY. Source: county tax records.
Cash-flow waterfall
monthlySold comps — $/sqft
last 12 mo · ≤1 miLoading sold comps…