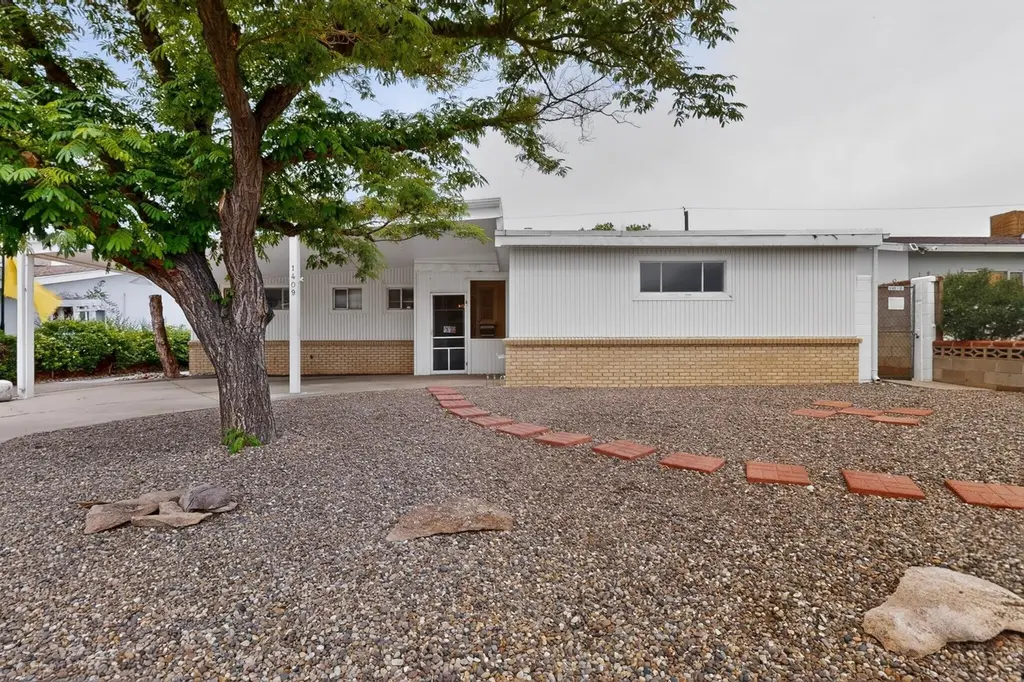
1409 Marcella St NE · Albuquerque, NM
Flood risk 1/10 · Minimal
- FEMA flood zone
- X (unshaded)
- Chance of flooding over 30 yrs
- 0.0%
- Est. flood insurance / yr
- $507 – $1,088
Fire risk 1/10 · Minimal
- Est. fire insurance / yr
- $706 – $1,312
Heat risk 4/10 · Minor
- Hot days now (above 94°F)
- 6 days/yr
- Hot days in 30 yrs
- 15 days/yr
Wind risk 1/10 · Minimal
- Chance of severe wind over 30 yrs
- —
Air-quality risk 1/10 · Minimal
- Unhealthy air days now
- 0 days/yr
- Unhealthy air days in 30 yrs
- 0 days/yr
Risk factors via First Street. Map © Google.
Why this score? — see what drove the C- grade
The composite is a weighted blend of 9 inputs, each scored 0–100. Each bar is that input's sub-score; the figure is the points it added to the 100-point composite (weight × sub-score).
- Cash flow +14.5/30.0
- ARV discount +14.4/15.0
- Schools +5.3/10.0
- DSCR +4.4/10.0
- Rent growth +3.6/5.0
- Livability +3.6/5.0
- 1% rule +3.4/10.0
- Condition / age +2.5/5.0
- Appreciation +0.0/10.0
$255,000
🖨 Deal sheet (PDF) 📄 Offer letter ✓ Due diligence
Listing remarks
Step into this well maintained 4 bedroom, 2 bath home offering apx 1,600 sq ft of comfortable living space and endless potential. A welcoming vestibule entry sets the tone, leading into a warm and functional layout. The cozy wood burning fireplace and unique kitchen bar are perfect for entertaining or casual dining. The converted garage is flexible space for an office, workshop or extra storage, with the option to convert it back to a traditional garage if desired. Outside, enjoy a covered patio and low maintenance backyard complete with a storage shed and classic metal window awnings that add character and efficiency. Full of charm and ready for your personal refresh, this home is being so
Key facts
- Unique kitchen bar
- Converted garage
- Covered patio
Tags
Property features AI
Exterior
- Parking: Attached garage (converted; includes workshop space) with 1 garage space
- Utilities: Electricity connected; Natural gas connected; Public water; Public sewer
- Home design: Single-story home; Faces east; Resale property
- Construction: Board and batten siding; Brick veneer; Stucco exterior; Metal and tar/gravel roof
- Exterior features: Private yard; Covered, screened patio; Shed(s); Wall fencing; City street frontage (paved)
Interior
- Kitchen: Free-standing electric range; Microwave; Refrigerator
- Bedrooms: Primary bedroom on the main level
- Flooring: Carpet; Vinyl
- Bathrooms: 1 full bathroom; 1 three-quarter bathroom
- Heating & cooling: Forced air heating (natural gas); Evaporative cooling
- Interior features: Breakfast bar and breakfast area; Ceiling fan(s); Main level primary; Shower only with separate shower; Casement windows; Single-pane windows
- Laundry & utility: Electric dryer hookup
Neighborhood map
What this means for you Summary
Snapshot
- This is a 4-bed/2.0-bath single-family listed at $255k.
Deal economics
- At list price, monthly cash flow is $56 ($666/yr) — positive.
- The deal already cash-flows at list — no discount required.
- To meet the 1% rule (rent ≥ 1% of price), the offer needs to be $213k (16.3% below list).
- Recommended offer: $213k (16.3% below list) — sets the bar for 1% rule.
- Cap rate 6.6% vs local median 3.7% in Albuquerque — top-decile yield for the area; either an underpriced asset or a hidden risk that comps aren't pricing in. Stress-test before assuming the spread holds.
Location & tenants
- Location reads 72/100 on livability (#13 in NM) — a middle-class / working-renter tenant base. Strengths: amenities A+, commute A+, cost of living A+; Watch: schools D-, crime F.
- Albuquerque Public Schools (urban): math 51% / reading 75% proficiency, ranked #3 of 29 in NM (top 10%) — acceptable for families but not a draw, mixed tenant base, ~2y average lease; 60% free/reduced lunch — lower-income household profile, screen leases tightly.
- Market conditions: Rents rising fast (+4.3%/yr); 169 active listings in the ZIP; 20 comparable units currently listed for rent nearby; rentals at typical pace (median 24d on market — plan ~3-4 weeks tenant-placement turnaround); 1,316 units permitted in Bernalillo County in 2024 (546 in 5+ unit buildings).
- This rent runs 35% of the median local income ($74k/yr) — at the standard rent-burdened threshold; future hikes will face affordability resistance.
Forward outlook
- Local home prices are declining (-3.0%/yr); year-one equity from $2k of loan paydown is wiped out by about $8k of value loss. Plan a longer hold.
Negotiation context
- Only 10 days on market — expect competitive offers; lowballing is unlikely to land.
- 2 sale attempts; this cycle's ask has dropped $15k (6%) from the opening price — seller is motivated, your offer sets the floor, not the list.
Risks & watch-outs
- Watch-outs: built in 1958 — expect roof / HVAC / electrical / plumbing capex.
Questions for the listing agent
- Built in 1958 — when were the roof, HVAC, electrical panel, plumbing, and water heater last replaced?
- Is there a deadline driving the sale (1031 exchange, divorce, estate, relocation)? That informs how much negotiation room exists.
- Schools are D-rated, which usually means shorter tenancies and higher turnover. Who's the typical renter profile here, and what's been the actual vacancy rate?
- Crime grade is F in this area — have there been break-ins, vandalism, or insurance claims at this property in the last 3 years? What carrier currently insures it and at what premium?
- What's the average days-on-market for RENTAL listings here right now (not sales)? A rising rental-DOM trend means longer vacancies and softer asking-rent achievability than the comps imply.
- What's the recent tenant-quality profile in this submarket — average credit score on applications, eviction rate, late-payment / NSF rate, and stable-employment percentage? A property-management company in the area should have these aggregated.
- How much new for-sale + rental construction is in the pipeline within 1–3 miles? Heavy new supply typically softens prices + rents 12–24 months out; constrained supply supports both.
Investment metrics
- 1% rule
- 0.84% ✗
- Cap rate
- 6.55%
- Cash-on-cash
- 0.93%
- DSCR
- 1.04
- GRM
- 10.0
CMA / ARV
- ARV (median comp)
- $300,897
- List price
- $255,000
- Delta
- -15.25%
- Verdict
- UNDERPRICED
- Comps
- 20 within 1.0 mi
Show comp detail 12 sales within ~0.75 mi
| Address | Dist | Beds/Ba | Sqft | Sold | Price | $/sf | Match |
|---|---|---|---|---|---|---|---|
| 1113 June St NE | 0.31mi | 3/2.0 (-1) | 1,387 (+0%) | 2mo | $289,000 | $208 | 79 |
| 1833 Britt St NE | 0.70mi | 4/2.0 | 1,380 (-0%) | 5mo | $295,000 | $214 | 63 |
| 1126 Propps St NE | 0.42mi | 3/1.0 (-1) | 1,324 (-4%) | 3mo | $295,000 | $223 | 62 |
| 821 Muriel St NE | 0.71mi | 4/2.0 | 1,418 (+2%) | 3mo | $325,000 | $229 | 60 |
| 11101 Arvada Ave NE | 0.58mi | 3/2.0 (-1) | 1,442 (+4%) | 1mo | $299,000 | $207 | 60 |
| 1212 Gretta St NE | 0.31mi | 3/1.0 (-1) | 1,274 (-8%) | 5mo | $305,900 | $240 | 59 |
| 1126 Gretta St NE | 0.39mi | 3/2.0 (-1) | 1,511 (+9%) | 3mo | $304,999 | $202 | 59 |
| 1217 Kirby St NE | 0.41mi | 3/2.0 (-1) | 1,542 (+11%) | 1mo | $340,000 | $220 | 56 |
| 1708 Kirby St NE | 0.50mi | 3/2.0 (-1) | 1,250 (-10%) | 4mo | $365,000 | $292 | 52 |
| 11018 Snowheights Blvd NE | 0.68mi | 3/3.0 (-1) | 1,316 (-5%) | 1mo | $275,000 | $209 | 51 |
| 10516 Love Ave NE | 0.58mi | 3/2.0 (-1) | 1,190 (-14%) | 3mo | $299,000 | $251 | 42 |
| 1833 Elizabeth St NE | 0.67mi | 3/2.0 (-1) | 1,547 (+12%) | 4mo | $332,500 | $215 | 41 |
Match score weights: distance 35% · size 25% · config 20% · recency 20%. Top-matched comps best support the ARV.
Projected returns pro-forma
-3.0% appreciation · 4.33% rent growth · sell at horizon
- IRR
- -13.5%
- Equity multiple
- 0.51×
- Total profit
- $-34,939
- Equity at exit
- $38,021
- IRR
- -2.7%
- Equity multiple
- 0.81×
- Total profit
- $-13,867
- Equity at exit
- $22,048
Cash invested: $71,400 (down + closing). Projections, not guarantees.
Landlord ↔ Tenant lean methodology
- Overall (STATE)
- 55 Moderately Landlord-Leaning
- State New Mexico
- 55 Moderately Landlord-Leaning · D+3
- County
- — inherits STATE
- City
- — inherits STATE
ZIP-level market 87112
- Rents YoY
- 4.3%
- Active inventory
- 169
- Price-to-rent
- 10.0×
Monthly cashflow live
- Estimated rent
- $2,134 high interval (Pro) →
- Mortgage (P&I)
- −$1,337
- Tax from tax record
- −$187 /mo · $2,246/yr
- Insurance
- −$106
- HOA
- −$0
- Vacancy / Maint / Mgmt
- −$448
- Net cashflow
- $56
Break-even live
Sensitivity live
| Price | -10% $200 | -5% $128 | +0% $56 | +5% $-17 | +10% $-89 |
|---|---|---|---|---|---|
| Rent | -10% $-113 | -5% $-29 | +0% $56 | +5% $140 | +10% $224 |
| Rate | -1.0pp $184 | -0.5pp $120 | base $56 | +0.5pp $-11 | +1.0pp $-78 |
UW: 25.0% down · 7.5% · 30yr · 1.5% tax · 5.0% vac · 8.0% maint · 8.0% mgmt
Financing live
Cash to close
- Down payment
- $63,750
- Closing costs
- $7,650
- Reserves months
- —
- Total cash needed
- —
Loan-product check · same deal, 3 products live
Conventional
25% down · 7.5% · 30yr
- Down + closing
- —
- Monthly P&I
- —
- Monthly cashflow
- —
- DSCR
- —
- Eligible?
- —
Personal DTI + credit; lowest rate.
DSCR
20% down · 8.5% · 30yr
- Down + closing
- —
- Monthly P&I
- —
- Monthly cashflow
- —
- DSCR
- —
- Eligible?
- —
No personal income docs; deal must DSCR.
Hard money
10% down · 12.0% · 12mo
- Down + closing
- —
- Monthly P&I
- —
- Monthly cashflow
- —
- DSCR
- —
- Eligible?
- —
Short-term bridge; refi at stabilization.
Rent comps 20 comps
| Address | Beds | Baths | Sqft | Rent | $/sqft | DOM | Units | Dist |
|---|---|---|---|---|---|---|---|---|
| 1500 Shirley St NE Albuquerque, NM | 3.0 | 2.0 | 1625 | $2,300 | $1.42 | 15d | 1 | 0.13mi |
| 11517 Ralph Ave NE Albuquerque, NM | 4.0 | 2.0 | 1274 | $2,100 | $1.65 | 24d | 1 | 0.19mi |
| 11608 Clifford Ave NE Albuquerque, NM | 3.0 | 1.0 | 1100 | $2,100 | $1.91 | 24d | 1 | 0.33mi |
| 1725 Shirley St NE Albuquerque, NM | 3.0 | 1.0 | 1023 | $1,900 | $1.86 | 24d | 1 | 0.35mi |
| 1732 Muriel St NE Albuquerque, NM | 3.0 | 1.0 | 1150 | $1,845 | $1.60 | 44d | 1 | 0.38mi |
| 717 Grace St NE Albuquerque, NM | 3.0 | 1.5 | 1040 | $1,875 | $1.80 | 24d | 1 | 0.82mi |
| 2405 Dorothy St NE Albuquerque, NM | 3.0 | 1.0 | 1064 | $1,700 | $1.60 | 24d | 1 | 0.98mi |
| 7801 Marble Ave NE Albuquerque, NM | 2.0–3.0 | 1.5–2.5 | 1148 | $1,565 | $1.36 | 21d | 1 | 1.03mi |
| 2316 Britt St NE Albuquerque, NM | 3.0 | 2.0 | 1403 | $2,300 | $1.64 | 24d | 1 | 1.04mi |
| 905 La Charles Dr NE Albuquerque, NM | 3.0 | 2.0 | 1473 | $2,650 | $1.80 | 44d | 1 | 1.05mi |
| 1512 Clancy Dr NE Albuquerque, NM | 3.0 | 1.0 | 1107 | $1,800 | $1.63 | 3d | 1 | 1.06mi |
| 12412 Grand Ave NE Albuquerque, NM | 3.0 | 2.0 | 1022 | $1,850 | $1.81 | 45d | 1 | 1.13mi |
| 12509 Nambe Ave NE Albuquerque, NM | 3.0 | 1.5 | 1272 | $1,800 | $1.42 | 24d | 1 | 1.16mi |
| 10113 Blume St NE Albuquerque, NM | 3.0 | 2.0 | 1700 | $1,900 | $1.12 | 44d | 1 | 1.28mi |
| 12004 Zia Rd NE Albuquerque, NM | 2.0–3.0 | 1.5–2.0 | 1323 | $2,145 | $1.62 | 3d | 7 | 1.30mi |
| 10211 Blume St NE Albuquerque, NM | 3.0 | 2.0 | 1632 | $1,850 | $1.13 | 3d | 1 | 1.31mi |
| 10843 Fort Point Ln NE Albuquerque, NM | 3.0 | 2.5 | 1768 | $2,195 | $1.24 | 24d | 1 | 1.34mi |
| 1212 Childers Dr NE Albuquerque, NM | 3.0 | 1.0 | 951 | $2,000 | $2.10 | 44d | 1 | 1.38mi |
| 517 Ida Pl NE Albuquerque, NM | 3.0 | 1.5 | 1058 | $2,000 | $1.89 | 21d | 1 | 1.41mi |
| 1413 Field Dr NE Albuquerque, NM | 3.0 | 2.0 | 1847 | $3,000 | $1.62 | 44d | 1 | 1.45mi |
Listing history 5 events
-
2026-06-13statusdays on market $255,000 Pending 10 DOM
-
2026-06-10pricestatusdays on market $255,000 Active 9 DOM
-
2026-05-16status Pending 761-char remark
-
2026-04-20$270,000 Active 761-char remark
-
1997-11-06soldstatus
ⓘ Source: listings_history table (triggers on properties + properties_extension) + one-shot
backfill from property_details.listing_events for pre-trigger history.
Tax reassessment forecast NM · Resets to sale price
- Current annual tax
- $2,246 · $187/mo
- Projected year-2 tax
- $2,246 · $187/mo
- Expected delta
- $0/yr ($0/mo · 0.0%)
ⓘ Screening estimate from a state-policy table — verify with the county assessor before closing.
Climate risk First Street
- Flood 1/10 Low FEMA zone X (unshaded) · 0% chance over 30 yrs
- Wildfire 1/10 Low
- Heat 4/10 Moderate 6 d/yr ≥94°F today · 15 d/yr by 30 yrs out
- Wind 1/10 Low
- Air quality 1/10 Low 0 unhealthy d/yr today · 0 by 30 yrs out
Nearby sold comps map
Loading sold comps map…
Walkable amenities ~0.75 mi
Loading nearby amenities…
Taxation est. · year 1
- Rental income
- $25,613
- − Mortgage interest
- −$14,284
- − Property taxes
- −$2,246
- − Insurance
- −$1,275
- − Repairs & maintenance
- −$2,049
- − Management
- −$2,049
- − Depreciation
- −$7,418
- Taxable loss
- −$3,708
- Est. tax savings @ 24.0%
- +$890
- After-tax cash flow
- $1,556/yr
For passive investors: Depreciation is non-cash, so a rental often shows a tax loss while cash-flowing — sheltering income. Rental losses are passive: they offset passive income freely, and up to $25,000/yr can offset ordinary (W-2) income if you actively participate and your MAGI is under $100k (phasing out to $0 by $150k); unused losses carry forward. On sale, claimed depreciation is recaptured at up to 25%, and gains may owe capital-gains tax (a 1031 exchange can defer both). Figures are a year-1 estimate at your 24.0% rate — not tax advice; consult a CPA.
Schools (NCES district)
- District
- Albuquerque Public Schools
- NCES district ID
- 3500060
- Math proficiency
- 51% ▲ 30.00%
- Reading proficiency
- 75% ▲ 45.00%
- Median HH income
- $48,151
- Composite
- 53.29/100
- National rank
- #1487
- State rank
- #3 of 29 in NM
Livability — Albuquerque
- Score
- 72/100
- State rank
- #13
- US rank
- #6219
Category grades
Schools grade is shown separately in the Schools card above.
Census & demographics
- Census place
- Albuquerque, NM
- County
- Bernalillo County · 647,165 people
- City population
- 647,165
- Metro
- Albuquerque, NM
- Population (ZIP)
- 44,250
- Household income
- $73,937
- Rent vs Own
- Severe rent burden
- 1362.0
Population outlook (Bernalillo County) Hauer SSP2
- Today (2025)
- 704,528 people
- By 2030
- 711,723 · +1.0%
- By 2040
- 714,522 · +1.4%
- By 2050
- 709,274 · +0.7%
- By 2075
- 680,015 · -3.5%
- By 2100
- 619,879 · -12.0%
Race, ethnicity, and origin ACS 2023
- Neighborhood character
- Diverse neighborhood (Simpson 0.61)
- Race & ethnicity
- White 51% Hispanic / Latino 36% Two or more races 17% Native American 5% Black 3% Asian 2%
- Hispanic origin (detail)
- Mexican 20%
- Common ancestry
- Slovak 2% Serbian 2% Iranian 2%
- Foreign-born
- 6% · Canada, Vietnam, China
- Languages at home
- 85% English-only · Spanish 10% Vietnamese 1%
Political lean MEDSL · Bernalillo
- 2024 margin
- Strong D (+21.0) · D 59.2% · R 38.2% · Other 2.6%
- 2008→2024 swing
- -0.3pp no change · 2008: 21.4pp · 2024: 21.0pp
- All cycles
- 2024: D+21.0 2020: D+24.4 2016: D+17.8 2012: D+16.2 2008: D+21.4
Not yet ingested
- Civics
- —
Market trends
- HPI YoY
- ▼ -323.07%
- Current HPI
- 254.731
- Rent YoY
- ▲ 4.33%
- Metro
- Albuquerque, NM
- State GDP YoY
- —
- F500 in state
- 0
Price history
-5.6% since first listed6 events — show timeline
- 2026-06-11 Pending — Southwest MLS
- 2026-06-09 Relisted — Southwest MLS
- 2026-06-09 Price Changed $255,000 Southwest MLS
- 2026-05-16 Pending — Southwest MLS
- 2026-04-20 Listed $270,000 Southwest MLS
- 1997-11-06 Sold (Public Records) — Public Records
Property tax history
+2.5%/yrLatest (2025): $2,246 · +3.3% YoY. Source: county tax records.
Cash-flow waterfall
monthlySold comps — $/sqft
last 12 mo · ≤1 miLoading sold comps…