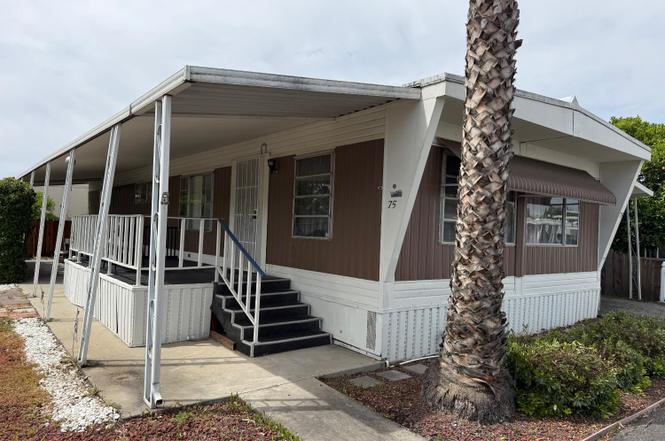
2307 Oakdale Rd #75 · Modesto, CA
Flood risk No data
- FEMA flood zone
- —
- Chance of flooding over 30 yrs
- —
- Est. flood insurance / yr
- —
Fire risk No data
- Est. fire insurance / yr
- —
Heat risk No data
- Hot days now (above threshold)
- —
- Hot days in 30 yrs
- —
Wind risk No data
- Chance of severe wind over 30 yrs
- —
Air-quality risk No data
- Unhealthy air days now
- —
- Unhealthy air days in 30 yrs
- —
Risk factors via First Street. Map © Google.
Why this score? — see what drove the B grade
The composite is a weighted blend of 9 inputs, each scored 0–100. Each bar is that input's sub-score; the figure is the points it added to the 100-point composite (weight × sub-score).
- Cash flow +30.0/30.0
- ARV discount +11.7/15.0
- 1% rule +10.0/10.0
- DSCR +10.0/10.0
- Schools +4.4/10.0
- Livability +3.2/5.0
- Rent growth +2.8/5.0
- Condition / age +2.5/5.0
- Appreciation +0.0/10.0
$109,900
🖨 Deal sheet 📄 Offer letter ✓ Due diligence
Listing remarks
Gated 2 Bedroom 2.5 Bathroom home in Glenwood Park Senior Community. Spacious Primary bedroom and indoor laundry room. Newer flooring with central air & heat. Cozy family room with dining area overlooking kitchen. Sitting on a spacious lot and a sunroom! Park features Rec Room, on-site management, offering low space rent.
Key facts
- Community pool
- Sunroom
- Indoor laundry room
Tags
Property features AI
Finance
- Financial info: $747 land lease amount (listed)
- HOA & community: No homeowners association; Located in a senior community; Land lease: not indicated as leased
Exterior
- Parking: No garage
- Utilities: Public water; Other sewer; Other electric; Other utilities
- Home design: Manufactured home in park; Double wide; Built in 1966; Located on a corner space in a senior community
- Construction: Viking make (manufactured home)
- Exterior features: Corner lot; Other roof type
Interior
- Kitchen: Free standing gas range; Microwave; Synthetic countertops
- Bedrooms: 2 bedrooms
- Flooring: Laminate
- Bathrooms: 2 full bathrooms; 1 partial bathroom; Tub; Shower stall(s)
- Heating & cooling: Central heating; Central cooling
- Interior features: Microwave; Free standing gas range; Synthetic counter; Formal dining area; Living room with unspecified feature; Pets allowed
- Laundry & utility: Inside laundry room with hookups only
Neighborhood map
What this means for you Summary
Snapshot
- This is a 2-bed/2.5-bath manufactured listed at $110k.
Deal economics
- At list price, monthly cash flow is $791 ($9k/yr) — positive.
- The deal already cash-flows at list — no discount required.
- Meets the 1% rule at list price ($2k rent vs $110k).
- Cap rate 14.9% vs local median 3.2% in Modesto — top-decile yield for the area; either an underpriced asset or a hidden risk that comps aren't pricing in. Stress-test before assuming the spread holds.
Location & tenants
- Location reads 63/100 on livability (#451 in CA) — a middle-class / working-renter tenant base. Strengths: housing A+; Watch: amenities C-, schools D+, health & safety D+.
- Sylvan Union Elementary (urban): math 44% / reading 52% proficiency, ranked #457 of 1,400 in CA (top 33%) — families likely to look elsewhere, expect single-tenant / working-renter base with shorter leases.
- Market conditions: Rents rising (+1.3%/yr); 222 active listings in the ZIP; 21 comparable units currently listed for rent nearby; rentals leasing fast (median 14d on market — plan ~1-2 weeks tenant-placement turnaround); solid renter incomes; 923 units permitted in Stanislaus County in 2024 (63 in 5+ unit buildings).
Forward outlook
- Local home prices are declining (-3.0%/yr); year-one equity from $760 of loan paydown is wiped out by about $3k of value loss. Plan a longer hold.
- Stanislaus County population projected at +14% by 2050 — modest demand growth; plan on rents tracking national, not racing it.
- At projected returns (-3.0% appreciation + 1.3% rent growth), your $31k cash investment doubles in ~5 years — after that, you're playing with house money.
Negotiation context
- Only 1 days on market — expect competitive offers; lowballing is unlikely to land.
Questions for the listing agent
- Built in 1966 — when were the roof, HVAC, electrical panel, plumbing, and water heater last replaced?
- Is there a deadline driving the sale (1031 exchange, divorce, estate, relocation)? That informs how much negotiation room exists.
- Schools are D-rated, which usually means shorter tenancies and higher turnover. Who's the typical renter profile here, and what's been the actual vacancy rate?
- Crime grade is F in this area — have there been break-ins, vandalism, or insurance claims at this property in the last 3 years? What carrier currently insures it and at what premium?
- What's the average days-on-market for RENTAL listings here right now (not sales)? A rising rental-DOM trend means longer vacancies and softer asking-rent achievability than the comps imply.
- What's the recent tenant-quality profile in this submarket — average credit score on applications, eviction rate, late-payment / NSF rate, and stable-employment percentage? A property-management company in the area should have these aggregated.
- How much new for-sale + rental construction is in the pipeline within 1–3 miles? Heavy new supply typically softens prices + rents 12–24 months out; constrained supply supports both.
Investment metrics
- 1% rule
- 1.79% ✓
- Cap rate
- 14.93%
- Cash-on-cash
- 30.86%
- DSCR
- 2.37
- GRM
- 4.7
CMA / ARV
- ARV (on-the-fly)
- $121,128
- Comps found
- 6
Show comp detail 6 sales within ~0.75 mi
| Address | Dist | Beds/Ba | Sqft | Sold | Price | $/sf | Match |
|---|---|---|---|---|---|---|---|
| 2307 Oakdale Rd #13 | 0.09mi | 2/2.0 | 1,248 (+1%) | 1mo | $175,000 | $140 | 91 |
| 2307 Oakdale Rd #100 | 0.00mi | 2/2.0 | 1,248 (+1%) | 10mo | $122,000 | $98 | 88 |
| 2307 Oakdale Rd | 0.09mi | 2/2.5 | 1,236 (0%) | 16mo | $70,000 | $57 | 82 |
| 2307 Oakdale Rd #99 | 0.00mi | 2/2.0 | 1,200 (-3%) | 15mo | $80,000 | $67 | 81 |
| 2307 Oakdale #6 | 0.00mi | 2/2.0 | 1,248 (+1%) | 23mo | $129,000 | $103 | 77 |
| 2307 Oakdale Rd #32 | 0.00mi | 2/2.0 | 1,320 (+7%) | 12mo | $55,000 | $42 | 77 |
Match score weights: distance 35% · size 25% · config 20% · recency 20%. Top-matched comps best support the ARV.
Projected returns pro-forma
-3.0% appreciation · 1.28% rent growth · sell at horizon
- IRR
- 23.7%
- Equity multiple
- 1.95×
- Total profit
- $29,282
- Equity at exit
- $16,386
- IRR
- 30.4%
- Equity multiple
- 3.51×
- Total profit
- $77,277
- Equity at exit
- $9,502
Cash invested: $30,772 (down + closing). Projections, not guarantees.
Landlord ↔ Tenant lean methodology
- Overall (STATE)
- 18 Strongly Tenant-Friendly
- State California
- 18 Strongly Tenant-Friendly · D+13
- County
- — inherits STATE
- City
- — inherits STATE
ZIP-level market 95355
- Rents YoY
- 1.3%
- Active inventory
- 222
- Price-to-rent
- 4.7×
Monthly cashflow live
- Estimated rent
- $1,963 high interval (Pro) →
- Mortgage (P&I)
- −$576
- Tax est. 1.5%
- −$137 /mo · $1,648/yr
- Insurance
- −$46
- HOA
- −$0
- Vacancy / Maint / Mgmt
- −$412
- Net cashflow
- $791
Break-even live
UW: 25.0% down · 7.5% · 30yr · 1.5% tax · 5.0% vac · 8.0% maint · 8.0% mgmt
Financing live
Cash to close
- Down payment
- $27,475
- Closing costs
- $3,297
- Reserves months
- —
- Total cash needed
- —
Loan-product check · same deal, 3 products live
Conventional
25% down · 7.5% · 30yr
- Down + closing
- —
- Monthly P&I
- —
- Monthly cashflow
- —
- DSCR
- —
- Eligible?
- —
Personal DTI + credit; lowest rate.
DSCR
20% down · 8.5% · 30yr
- Down + closing
- —
- Monthly P&I
- —
- Monthly cashflow
- —
- DSCR
- —
- Eligible?
- —
No personal income docs; deal must DSCR.
Hard money
10% down · 12.0% · 12mo
- Down + closing
- —
- Monthly P&I
- —
- Monthly cashflow
- —
- DSCR
- —
- Eligible?
- —
Short-term bridge; refi at stabilization.
Rent comps 21 comps
| Address | Beds | Baths | Sqft | Rent | $/sqft | DOM | Units | Dist |
|---|---|---|---|---|---|---|---|---|
| 1900 Oakdale Rd Modesto, CA | 1.0–2.0 | 1.0–2.0 | 728 | $1,969 | $2.70 | 13d | 1 | 0.26mi |
| 1915 Celeste Ct Unit CE1915-B Modesto, CA | 2.0 | 1.0 | 756 | $1,525 | $2.02 | 13d | 1 | 0.32mi |
| 1704 Rose Ave Modesto, CA | 2.0 | 1.0 | 850 | $1,550 | $1.82 | 13d | 1 | 0.62mi |
| 1802 Rockford Ave Modesto, CA | 2.0 | 1.0 | 892 | $1,850 | $2.07 | 23d | 1 | 0.79mi |
| 1800 Rockford Ave Unit 1 Modesto, CA | 2.0 | 1.0 | 892 | $1,850 | $2.07 | 13d | 1 | 0.79mi |
| 2912 Niabell Pl Modesto, CA | 3.0 | 2.0 | 1470 | $2,700 | $1.84 | 13d | 1 | 0.87mi |
| 2405 Vera Cruz Dr Apt C Modesto, CA | 2.0 | 1.0 | 918 | $1,675 | $1.82 | 13d | 1 | 0.88mi |
| 2616 Casita Dr Modesto, CA | 3.0 | 2.0 | 1392 | $2,500 | $1.80 | 13d | 1 | 0.91mi |
| 1313 Floyd Ave Modesto, CA | 1.0–2.0 | 1.0 | 800 | $1,725 | $2.16 | 13d | 2 | 0.91mi |
| 1308 Ensenada Dr Unit 5 Modesto, CA | 2.0 | 1.0 | 1050 | $1,450 | $1.38 | 13d | 1 | 0.91mi |
| 2100 Coffee Rd Modesto, CA | 1.0–3.0 | 1.0–2.0 | 889 | $1,740 | $1.96 | 13d | 10 | 0.94mi |
| 1339 E Rumble Rd Modesto, CA | 2.0 | 1.0 | 1150 | $1,800 | $1.57 | 13d | 1 | 0.96mi |
| 2005 Coffee Rd Unit 2005 Coffee Road, Modesto, Calif Modesto, CA | 2.0 | 1.0 | 880 | $1,750 | $1.99 | 13d | 1 | 0.98mi |
| 2025 Sweetwater Dr Modesto, CA | 3.0 | 2.0 | 1398 | $2,650 | $1.90 | 21d | 1 | 1.11mi |
| 3055 Floyd Ave Modesto, CA | 1.0–2.0 | 1.0–2.0 | 930 | $2,426 | $2.61 | 13d | 13 | 1.14mi |
| 1401 Lakewood Ave Modesto, CA | 2.0 | 1.0–2.0 | 844 | $1,962 | $2.33 | 13d | 4 | 1.20mi |
| 1500 Lakewood Ave Modesto, CA | 1.0–2.0 | 1.0–2.0 | 820 | $1,900 | $2.32 | 13d | 7 | 1.26mi |
| 3400 Coffee Rd Modesto, CA | 1.0 | 1.0 | 707 | $1,645 | $2.33 | 13d | 1 | 1.27mi |
| 3400 Coffee Rd Modesto, CA | 2.0 | 2.0 | 951 | $1,945 | $2.05 | 21d | 1 | 1.27mi |
| 1000 Brighton Ave Modesto, CA | 3.0 | 1.5 | 1250 | $1,998 | $1.60 | 13d | 1 | 1.42mi |
| 1305 Sylvan Meadows Dr Unit C Modesto, CA | 2.0 | 1.5 | 1037 | $2,150 | $2.07 | 13d | 1 | 1.48mi |
Listing history 2 events
-
2026-06-18remarks 325-char remark
-
2026-06-18$109,900 Active 1 DOM
ⓘ Source: listings_history table (triggers on properties + properties_extension) + one-shot
backfill from property_details.listing_events for pre-trigger history.
Nearby sold comps map
Loading sold comps map…
Walkable amenities ~0.75 mi
Loading nearby amenities…
Taxation est. · year 1
- Rental income
- $23,557
- − Mortgage interest
- −$6,156
- − Property taxes
- −$1,648
- − Insurance
- −$550
- − Repairs & maintenance
- −$1,885
- − Management
- −$1,885
- − Depreciation
- −$3,197
- Taxable income
- $8,237
- Est. tax owed @ 24.0%
- −$1,977
- After-tax cash flow
- $7,519/yr
For passive investors: Depreciation is non-cash, so a rental often shows a tax loss while cash-flowing — sheltering income. Rental losses are passive: they offset passive income freely, and up to $25,000/yr can offset ordinary (W-2) income if you actively participate and your MAGI is under $100k (phasing out to $0 by $150k); unused losses carry forward. On sale, claimed depreciation is recaptured at up to 25%, and gains may owe capital-gains tax (a 1031 exchange can defer both). Figures are a year-1 estimate at your 24.0% rate — not tax advice; consult a CPA.
Schools (NCES district)
- District
- Sylvan Union Elementary
- NCES district ID
- 0638670
- Math proficiency
- 44% ▲ 2.00%
- Reading proficiency
- 52% ▬ 0.00%
- Median HH income
- $61,181
- Composite
- 44.28/100
- National rank
- #6167
- State rank
- #457 of 1400 in CA
Livability — Modesto
- Score
- 63/100
- State rank
- #451
- US rank
- #15229
Category grades
Schools grade is shown separately in the Schools card above.
Census & demographics
- Census place
- Modesto, CA
- County
- Stanislaus County · 445,786 people
- City population
- 225,261
- Metro
- Modesto, CA
- Population (ZIP)
- 60,710
- Household income
- $86,849
- Rent vs Own
- Severe rent burden
- 2521.0
Population outlook (Stanislaus County) Hauer SSP2
- Today (2025)
- 579,493 people
- By 2030
- 598,000 · +3.2%
- By 2040
- 630,930 · +8.9%
- By 2050
- 658,300 · +13.6%
- By 2075
- 712,363 · +22.9%
- By 2100
- 719,805 · +24.2%
Race, ethnicity, and origin ACS 2023
- Neighborhood character
- Diverse neighborhood (Simpson 0.66)
- Race & ethnicity
- White 48% Hispanic / Latino 33% Two or more races 18% Asian 8% Black 4% Native American 1%
- Hispanic origin (detail)
- Mexican 29% Puerto Rican 2%
- Common ancestry
- Russian 3% Italian 3% Lithuanian 2%
- Foreign-born
- 15% · Canada, China, Vietnam
- Languages at home
- 73% English-only · Spanish 16% Other Indo-European 4% Tagalog/Filipino 1%
Political lean MEDSL · Stanislaus
- 2024 margin
- R (+11.0) · D 43.2% · R 54.2% · Other 2.6%
- 2008→2024 swing
- -12.7pp toward R · 2008: 1.7pp · 2024: -11.0pp
- All cycles
- 2024: R+11.0 2020: D+0.8 2016: D+0.6 2012: D+0.7 2008: D+1.7
Not yet ingested
- Civics
- —
Market trends
- HPI YoY
- ▼ -458.02%
- Current HPI
- 277.8565
- Rent YoY
- ▲ 1.28%
- Metro
- Modesto, CA
- State GDP YoY
- ▲ 3.21%
- F500 in state
- 116
Industry mix (Fortune 500 HQ in CA)
| Industry | F500 HQs | Revenue |
|---|---|---|
| Technology | 27 | $1,492B |
|
||
| Financial Services | 3 | $174B |
|
||
| Retail | 3 | $44B |
|
||
| Insurance | 3 | $26B |
|
||
| Media / Entertainment | 2 | $115B |
|
||
| Pharmaceuticals / Biotech | 2 | $62B |
|
||
Cash-flow waterfall
monthlySold comps — $/sqft
last 12 mo · ≤1 miLoading sold comps…