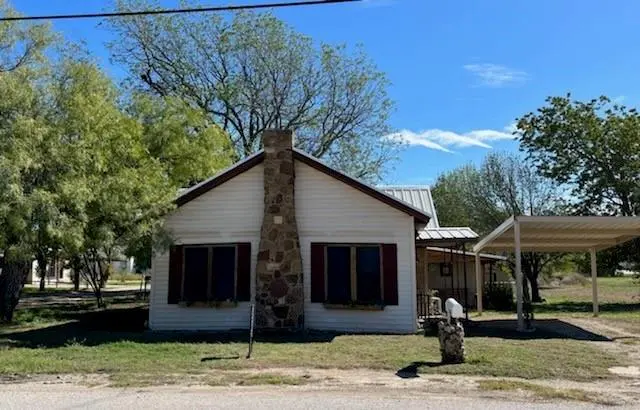
334 N Knox St · Jacksboro, TX
Flood risk 1/10 · Minimal
- FEMA flood zone
- X (unshaded)
- Chance of flooding over 30 yrs
- 0.0%
- Est. flood insurance / yr
- $507 – $1,088
Fire risk 7/10 · Major
- Est. fire insurance / yr
- $1,222 – $2,270
Heat risk 7/10 · Major
- Hot days now (above 108°F)
- 7 days/yr
- Hot days in 30 yrs
- 21 days/yr
Wind risk 4/10 · Minor
- Chance of severe wind over 30 yrs
- 11.0%
Air-quality risk 2/10 · Minimal
- Unhealthy air days now
- 0 days/yr
- Unhealthy air days in 30 yrs
- 1 days/yr
Risk factors via First Street. Map © Google.
Why this score? — see what drove the A- grade
The composite is a weighted blend of 9 inputs, each scored 0–100. Each bar is that input's sub-score; the figure is the points it added to the 100-point composite (weight × sub-score).
- Cash flow +30.0/30.0
- ARV discount +15.0/15.0
- DSCR +10.0/10.0
- 1% rule +9.7/10.0
- Appreciation +4.3/10.0
- Schools +3.6/10.0
- Livability +3.2/5.0
- Rent growth +2.5/5.0
- Condition / age +2.5/5.0
$115,900
🖨 Deal sheet 📄 Offer letter ✓ Due diligence
Listing remarks
Single-family home on a corner lot in Jacksboro, Jack County. Built in 1945, the home offers 1,263 square feet with 2 bedrooms and 2 bathrooms. Property is in need of updates and repairs, making it a solid opportunity for investors or buyers looking to add value. Located within minutes of downtown Jacksboro and one block from an easy commute on Hwy 281.
Key facts
- Easy commute
- Corner lot
- Minutes of downtown
Tags
Property features AI
Finance
- Other: Special taxing entities apply
- Financial info: Listing accepts cash and conventional financing; No second mortgage listed
- HOA & community: No homeowners association
Exterior
- Parking: Attached carport (covered, 1 space); On-site and on-street parking available; Outside parking
- Utilities: City water; City sewer; All-weather road
- Home design: Single-family residence; Residential property; Preowned home built in 1945; Not attached to other properties; Located in the Townsite-Jacksboro subdivision
- Construction: Metal roof; Vinyl siding; Built in 1945
- Exterior features: Chain link fencing; Utilities easement present; All-weather road access; City water and city sewer
Interior
- Kitchen: Dishwasher; Electric range
- Bedrooms: Two bedrooms (both on the main level)
- Bathrooms: Two full bathrooms
- Heating & cooling: Zoned heating; Ceiling fan(s); Electric cooling; Wall/window unit(s)
- Interior features: One-level layout; 4 total rooms; Living area includes one living area; Other interior features
Neighborhood map
What this means for you Summary
Snapshot
- This is a 2-bed/2.0-bath single-family listed at $116k.
Deal economics
- At list price, monthly cash flow is $453 ($5k/yr) — positive.
- The deal already cash-flows at list — no discount required.
- Meets the 1% rule at list price ($2k rent vs $116k).
- Recommended offer: $114k (1.5% below list) — sets the bar for market timing.
- Cap rate 11.0% vs local median 4.0% in Jacksboro — top-decile yield for the area; either an underpriced asset or a hidden risk that comps aren't pricing in. Stress-test before assuming the spread holds.
Location & tenants
- Location reads 64/100 on livability (#753 in TX) — a middle-class / working-renter tenant base. Strengths: cost of living A+, housing A+, crime A; Watch: health & safety C-, amenities F, commute F.
- Jacksboro ISD (town): math 42% / reading 42% proficiency, ranked #337 of 826 in TX (top 41%) — families likely to look elsewhere, expect single-tenant / working-renter base with shorter leases.
- Zoned schools: Jacksboro El (math 39% / reading 36%, grade F, #1,744 of 4,322 statewide, top 41%, 497 students, 68% FRL) — zoned schools average 68% FRL vs 44% district-wide (23 pts higher); higher-poverty schools than district average — tighter screening recommended.
- Market conditions: 124 active listings in the ZIP; 1 comparable units currently listed for rent nearby; 10 units permitted in Jack County in 2024 (0 in 5+ unit buildings).
Forward outlook
- Local home prices are declining (-1.3%/yr); year-one equity from $801 of loan paydown is wiped out by about $2k of value loss. Plan a longer hold.
- At projected returns (-1.3% appreciation + 3.0% rent growth), your $32k cash investment doubles in ~6 years — after that, you're playing with house money.
Negotiation context
- It's been on market 17 days — a 2% lower offer ($114k) is reasonable based on typical stale-listing flexibility.
- 8 sale attempts since 6y ago with the ask held roughly flat each time — persistent listings suggest the price (not the market) is what's stuck; bring a comps-based counter.
Risks & watch-outs
- Watch-outs: built in 1945 — expect roof / HVAC / electrical / plumbing capex.
- Climate carrying-cost: major wildfire risk; extreme-heat days projected 7→21/yr by 2055 (HVAC capex compounding) — expect insurance premiums to compound above CPI over the hold.
Questions for the listing agent
- Built in 1945 — when were the roof, HVAC, electrical panel, plumbing, and water heater last replaced?
- Is there a deadline driving the sale (1031 exchange, divorce, estate, relocation)? That informs how much negotiation room exists.
- Schools are F-rated, which usually means shorter tenancies and higher turnover. Who's the typical renter profile here, and what's been the actual vacancy rate?
- What's the average days-on-market for RENTAL listings here right now (not sales)? A rising rental-DOM trend means longer vacancies and softer asking-rent achievability than the comps imply.
- What's the recent tenant-quality profile in this submarket — average credit score on applications, eviction rate, late-payment / NSF rate, and stable-employment percentage? A property-management company in the area should have these aggregated.
- How much new for-sale + rental construction is in the pipeline within 1–3 miles? Heavy new supply typically softens prices + rents 12–24 months out; constrained supply supports both.
Investment metrics
- 1% rule
- 1.47% ✓
- Cap rate
- 10.99%
- Cash-on-cash
- 16.77%
- DSCR
- 1.75
- GRM
- 5.7
CMA / ARV
- ARV (on-the-fly)
- $155,349
- Comps found
- 9
Show comp detail 9 sales within ~0.75 mi
| Address | Dist | Beds/Ba | Sqft | Sold | Price | $/sf | Match |
|---|---|---|---|---|---|---|---|
| 509 Henderson | 0.11mi | 3/1.5 (+1) | 1,244 (-2%) | 2mo | $35,000 | $28 | 83 |
| 410 N Knox St | 0.03mi | 3/2.0 (+1) | 1,253 (-1%) | 20mo | $215,000 | $172 | 76 |
| 416 N Knox St | 0.04mi | 3/1.0 (+1) | 1,236 (-2%) | 16mo | $140,000 | $113 | 72 |
| 304 Moore St | 0.26mi | 2/1.0 | 1,357 (+7%) | 1mo | $205,000 | $151 | 71 |
| 250 W Thompson St | 0.15mi | 1/— (-1) | 1,404 (+11%) | 4mo | $15,000 | $11 | 66 |
| 314 N 3rd St | 0.40mi | 2/1.0 | 1,224 (-3%) | 18mo | $117,500 | $96 | 57 |
| 314 Oakwood Ave | 0.37mi | 3/2.0 (+1) | 1,452 (+15%) | 2mo | $249,000 | $171 | 51 |
| 518 6th Pl | 0.75mi | 2/2.0 | 1,308 (+4%) | 16mo | $179,900 | $138 | 46 |
| 621 W Pine St | 0.60mi | 3/1.0 (+1) | 1,218 (-4%) | 20mo | $149,900 | $123 | 40 |
Match score weights: distance 35% · size 25% · config 20% · recency 20%. Top-matched comps best support the ARV.
Projected returns pro-forma
-1.32% appreciation · 3.0% rent growth · sell at horizon
- IRR
- 12.9%
- Equity multiple
- 1.57×
- Total profit
- $18,545
- Equity at exit
- $26,180
- IRR
- 19.3%
- Equity multiple
- 2.89×
- Total profit
- $61,388
- Equity at exit
- $25,987
Cash invested: $32,452 (down + closing). Projections, not guarantees.
Landlord ↔ Tenant lean methodology
- Overall (STATE)
- 87 Strongly Landlord-Friendly
- State Texas
- 87 Strongly Landlord-Friendly · R+5
- County
- — inherits STATE
- City
- — inherits STATE
ZIP-level market 76458
- Home prices YoY
- -0.7%
- Active inventory
- 124
- Price-to-rent
- 5.7×
Monthly cashflow live
- Estimated rent
- $1,700 medium interval (Pro) →
- Mortgage (P&I)
- −$608
- Tax from tax record
- −$233 /mo · $2,801/yr
- Insurance
- −$48
- HOA
- −$0
- Vacancy / Maint / Mgmt
- −$357
- Net cashflow
- $453
Break-even live
UW: 25.0% down · 7.5% · 30yr · 1.5% tax · 5.0% vac · 8.0% maint · 8.0% mgmt
Financing live
Cash to close
- Down payment
- $28,975
- Closing costs
- $3,477
- Reserves months
- —
- Total cash needed
- —
Loan-product check · same deal, 3 products live
Conventional
25% down · 7.5% · 30yr
- Down + closing
- —
- Monthly P&I
- —
- Monthly cashflow
- —
- DSCR
- —
- Eligible?
- —
Personal DTI + credit; lowest rate.
DSCR
20% down · 8.5% · 30yr
- Down + closing
- —
- Monthly P&I
- —
- Monthly cashflow
- —
- DSCR
- —
- Eligible?
- —
No personal income docs; deal must DSCR.
Hard money
10% down · 12.0% · 12mo
- Down + closing
- —
- Monthly P&I
- —
- Monthly cashflow
- —
- DSCR
- —
- Eligible?
- —
Short-term bridge; refi at stabilization.
Rent comps 1 comps
| Address | Beds | Baths | Sqft | Rent | $/sqft | DOM | Units | Dist |
|---|---|---|---|---|---|---|---|---|
| 320 N 2nd St Jacksboro, TX | 3.0 | 2.0 | 1356 | $1,700 | $1.25 | 44d | 1 | 0.32mi |
Listing history 13 events
-
2026-06-18days on market $115,900 Active 17 DOM
-
2026-06-17days on market $115,900 Active 16 DOM
-
2026-06-16days on market $115,900 Active 15 DOM
-
2026-06-15days on market $115,900 Active 14 DOM
-
2026-06-13days on market $115,900 Active 12 DOM
-
2026-06-13days on market $115,900 Active 11 DOM
-
2026-06-09days on market $115,900 Active 8 DOM
-
2026-06-08days on market $115,900 Active 7 DOM
-
2026-06-07days on market $115,900 Active 6 DOM
-
2026-06-04days on market $115,900 Active 3 DOM
-
2026-06-03days on market $115,900 Active 2 DOM
-
2026-06-01remarks 355-char remark
-
2026-06-01$115,900 Active 1 DOM
ⓘ Source: listings_history table (triggers on properties + properties_extension) + one-shot
backfill from property_details.listing_events for pre-trigger history.
Tax reassessment forecast TX · Resets to sale price
- Current annual tax
- $2,801 · $233/mo
- Projected year-2 tax
- $2,801 · $233/mo
- Expected delta
- $0/yr ($0/mo · 0.0%)
ⓘ Screening estimate from a state-policy table — verify with the county assessor before closing.
Climate risk First Street
- Flood 1/10 Low FEMA zone X (unshaded) · 0% chance over 30 yrs
- Wildfire 7/10 Severe
- Heat 7/10 Severe 7 d/yr ≥108°F today · 21 d/yr by 30 yrs out
- Wind 4/10 Moderate 11% chance of damaging wind over 30 yrs
- Air quality 2/10 Low 0 unhealthy d/yr today · 1 by 30 yrs out
Nearby sold comps map
Loading sold comps map…
Walkable amenities ~0.75 mi
Loading nearby amenities…
Taxation est. · year 1
- Rental income
- $20,400
- − Mortgage interest
- −$6,492
- − Property taxes
- −$2,801
- − Insurance
- −$580
- − Repairs & maintenance
- −$1,632
- − Management
- −$1,632
- − Depreciation
- −$3,372
- Taxable income
- $3,891
- Est. tax owed @ 24.0%
- −$934
- After-tax cash flow
- $4,508/yr
For passive investors: Depreciation is non-cash, so a rental often shows a tax loss while cash-flowing — sheltering income. Rental losses are passive: they offset passive income freely, and up to $25,000/yr can offset ordinary (W-2) income if you actively participate and your MAGI is under $100k (phasing out to $0 by $150k); unused losses carry forward. On sale, claimed depreciation is recaptured at up to 25%, and gains may owe capital-gains tax (a 1031 exchange can defer both). Figures are a year-1 estimate at your 24.0% rate — not tax advice; consult a CPA.
Schools (NCES district)
- District
- Jacksboro ISD
- NCES district ID
- 4824530
- Math proficiency
- 42% ▼ -3.00%
- Reading proficiency
- 42% ▬ 0.00%
- Median HH income
- $47,739
- Composite
- 35.94/100
- National rank
- #4802
- State rank
- #337 of 826 in TX
Livability — Jacksboro
- Score
- 64/100
- State rank
- #753
- US rank
- #13881
Category grades
Schools grade is shown separately in the Schools card above.
Census & demographics
- Census place
- Jacksboro, TX
- Population (ZIP)
- 6,103
Population outlook (Jack County) Hauer SSP2
- Today (2025)
- 8,560 people
- By 2030
- 8,423 · -1.6%
- By 2040
- 8,433 · -1.5%
- By 2050
- 8,605 · +0.5%
- By 2075
- 9,047 · +5.7%
- By 2100
- 8,844 · +3.3%
Race, ethnicity, and origin ACS 2023
- Neighborhood character
- Predominantly White (70%)
- Race & ethnicity
- White 70% Hispanic / Latino 23% Two or more races 7% Black 5%
- Hispanic origin (detail)
- Mexican 20%
- Common ancestry
- Italian 2% Lithuanian 2% Slovak 1%
- Foreign-born
- 6% · Canada
- Languages at home
- 83% English-only · Spanish 16%
Political lean MEDSL · Jack
- 2024 margin
- Solid R (+82.3) · D 8.6% · R 90.9%
- 2008→2024 swing
- -14.2pp toward R · 2008: -68.1pp · 2024: -82.3pp
- All cycles
- 2024: R+82.3 2020: R+81.6 2016: R+79.6 2012: R+78.3 2008: R+68.1
Not yet ingested
- Civics
- —
Market trends
- HPI YoY
- ▼ -1.32%
- Current HPI
- 202.1533
- Rent YoY
- —
- Metro
- —
- State GDP YoY
- ▲ 3.95%
- F500 in state
- 110
Industry mix (Fortune 500 HQ in TX)
| Industry | F500 HQs | Revenue |
|---|---|---|
| Energy | 16 | $1,198B |
|
||
| Technology | 5 | $198B |
|
||
| Engineering / Construction | 4 | $72B |
|
||
| Energy Services | 3 | $60B |
|
||
| Utilities | 3 | $41B |
|
||
| Healthcare | 2 | $330B |
|
||
Price history
+189.8% since first listed35 events — show timeline
- 2026-05-30 Listed $115,900 NTREIS
- 2025-12-11 Listing Removed — NTREIS
- 2025-07-03 Price Changed $110,500 NTREIS
- 2025-06-12 Listed $112,500 NTREIS
- 2025-06-04 Listing Removed — NTREIS
- 2025-04-25 Price Changed $115,000 NTREIS
- 2025-01-21 Price Changed $118,000 NTREIS
- 2025-01-11 Price Changed $120,000 NTREIS
- 2024-12-11 Price Changed $122,500 NTREIS
- 2024-10-25 Price Changed $125,000 NTREIS
- 2024-10-03 Price Changed $128,000 NTREIS
- 2024-09-04 Listed $132,000 NTREIS
- 2023-12-15 Sold (Public Records) — Public Records
- 2023-12-15 Sold (MLS) — NTREIS
- 2023-11-21 Contingent — NTREIS
- 2023-11-09 Price Changed $129,500 NTREIS
- 2023-11-09 Relisted — NTREIS
- 2023-10-24 Contingent — NTREIS
- 2023-10-08 Price Changed $140,377 NTREIS
- 2023-10-06 Price Changed $145,377 NTREIS
- 2023-09-18 Listed $147,877 NTREIS
- 2021-09-17 Listing Removed — NTREIS
- 2021-09-08 Price Changed $104,999 NTREIS
- 2021-08-24 Listed $119,500 NTREIS
- 2020-10-19 Sold (Public Records) — Public Records
- 2020-10-15 Sold (MLS) — NTREIS
- 2020-09-23 Pending — NTREIS
- 2020-08-12 Price Changed $32,500 NTREIS
- 2020-07-12 Listed $49,902 NTREIS
- 2020-07-04 Listing Removed — NTREIS
- 2020-02-23 Price Changed $36,900 NTREIS
- 2020-01-03 Listed $40,000 NTREIS
- 2017-03-30 Sold (Public Records) — Public Records
- 1989-10-25 Sold (Public Records) — Public Records
- 1988-10-25 Sold (Public Records) — Public Records
Property tax history
+16.9%/yrLatest (2025): $2,801 · +0.1% YoY. Source: county tax records.
Cash-flow waterfall
monthlySold comps — $/sqft
last 12 mo · ≤1 miLoading sold comps…