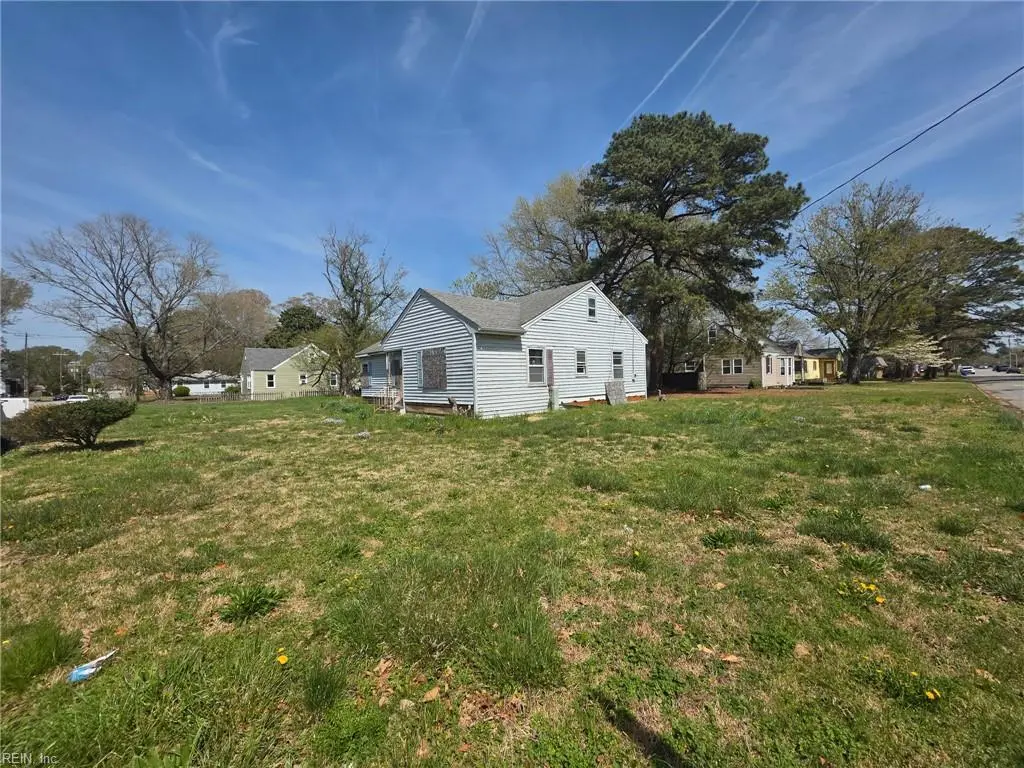
913 Halifax Ave · Portsmouth, VA
Flood risk No data
- FEMA flood zone
- —
- Chance of flooding over 30 yrs
- —
- Est. flood insurance / yr
- —
Fire risk No data
- Est. fire insurance / yr
- —
Heat risk No data
- Hot days now (above threshold)
- —
- Hot days in 30 yrs
- —
Wind risk No data
- Chance of severe wind over 30 yrs
- —
Air-quality risk No data
- Unhealthy air days now
- —
- Unhealthy air days in 30 yrs
- —
Risk factors via First Street. Map © Google.
Why this score? — see what drove the C grade
The composite is a weighted blend of 9 inputs, each scored 0–100. Each bar is that input's sub-score; the figure is the points it added to the 100-point composite (weight × sub-score).
- Cash flow +18.9/30.0
- ARV discount +15.0/15.0
- DSCR +5.9/10.0
- 1% rule +5.0/10.0
- Schools +3.9/10.0
- Livability +3.7/5.0
- Rent growth +2.5/5.0
- Condition / age +2.5/5.0
- Appreciation +0.0/10.0
$190,000
🖨 Deal sheet 📄 Offer letter ✓ Due diligence
Listing remarks MLS
Investor alert - this is the opportunity you've been waiting for! Unlock the potential of this distressed, strictly as-is property priced with profit in mind. This classic fixer-upper is ready for a full renovation, making it a great project for savvy investors, flippers, or buyers looking to build serious equity. Whether you're planning a fix-and-flip or a long-term rental, the upside here is strong for the right buyer with vision. This property offers both convenience and long-term value. Cash or rehab financing only. Bring your contractor, your ideas, and turn this into your next success story.
Key facts
- 0.38 acre lot
- Built 1952
- Listed 84 days
Neighborhood map
What this means for you Summary
Snapshot
- This is a 3-bed/1.0-bath single-family listed at $190k.
Deal economics
- At list price, monthly cash flow is $194 ($2k/yr) — positive.
- The deal already cash-flows at list — no discount required.
- Meets the 1% rule at list price ($2k rent vs $190k).
- Recommended offer: $179k (6.0% below list) — sets the bar for market timing.
- Cap rate 7.5% vs local median 4.6% in Portsmouth — top-decile yield for the area; either an underpriced asset or a hidden risk that comps aren't pricing in. Stress-test before assuming the spread holds.
Location & tenants
- Location reads 73/100 on livability (#172 in VA) — a middle-class / working-renter tenant base. Strengths: amenities A+, cost of living A+, housing A+; Watch: employment C-, crime F, commute F.
- Portsmouth City Public School District (urban): math 34% / reading 58% proficiency, ranked #107 of 131 in VA (top 82%) — families likely to look elsewhere, expect single-tenant / working-renter base with shorter leases.
- Market conditions: 84 active listings in the ZIP; 27 comparable units currently listed for rent nearby; rentals at typical pace (median 15d on market — plan ~3-4 weeks tenant-placement turnaround); 300 units permitted in Portsmouth city in 2024 (112 in 5+ unit buildings).
- At $1,908/mo this rent would consume 47% of the median local household income ($49k/yr) (locally 963% of renters already pay >50% of income on rent) — very limited rent-growth headroom before tenants either downsize or default.
Forward outlook
- Local home prices are declining (-3.0%/yr); year-one equity from $1k of loan paydown is wiped out by about $6k of value loss. Plan a longer hold.
Negotiation context
- It's been on market 84 days — a 6% lower offer ($179k) is reasonable based on typical stale-listing flexibility.
- 4 sale attempts since 10y ago with the ask held roughly flat each time — persistent listings suggest the price (not the market) is what's stuck; bring a comps-based counter.
- Current owner paid $147k; 29% above their basis — modest negotiation headroom, anchor on the comps not their cost.
Risks & watch-outs
- Watch-outs: built in 1952 — expect roof / HVAC / electrical / plumbing capex.
Questions for the listing agent
- It's been on market 84 days. Have you received any prior offers? Is the seller open to a 6% concession, seller financing, or rate buy-down credit?
- Built in 1952 — when were the roof, HVAC, electrical panel, plumbing, and water heater last replaced?
- Why hasn't it sold? Are there any deal-killer items the seller is aware of (foundation, flood, title, zoning, code violations)?
- Is there a deadline driving the sale (1031 exchange, divorce, estate, relocation)? That informs how much negotiation room exists.
- Schools are B-rated — typically a magnet for longer-tenancy family renters. What's the average tenant stay here, and is there a school-zone premium baked into asking?
- Crime grade is F in this area — have there been break-ins, vandalism, or insurance claims at this property in the last 3 years? What carrier currently insures it and at what premium?
- What's the average days-on-market for RENTAL listings here right now (not sales)? A rising rental-DOM trend means longer vacancies and softer asking-rent achievability than the comps imply.
- What's the recent tenant-quality profile in this submarket — average credit score on applications, eviction rate, late-payment / NSF rate, and stable-employment percentage? A property-management company in the area should have these aggregated.
- How much new for-sale + rental construction is in the pipeline within 1–3 miles? Heavy new supply typically softens prices + rents 12–24 months out; constrained supply supports both.
Investment metrics
- 1% rule
- 1.00% ✓
- Cap rate
- 7.52%
- Cash-on-cash
- 4.38%
- DSCR
- 1.19
- GRM
- 8.3
CMA / ARV
- ARV (median comp)
- $280,139
- List price
- $190,000
- Delta
- -32.18%
- Verdict
- UNDERPRICED
- Comps
- 20 within 1.0 mi
Show comp detail 12 sales within ~0.75 mi
| Address | Dist | Beds/Ba | Sqft | Sold | Price | $/sf | Match |
|---|---|---|---|---|---|---|---|
| 3501 South St | 0.06mi | 4/2.0 (+1) | 1,800 (+4%) | 2mo | $287,400 | $160 | 80 |
| 3602 Columbia St | 0.10mi | 4/2.0 (+1) | 1,677 (-4%) | 4mo | $320,000 | $191 | 77 |
| 1440 Mt Vernon Ave | 0.45mi | 3/2.5 | 1,700 (-2%) | 4mo | $299,900 | $176 | 66 |
| 3608 Clifford St | 0.07mi | 4/2.0 (+1) | 1,979 (+14%) | 4mo | $315,000 | $159 | 61 |
| 4021 Dartmouth St | 0.48mi | 3/2.0 | 1,600 (-8%) | 3mo | $320,000 | $200 | 58 |
| 1370 Wool Ave | 0.59mi | 3/2.5 | 1,659 (-5%) | 2mo | $305,000 | $184 | 57 |
| 600 Phillips Ave | 0.66mi | 3/2.0 | 1,644 (-6%) | 1mo | $270,500 | $165 | 55 |
| 519 Riverside Dr | 0.75mi | 3/2.0 | 1,678 (-4%) | 4mo | $362,000 | $216 | 52 |
| 4013 Greenway Ct W | 0.62mi | 3/1.0 | 1,533 (-12%) | 2mo | $275,000 | $179 | 50 |
| 954 Florida Ave | 0.67mi | 3/2.0 | 1,550 (-11%) | 1mo | $275,000 | $177 | 46 |
| 739 Lanier Cres | 0.73mi | 3/1.5 | 1,512 (-13%) | 3mo | $275,000 | $182 | 40 |
| 289 Choate St | 0.72mi | 4/2.0 (+1) | 1,500 (-14%) | 1mo | $303,000 | $202 | 34 |
Match score weights: distance 35% · size 25% · config 20% · recency 20%. Top-matched comps best support the ARV.
Projected returns pro-forma
-3.0% appreciation · 3.0% rent growth · sell at horizon
- IRR
- -9.4%
- Equity multiple
- 0.65×
- Total profit
- $-18,394
- Equity at exit
- $28,330
- IRR
- 0.0%
- Equity multiple
- 1.00×
- Total profit
- $22
- Equity at exit
- $16,428
Cash invested: $53,200 (down + closing). Projections, not guarantees.
Landlord ↔ Tenant lean methodology
- Overall (STATE)
- 55 Moderately Landlord-Leaning
- State Virginia
- 55 Moderately Landlord-Leaning · D+2
- County
- — inherits STATE
- City
- — inherits STATE
ZIP-level market 23707
- Home prices YoY
- -23.7%
- Active inventory
- 84
- Price-to-rent
- 8.3×
Monthly cashflow live
- Estimated rent
- $1,908 high interval (Pro) →
- Mortgage (P&I)
- −$996
- Tax est. 1.5%
- −$238 /mo · $2,850/yr
- Insurance
- −$79
- HOA
- −$0
- Vacancy / Maint / Mgmt
- −$401
- Net cashflow
- $194
Break-even live
UW: 25.0% down · 7.5% · 30yr · 1.5% tax · 5.0% vac · 8.0% maint · 8.0% mgmt
Financing live
Cash to close
- Down payment
- $47,500
- Closing costs
- $5,700
- Reserves months
- —
- Total cash needed
- —
Loan-product check · same deal, 3 products live
Conventional
25% down · 7.5% · 30yr
- Down + closing
- —
- Monthly P&I
- —
- Monthly cashflow
- —
- DSCR
- —
- Eligible?
- —
Personal DTI + credit; lowest rate.
DSCR
20% down · 8.5% · 30yr
- Down + closing
- —
- Monthly P&I
- —
- Monthly cashflow
- —
- DSCR
- —
- Eligible?
- —
No personal income docs; deal must DSCR.
Hard money
10% down · 12.0% · 12mo
- Down + closing
- —
- Monthly P&I
- —
- Monthly cashflow
- —
- DSCR
- —
- Eligible?
- —
Short-term bridge; refi at stabilization.
Rent comps 27 comps
| Address | Beds | Baths | Sqft | Rent | $/sqft | DOM | Units | Dist |
|---|---|---|---|---|---|---|---|---|
| 3607 Bart St Portsmouth, VA | 3.0 | 2.0 | 1326 | $1,850 | $1.40 | 10d | 1 | 0.06mi |
| 3717 Scott St Portsmouth, VA | 3.0 | 1.0 | 1157 | $1,400 | $1.21 | 23d | 1 | 0.29mi |
| 3401 Brighton St Portsmouth, VA | 3.0 | 2.5 | 1439 | $2,195 | $1.53 | 3d | 1 | 0.38mi |
| 3310 Glasgow St Portsmouth, VA | 2.0 | 1.0 | 1100 | $1,600 | $1.45 | 3d | 1 | 0.43mi |
| 300 Russell St Portsmouth, VA | 3.0 | 1.5 | 1534 | $2,250 | $1.47 | 23d | 1 | 0.46mi |
| 4205 Dartmouth St Portsmouth, VA | 4.0 | 3.5 | 2100 | $2,400 | $1.14 | 17d | 1 | 0.60mi |
| 3817 High St Portsmouth, VA | 3.0 | 2.0 | 1999 | $2,300 | $1.15 | 10d | 1 | 0.79mi |
| 821 Mt Vernon Ave Unit A Portsmouth, VA | 2.0 | 1.0 | 1200 | $1,250 | $1.04 | 3d | 1 | 0.86mi |
| 3509 Floyd St Portsmouth, VA | 4.0 | 2.5 | 1670 | $2,400 | $1.44 | 2d | 1 | 0.87mi |
| 22 Radford St Portsmouth, VA | 4.0 | 3.0 | 1651 | $2,550 | $1.54 | 3d | 1 | 0.90mi |
| 3317 Downes St Portsmouth, VA | 3.0 | 2.0 | 1148 | $1,995 | $1.74 | 10d | 1 | 1.16mi |
| 3317 Downes St Portsmouth, VA | 3.0 | 2.0 | 1148 | $1,995 | $1.74 | 3d | 1 | 1.16mi |
| 509 Mount Vernon Ave Portsmouth, VA | 3.0 | 1.5 | 1125 | $1,250 | $1.11 | 21d | 1 | 1.18mi |
| 2211 North St Portsmouth, VA | 4.0 | 1.5 | 1500 | $2,100 | $1.40 | 16d | 1 | 1.18mi |
| 507 Broad St Unit 507 Portsmouth, VA | 3.0 | 1.5 | 1700 | $1,350 | $0.79 | 43d | 1 | 1.22mi |
| 430 Mt Vernon Ave Portsmouth, VA | 3.0 | 2.0 | 2179 | $2,100 | $0.96 | 43d | 1 | 1.23mi |
| 2715 Portsmouth Blvd Portsmouth, VA | 2.0 | 1.0 | 1428 | $1,425 | $1.00 | 14d | 1 | 1.26mi |
| 2715 Portsmouth Blvd Portsmouth, VA | 2.0 | 1.0 | 1428 | $1,425 | $1.00 | 17d | 1 | 1.26mi |
| 1914 King St Portsmouth, VA | 3.0 | 2.5 | 1332 | $2,200 | $1.65 | 44d | 1 | 1.28mi |
| 416 Maryland Ave Unit A Portsmouth, VA | 3.0 | 2.0 | 1450 | $2,300 | $1.59 | 43d | 1 | 1.33mi |
| 2304 Nashville Ave Portsmouth, VA | 3.0 | 1.5 | 1226 | $1,395 | $1.14 | 43d | 1 | 1.40mi |
| 259 Broad St Unit 3 Portsmouth, VA | 3.0 | 1.0 | 1200 | $1,550 | $1.29 | 10d | 1 | 1.45mi |
| 259 Broad St Portsmouth, VA | 3.0 | 1.0 | 1200 | $1,475 | $1.23 | 3d | 1 | 1.45mi |
| 213 Beacon Rd Portsmouth, VA | 3.0 | 2.0 | 1280 | $2,300 | $1.80 | 23d | 1 | 1.46mi |
| 258 Maryland Ave Unit 2 Portsmouth, VA | 4.0 | 2.0 | 1650 | $1,950 | $1.18 | 10d | 1 | 1.47mi |
| 258 Maryland Ave Unit 1 Portsmouth, VA | 3.0 | 2.0 | 1600 | $1,850 | $1.16 | 10d | 1 | 1.47mi |
| 112 Idlewood Ave Portsmouth, VA | 3.0 | 2.0 | 1508 | $2,200 | $1.46 | 43d | 1 | 1.50mi |
Listing history 22 events
-
2026-06-18days on market $190,000 Active 84 DOM
-
2026-06-17days on market $190,000 Active 83 DOM
-
2026-06-16days on market $190,000 Active 82 DOM
-
2026-06-15days on market $190,000 Active 81 DOM
-
2026-06-13days on market $190,000 Active 79 DOM
-
2026-06-09days on market $190,000 Active 75 DOM
-
2026-06-08days on market $190,000 Active 74 DOM
-
2026-06-07days on market $190,000 Active 73 DOM
-
2026-06-03days on market $190,000 Active 69 DOM
-
2026-06-02days on market $190,000 Active 68 DOM
-
2026-06-01days on market $190,000 Active 67 DOM
-
2026-05-31days on market $190,000 Active 66 DOM
-
2026-03-26$190,000 Active 608-char remark
Show marketing remark (608 chars)
Investor alert - this is the opportunity you've been waiting for! Unlock the potential of this distressed, strictly as-is property priced with profit in mind. This classic fixer-upper is ready for a full renovation, making it a great project for savvy investors, flippers, or buyers looking to build serious equity. Whether you're planning a fix-and-flip or a long-term rental, the upside here is strong for the right buyer with vision. This property offers both convenience and long-term value. Cash or rehab financing only. Bring your contractor, your ideas, and turn this into your next success story.
-
2025-08-22soldstatus $146,832 Sold 142-char remark
Show marketing remark (142 chars)
Don't miss out on this investment opportunity! 3 bedrooms, 1 bath on a corner lot. Tons of possibilities! Don't wait, this will not last long!
-
2025-08-12status Under Contract 142-char remark
Show marketing remark (142 chars)
Don't miss out on this investment opportunity! 3 bedrooms, 1 bath on a corner lot. Tons of possibilities! Don't wait, this will not last long!
-
2025-08-07$99,000 Active 142-char remark
Show marketing remark (142 chars)
Don't miss out on this investment opportunity! 3 bedrooms, 1 bath on a corner lot. Tons of possibilities! Don't wait, this will not last long!
-
2018-05-26status Under Contract
-
2018-04-21price $144,900
-
2018-03-19$150,000 Active
-
2017-01-20historical
-
2016-10-17price $149,900
-
2016-09-19$155,000 Active
ⓘ Source: listings_history table (triggers on properties + properties_extension) + one-shot
backfill from property_details.listing_events for pre-trigger history.
Nearby sold comps map
Loading sold comps map…
Walkable amenities ~0.75 mi
Loading nearby amenities…
Taxation est. · year 1
- Rental income
- $22,894
- − Mortgage interest
- −$10,643
- − Property taxes
- −$2,850
- − Insurance
- −$950
- − Repairs & maintenance
- −$1,832
- − Management
- −$1,832
- − Depreciation
- −$5,527
- Taxable loss
- −$739
- Est. tax savings @ 24.0%
- +$177
- After-tax cash flow
- $2,507/yr
For passive investors: Depreciation is non-cash, so a rental often shows a tax loss while cash-flowing — sheltering income. Rental losses are passive: they offset passive income freely, and up to $25,000/yr can offset ordinary (W-2) income if you actively participate and your MAGI is under $100k (phasing out to $0 by $150k); unused losses carry forward. On sale, claimed depreciation is recaptured at up to 25%, and gains may owe capital-gains tax (a 1031 exchange can defer both). Figures are a year-1 estimate at your 24.0% rate — not tax advice; consult a CPA.
Schools (NCES district)
- District
- Portsmouth City Public School District
- NCES district ID
- 5103000
- Math proficiency
- 34% ▼ -40.00%
- Reading proficiency
- 58% ▼ -12.00%
- Median HH income
- $46,152
- Composite
- 39.01/100
- National rank
- #4071
- State rank
- #107 of 131 in VA
Livability — Portsmouth
- Score
- 73/100
- State rank
- #172
- US rank
- #5381
Category grades
Schools grade is shown separately in the Schools card above.
Census & demographics
- Census place
- Portsmouth, VA
- County
- Portsmouth City · 96,366 people
- City population
- 96,366
- Metro
- Virginia Beach-Norfolk-Newport News, VA-NC
- Population (ZIP)
- 14,766
- Household income
- $48,926
- Rent vs Own
- Severe rent burden
- 963.0
Population outlook (Portsmouth County) Hauer SSP2
- Today (2025)
- 96,730 people
- By 2030
- 96,760 · +0.0%
- By 2040
- 96,573 · -0.2%
- By 2050
- 95,606 · -1.2%
- By 2075
- 93,579 · -3.3%
- By 2100
- 83,756 · -13.4%
Race, ethnicity, and origin ACS 2023
- Neighborhood character
- Diverse neighborhood (Simpson 0.64)
- Race & ethnicity
- White 43% Black 41% Two or more races 9% Hispanic / Latino 3% Asian 3%
- Common ancestry
- Slovak 2% Italian 1% Serbian 1%
- Foreign-born
- 5% · Canada, China
- Languages at home
- 94% English-only · Spanish 2% Tagalog/Filipino 1% Chinese 1%
Political lean MEDSL · Portsmouth
- 2024 margin
- Solid D (+38.6) · D 68.6% · R 30.0% · Other 1.4%
- 2008→2024 swing
- -0.7pp no change · 2008: 39.3pp · 2024: 38.6pp
- All cycles
- 2024: D+38.6 2020: D+40.8 2016: D+36.5 2012: D+39.6 2008: D+39.3
Not yet ingested
- Civics
- —
Market trends
- HPI YoY
- ▼ -93.03%
- Current HPI
- 299.832
- Rent YoY
- —
- Metro
- Virginia Beach-Norfolk-Newport News, VA-NC
- State GDP YoY
- ▲ 2.40%
- F500 in state
- 50
Industry mix (Fortune 500 HQ in VA)
| Industry | F500 HQs | Revenue |
|---|---|---|
| Aerospace / Defense | 4 | $236B |
|
||
| Technology / Defense | 3 | $32B |
|
||
| Financial Services | 2 | $176B |
|
||
| Utilities | 2 | $27B |
|
||
| Insurance | 2 | $25B |
|
||
| Technology | 2 | $15B |
|
||
Price history
+22.6% since first listed10 events — show timeline
- 2026-03-26 Listed $190,000 REINMLS
- 2025-08-22 Sold (MLS) $146,832 REINMLS
- 2025-08-12 Pending — REINMLS
- 2025-08-07 Listed $99,000 REINMLS
- 2018-05-26 Pending — REINMLS
- 2018-04-21 Price Changed $144,900 REINMLS
- 2018-03-19 Listed $150,000 REINMLS
- 2017-01-20 Listing Removed — REINMLS
- 2016-10-17 Price Changed $149,900 REINMLS
- 2016-09-19 Listed $155,000 REINMLS
Cash-flow waterfall
monthlySold comps — $/sqft
last 12 mo · ≤1 miLoading sold comps…