 🏷️ Likely Rental
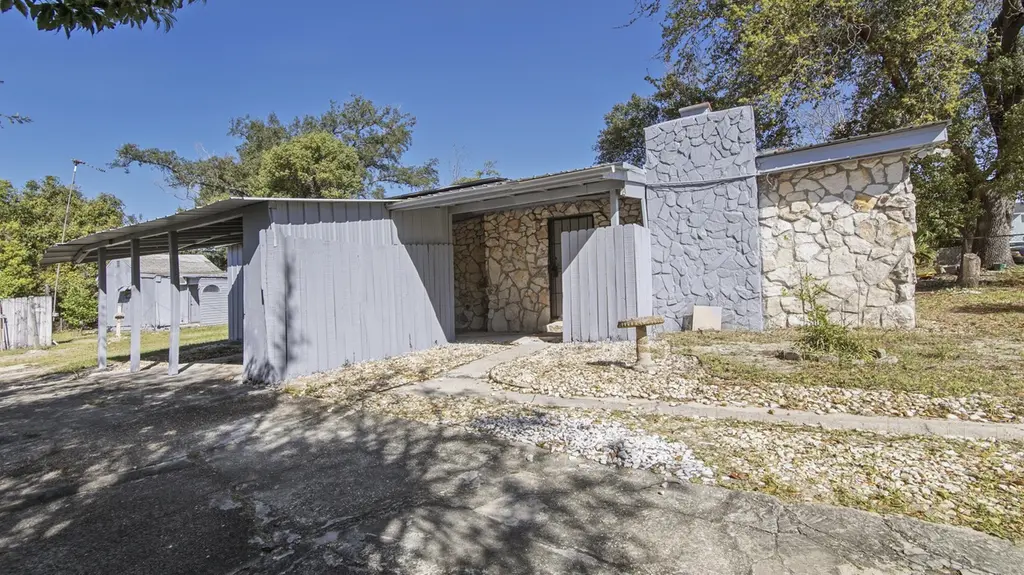
931 Taylor Dr · Springfield, FL
Flood risk 1/10 · Minimal
- FEMA flood zone
- X (unshaded)
- Chance of flooding over 30 yrs
- 0.0%
- Est. flood insurance / yr
- $507 – $1,088
Fire risk 6/10 · Moderate
- Est. fire insurance / yr
- $947 – $1,759
Heat risk 10/10 · Severe
- Hot days now (above 105°F)
- 7 days/yr
- Hot days in 30 yrs
- 21 days/yr
Wind risk 9/10 · Severe
- Chance of severe wind over 30 yrs
- 99.0%
Air-quality risk 1/10 · Minimal
- Unhealthy air days now
- 0 days/yr
- Unhealthy air days in 30 yrs
- 0 days/yr
Risk factors via First Street. Map © Google.
Why this score? — see what drove the B- grade
The composite is a weighted blend of 9 inputs, each scored 0–100. Each bar is that input's sub-score; the figure is the points it added to the 100-point composite (weight × sub-score).
- Cash flow +30.0/30.0
- DSCR +10.0/10.0
- 1% rule +9.3/10.0
- ARV discount +7.5/15.0
- Schools +4.3/10.0
- Livability +3.0/5.0
- Rent growth +2.8/5.0
- Condition / age +2.5/5.0
- Appreciation +0.0/10.0
$100,000
🖨 Deal sheet 📄 Offer letter ✓ Due diligence
Listing remarks MLS
STRONG POTENTIAL IN THIS INVESTOR HOME! Take a look at this 2BR/1BA home offering 1,032 sq ft that presents a standout opportunity for the savvy construction-based investor. This home is perfect for investors seeking a fix-and-hold rental, renovation project, or potential resale investment. Situated on a generously sized lot in an area experiencing continued growth and new residential development, this property offers multiple exit strategies for the right buyer. Originally converted from a manufactured home, the property features a wood-burning fireplace, detached storage building/workshop, and fully paid-off solar panels -- providing immediate utility savings and added long-term value. With renovation and repositioning, investors have the opportunity to capitalize on increasing area demand and improving neighborhood values. With the solar panel advantage, the current rental projection, ''as is'' should be between $800-$1000 per month, giving you a solid, immediate ROI. The lot value is close to $30K and the new construction homes on the same street as the subject are selling between $225-$260K. Properties with existing infrastructure, large lots, and redevelopment potential at this price point are becoming increasingly difficult to find. Ideal for investors, contractors, or buyers looking to add value through strategic improvements. Price recently reduced. Seller says sell!
Key facts
- 7,840 sq ft lot
- 9 parking spots
- Built 1978
Tags
Neighborhood map
What this means for you Summary
Snapshot
- This is a 2-bed/1.0-bath single-family listed at $100k.
Deal economics
- At list price, monthly cash flow is $516 ($6k/yr) — positive.
- The deal already cash-flows at list — no discount required.
- Meets the 1% rule at list price ($1k rent vs $100k).
- Recommended offer: $91k (9.0% below list) — sets the bar for market timing.
- Cap rate 12.5% vs local median 4.7% in Springfield — top-decile yield for the area; either an underpriced asset or a hidden risk that comps aren't pricing in. Stress-test before assuming the spread holds.
Location & tenants
- Location reads 59/100 on livability (#826 in FL) — a working-class tenant base; expect higher turnover. Strengths: cost of living A+, housing A+, health & safety A+; Watch: schools D, employment D, crime F.
- Bay (suburban): math 51% / reading 51% proficiency, ranked #29 of 73 in FL (top 40%) — acceptable for families but not a draw, mixed tenant base, ~2y average lease.
- Market conditions: Rents rising (+1.1%/yr); 969 active listings in the ZIP; 22 comparable units currently listed for rent nearby; rentals at typical pace (median 21d on market — plan ~3-4 weeks tenant-placement turnaround); 2,473 units permitted in Bay County in 2024 (559 in 5+ unit buildings).
Forward outlook
- Local home prices are declining (-3.0%/yr); year-one equity from $691 of loan paydown is wiped out by about $3k of value loss. Plan a longer hold.
- Bay County population projected at +24% by 2050 — long-run rental-demand tailwind backs the buy-and-hold thesis.
- At projected returns (-3.0% appreciation + 1.1% rent growth), your $28k cash investment doubles in ~7 years — after that, you're playing with house money.
Negotiation context
- It's been on market 92 days — a 9% lower offer ($91k) is reasonable based on typical stale-listing flexibility.
- 2 sale attempts; this cycle's ask has dropped $25k (20%) from the opening price — seller is motivated, your offer sets the floor, not the list.
- Current owner paid $55k; list at $100k implies a 82% gain — meaningful room to come down on a strong offer.
Risks & watch-outs
- Climate carrying-cost: severe wind risk, 99% chance of damaging wind over 30y; major wildfire risk; extreme-heat days projected 7→21/yr by 2055 (HVAC capex compounding) — expect insurance premiums to compound above CPI over the hold.
Questions for the listing agent
- It's been on market 92 days. Have you received any prior offers? Is the seller open to a 9% concession, seller financing, or rate buy-down credit?
- Built in 1978 — when were the roof, HVAC, electrical panel, plumbing, and water heater last replaced?
- Why hasn't it sold? Are there any deal-killer items the seller is aware of (foundation, flood, title, zoning, code violations)?
- Is there a deadline driving the sale (1031 exchange, divorce, estate, relocation)? That informs how much negotiation room exists.
- Schools are D-rated, which usually means shorter tenancies and higher turnover. Who's the typical renter profile here, and what's been the actual vacancy rate?
- Crime grade is F in this area — have there been break-ins, vandalism, or insurance claims at this property in the last 3 years? What carrier currently insures it and at what premium?
- What's the average days-on-market for RENTAL listings here right now (not sales)? A rising rental-DOM trend means longer vacancies and softer asking-rent achievability than the comps imply.
- What's the recent tenant-quality profile in this submarket — average credit score on applications, eviction rate, late-payment / NSF rate, and stable-employment percentage? A property-management company in the area should have these aggregated.
- How much new for-sale + rental construction is in the pipeline within 1–3 miles? Heavy new supply typically softens prices + rents 12–24 months out; constrained supply supports both.
Investment metrics
- 1% rule
- 1.43% ✓
- Cap rate
- 12.49%
- Cash-on-cash
- 22.12%
- DSCR
- 1.98
- GRM
- 5.8
CMA / ARV
- ARV (median comp)
- $212,198
- List price
- $100,000
- Delta
- -52.87%
- Verdict
- UNDERPRICED
- Comps
- 20 within 1.0 mi
Show comp detail 3 sales within ~0.75 mi
| Address | Dist | Beds/Ba | Sqft | Sold | Price | $/sf | Match |
|---|---|---|---|---|---|---|---|
| 927 Bonnie Dr | 0.06mi | 3/2.0 (+1) | 1,142 (+11%) | 10mo | $265,000 | $232 | 62 |
| 3934 E 9th St | 0.39mi | 3/2.0 (+1) | 1,050 (+2%) | 24mo | $213,200 | $203 | 50 |
| 5329 Garden Cove Rd | 0.68mi | 3/2.0 (+1) | 1,110 (+8%) | 10mo | $205,000 | $185 | 38 |
Match score weights: distance 35% · size 25% · config 20% · recency 20%. Top-matched comps best support the ARV.
Projected returns pro-forma
-3.0% appreciation · 1.12% rent growth · sell at horizon
- IRR
- 12.8%
- Equity multiple
- 1.50×
- Total profit
- $13,977
- Equity at exit
- $14,910
- IRR
- 20.3%
- Equity multiple
- 2.57×
- Total profit
- $43,879
- Equity at exit
- $8,646
Cash invested: $28,000 (down + closing). Projections, not guarantees.
Landlord ↔ Tenant lean methodology
- Overall (STATE)
- 87 Strongly Landlord-Friendly
- State Florida
- 87 Strongly Landlord-Friendly · R+3
- County
- — inherits STATE
- City
- — inherits STATE
ZIP-level market 32404
- Home prices YoY
- -16.1%
- Rents YoY
- 1.1%
- Active inventory
- 969
- Price-to-rent
- 5.8×
Monthly cashflow live
- Estimated rent
- $1,433 high interval (Pro) →
- Mortgage (P&I)
- −$524
- Tax from tax record
- −$50 /mo · $596/yr
- Insurance
- −$42
- HOA
- −$0
- Vacancy / Maint / Mgmt
- −$301
- Net cashflow
- $516
Break-even live
UW: 25.0% down · 7.5% · 30yr · 1.5% tax · 5.0% vac · 8.0% maint · 8.0% mgmt
Financing live
Cash to close
- Down payment
- $25,000
- Closing costs
- $3,000
- Reserves months
- —
- Total cash needed
- —
Loan-product check · same deal, 3 products live
Conventional
25% down · 7.5% · 30yr
- Down + closing
- —
- Monthly P&I
- —
- Monthly cashflow
- —
- DSCR
- —
- Eligible?
- —
Personal DTI + credit; lowest rate.
DSCR
20% down · 8.5% · 30yr
- Down + closing
- —
- Monthly P&I
- —
- Monthly cashflow
- —
- DSCR
- —
- Eligible?
- —
No personal income docs; deal must DSCR.
Hard money
10% down · 12.0% · 12mo
- Down + closing
- —
- Monthly P&I
- —
- Monthly cashflow
- —
- DSCR
- —
- Eligible?
- —
Short-term bridge; refi at stabilization.
Rent comps 22 comps
| Address | Beds | Baths | Sqft | Rent | $/sqft | DOM | Units | Dist |
|---|---|---|---|---|---|---|---|---|
| 5117 E 10th St Unit D Panama City, FL | 2.0 | 1.5 | 950 | $1,250 | $1.32 | 13d | 1 | 0.07mi |
| 5117 E 10th St Apt A Panama City, FL | 2.0 | 1.5 | 936 | $1,200 | $1.28 | 13d | 1 | 0.08mi |
| 906 Kevin Ct Panama City, FL | 3.0 | 2.0 | 1266 | $1,795 | $1.42 | 21d | 1 | 0.17mi |
| 3914 E 11th St #301 Panama City, FL | 2.0 | 2.0 | 864 | $1,000 | $1.16 | 21d | 1 | 0.43mi |
| 5115 E 14th St Unit 3 Panama City, FL | 2.0 | 2.0 | 978 | $1,250 | $1.28 | 21d | 1 | 0.58mi |
| 526 Camellia Ave Panama City, FL | 3.0 | 2.0 | 1375 | $1,950 | $1.42 | 21d | 1 | 0.59mi |
| 4141 E 15th St Panama City, FL | 2.0–3.0 | 2.0 | 1082 | $1,575 | $1.46 | 13d | 9 | 0.69mi |
| 3719 E 8th Ct Panama City, FL | 1.0–4.0 | 1.0–1.5 | 950 | $1,100 | $1.16 | 21d | 1 | 0.79mi |
| 420 Raven Ln Panama City, FL | 3.0 | 2.0 | 1251 | $1,750 | $1.40 | 21d | 1 | 0.83mi |
| 1401 Transmitter Rd Unit 15 Panama City, FL | 3.0 | 2.0 | 1100 | $1,395 | $1.27 | 13d | 1 | 0.86mi |
| 4905 Alameda St Unit 1 Panama City, FL | 3.0 | 2.0 | 942 | $1,295 | $1.37 | 21d | 1 | 0.89mi |
| 5101 Willow St Panama City, FL | 3.0 | 2.0 | 1099 | $1,500 | $1.36 | 13d | 1 | 0.92mi |
| 208 North Highway 22 A Unit 33 Panama City, FL | 3.0 | 2.0 | 1080 | $1,350 | $1.25 | 21d | 1 | 1.05mi |
| 229 Callaway Chase Ln Panama City, FL | 3.0 | 2.5 | 1200 | $1,650 | $1.38 | 13d | 1 | 1.12mi |
| 149 North Highway 22 A Unit 5 Panama City, FL | 2.0 | 1.0 | 900 | $1,140 | $1.27 | 13d | 1 | 1.21mi |
| 129 Seneca Ave Panama City, FL | 3.0 | 2.0 | 1449 | $1,495 | $1.03 | 13d | 1 | 1.26mi |
| 237 Helen Ave Panama City, FL | 2.0 | 2.0 | 1000 | $1,395 | $1.40 | 21d | 1 | 1.28mi |
| 6121 Harvey St Unit 8 Panama City, FL | 2.0 | 1.5 | 1200 | $1,050 | $0.88 | 21d | 1 | 1.29mi |
| 6121 Harvey St Apt 16 Panama City, FL | 2.0 | 1.5 | 1000 | $1,090 | $1.09 | 21d | 1 | 1.29mi |
| 6101 Harvey St #3 Panama City, FL | 2.0 | 1.5 | 1108 | $1,050 | $0.95 | 21d | 1 | 1.29mi |
| 5805 Cherry St Panama City, FL | 2.0 | 1.0 | 1025 | $1,200 | $1.17 | 13d | 1 | 1.43mi |
| 108 N Anita Dr Callaway, FL | 1.0 | 1.0 | 700 | $1,200 | $1.71 | 21d | 1 | 1.43mi |
Listing history 24 events
-
2026-06-19days on market $100,000 Active 92 DOM
-
2026-06-18days on market $100,000 Active 91 DOM
-
2026-06-17days on market $100,000 Active 90 DOM
-
2026-06-16days on market $100,000 Active 89 DOM
-
2026-06-15price $100,000 Active 88 DOM
-
2026-06-15days on market $119,000 Active 88 DOM
-
2026-06-14days on market $119,000 Active 86 DOM
-
2026-06-13days on market $119,000 Active 85 DOM
-
2026-06-10days on market $119,000 Active 83 DOM
-
2026-06-09days on market $119,000 Active 82 DOM
-
2026-06-08days on market $119,000 Active 81 DOM
-
2026-06-07days on market $119,000 Active 80 DOM
-
2026-06-05days on market $119,000 Active 77 DOM
-
2026-06-03days on market $119,000 Active 76 DOM
-
2026-06-02days on market $119,000 Active 75 DOM
-
2026-06-01days on market $119,000 Active 74 DOM
-
2026-05-31days on market $119,000 Active 73 DOM
-
2026-05-30days on market $119,000 Active 72 DOM
-
2026-05-19price $109,900 1398-char remark
Show marketing remark (1398 chars)
STRONG POTENTIAL IN THIS INVESTOR HOME! Take a look at this 2BR/1BA home offering 1,032 sq ft that presents a standout opportunity for the savvy construction-based investor. This home is perfect for investors seeking a fix-and-hold rental, renovation project, or potential resale investment. Situated on a generously sized lot in an area experiencing continued growth and new residential development, this property offers multiple exit strategies for the right buyer. Originally converted from a manufactured home, the property features a wood-burning fireplace, detached storage building/workshop, and fully paid-off solar panels -- providing immediate utility savings and added long-term value. With renovation and repositioning, investors have the opportunity to capitalize on increasing area demand and improving neighborhood values. With the solar panel advantage, the current rental projection, ''as is'' should be between $800-$1000 per month, giving you a solid, immediate ROI. The lot value is close to $30K and the new construction homes on the same street as the subject are selling between $225-$260K. Properties with existing infrastructure, large lots, and redevelopment potential at this price point are becoming increasingly difficult to find. Ideal for investors, contractors, or buyers looking to add value through strategic improvements. Price recently reduced. Seller says sell!
-
2026-04-03price $119,000 939-char remark
Show marketing remark (1398 chars)
STRONG POTENTIAL IN THIS INVESTOR HOME! Take a look at this 2BR/1BA home offering 1,032 sq ft that presents a standout opportunity for the savvy construction-based investor. This home is perfect for investors seeking a fix-and-hold rental, renovation project, or potential resale investment. Situated on a generously sized lot in an area experiencing continued growth and new residential development, this property offers multiple exit strategies for the right buyer. Originally converted from a manufactured home, the property features a wood-burning fireplace, detached storage building/workshop, and fully paid-off solar panels -- providing immediate utility savings and added long-term value. With renovation and repositioning, investors have the opportunity to capitalize on increasing area demand and improving neighborhood values. With the solar panel advantage, the current rental projection, ''as is'' should be between $800-$1000 per month, giving you a solid, immediate ROI. The lot value is close to $30K and the new construction homes on the same street as the subject are selling between $225-$260K. Properties with existing infrastructure, large lots, and redevelopment potential at this price point are becoming increasingly difficult to find. Ideal for investors, contractors, or buyers looking to add value through strategic improvements. Price recently reduced. Seller says sell!
-
2026-04-03price $119,000 1398-char remark
Show marketing remark (1398 chars)
STRONG POTENTIAL IN THIS INVESTOR HOME! Take a look at this 2BR/1BA home offering 1,032 sq ft that presents a standout opportunity for the savvy construction-based investor. This home is perfect for investors seeking a fix-and-hold rental, renovation project, or potential resale investment. Situated on a generously sized lot in an area experiencing continued growth and new residential development, this property offers multiple exit strategies for the right buyer. Originally converted from a manufactured home, the property features a wood-burning fireplace, detached storage building/workshop, and fully paid-off solar panels -- providing immediate utility savings and added long-term value. With renovation and repositioning, investors have the opportunity to capitalize on increasing area demand and improving neighborhood values. With the solar panel advantage, the current rental projection, ''as is'' should be between $800-$1000 per month, giving you a solid, immediate ROI. The lot value is close to $30K and the new construction homes on the same street as the subject are selling between $225-$260K. Properties with existing infrastructure, large lots, and redevelopment potential at this price point are becoming increasingly difficult to find. Ideal for investors, contractors, or buyers looking to add value through strategic improvements. Price recently reduced. Seller says sell!
-
2026-03-19$125,000 Active 939-char remark
Show marketing remark (939 chars)
STRONG POTENTIAL IN THIS INVESTOR HOME! Take a look at this 2BR/1BA home offering 1,032 sq ft that presents a standout opportunity for the savvy construction-based investor. The home features a charming, functional layout anchored by a cozy wood-burning fireplace, plus a generously sized lot with a detached storage building - ideal for added utility, workspace, or future possibilities. This great house also features fully paid-off solar panels providing immediate efficiency benefits and long-term cost savings. While the property does need some work, the strong fundamentals, lot size, and existing upgrades create clear potential for a profitable renovation, rental investment, or resale project. Opportunities with this combination of features and upside are increasingly hard to find -- se Opportunities with this combination of features and upside are increasingly hard to find -- serious investors will want to take a close look.
-
2026-02-10$125,000 Active 1398-char remark
Show marketing remark (1398 chars)
STRONG POTENTIAL IN THIS INVESTOR HOME! Take a look at this 2BR/1BA home offering 1,032 sq ft that presents a standout opportunity for the savvy construction-based investor. This home is perfect for investors seeking a fix-and-hold rental, renovation project, or potential resale investment. Situated on a generously sized lot in an area experiencing continued growth and new residential development, this property offers multiple exit strategies for the right buyer. Originally converted from a manufactured home, the property features a wood-burning fireplace, detached storage building/workshop, and fully paid-off solar panels -- providing immediate utility savings and added long-term value. With renovation and repositioning, investors have the opportunity to capitalize on increasing area demand and improving neighborhood values. With the solar panel advantage, the current rental projection, ''as is'' should be between $800-$1000 per month, giving you a solid, immediate ROI. The lot value is close to $30K and the new construction homes on the same street as the subject are selling between $225-$260K. Properties with existing infrastructure, large lots, and redevelopment potential at this price point are becoming increasingly difficult to find. Ideal for investors, contractors, or buyers looking to add value through strategic improvements. Price recently reduced. Seller says sell!
-
2026-02-02soldstatus $55,000
ⓘ Source: listings_history table (triggers on properties + properties_extension) + one-shot
backfill from property_details.listing_events for pre-trigger history.
Tax reassessment forecast FL · Resets to sale price
- Current annual tax
- $596 · $50/mo
- Projected year-2 tax
- $830 · $69/mo
- Expected delta
- +$234/yr (+$19/mo · 39.2%)
ⓘ Screening estimate from a state-policy table — verify with the county assessor before closing.
Climate risk First Street
- Flood 1/10 Low FEMA zone X (unshaded) · 0% chance over 30 yrs
- Wildfire 6/10 Major
- Heat 10/10 Extreme 7 d/yr ≥105°F today · 21 d/yr by 30 yrs out
- Wind 9/10 Extreme 99% chance of damaging wind over 30 yrs
- Air quality 1/10 Low 0 unhealthy d/yr today · 0 by 30 yrs out
Nearby sold comps map
Loading sold comps map…
Walkable amenities ~0.75 mi
Loading nearby amenities…
Taxation est. · year 1
- Rental income
- $17,192
- − Mortgage interest
- −$5,602
- − Property taxes
- −$596
- − Insurance
- −$500
- − Repairs & maintenance
- −$1,375
- − Management
- −$1,375
- − Depreciation
- −$2,909
- Taxable income
- $4,834
- Est. tax owed @ 24.0%
- −$1,160
- After-tax cash flow
- $5,032/yr
For passive investors: Depreciation is non-cash, so a rental often shows a tax loss while cash-flowing — sheltering income. Rental losses are passive: they offset passive income freely, and up to $25,000/yr can offset ordinary (W-2) income if you actively participate and your MAGI is under $100k (phasing out to $0 by $150k); unused losses carry forward. On sale, claimed depreciation is recaptured at up to 25%, and gains may owe capital-gains tax (a 1031 exchange can defer both). Figures are a year-1 estimate at your 24.0% rate — not tax advice; consult a CPA.
Schools (NCES district)
- District
- Bay
- NCES district ID
- 1200090
- Math proficiency
- 51% ▼ -8.00%
- Reading proficiency
- 51% ▼ -7.00%
- Median HH income
- $47,740
- Composite
- 43.41/100
- National rank
- #3014
- State rank
- #29 of 73 in FL
Livability — Springfield
- Score
- 59/100
- State rank
- #826
- US rank
- #20265
Category grades
Schools grade is shown separately in the Schools card above.
Census & demographics
- Census place
- Springfield, FL
- County
- Bay County · 163,593 people
- Metro
- Panama City, FL
- Population (ZIP)
- 42,514
- Household income
- $74,708
- Rent vs Own
- Severe rent burden
- 1218.0
Population outlook (Bay County) Hauer SSP2
- Today (2025)
- 206,264 people
- By 2030
- 217,740 · +5.6%
- By 2040
- 238,738 · +15.7%
- By 2050
- 255,545 · +23.9%
- By 2075
- 288,295 · +39.8%
- By 2100
- 288,638 · +39.9%
Race, ethnicity, and origin ACS 2023
- Neighborhood character
- Predominantly White (69%)
- Race & ethnicity
- White 69% Black 12% Two or more races 10% Hispanic / Latino 9% Asian 3%
- Hispanic origin (detail)
- Mexican 2% Puerto Rican 3%
- Common ancestry
- Lithuanian 3% Slovak 2% Italian 2%
- Foreign-born
- 7% · Canada, Vietnam, Mexico
- Languages at home
- 90% English-only · Spanish 6% Vietnamese 1% Other Asian/Pacific 1%
Political lean MEDSL · Bay
- 2024 margin
- Solid R (+47.4) · D 25.8% · R 73.1% · Other 1.1%
- 2008→2024 swing
- -6.6pp toward R · 2008: -40.7pp · 2024: -47.4pp
- All cycles
- 2024: R+47.4 2020: R+43.5 2016: R+46.3 2012: R+43.6 2008: R+40.7
Not yet ingested
- Civics
- —
Market trends
- HPI YoY
- ▼ -50.59%
- Current HPI
- 263.7178
- Rent YoY
- ▲ 1.12%
- Metro
- Panama City, FL
- State GDP YoY
- ▲ 3.28%
- F500 in state
- 36
Industry mix (Fortune 500 HQ in FL)
| Industry | F500 HQs | Revenue |
|---|---|---|
| Industrial Technology | 2 | $29B |
|
||
| Insurance | 2 | $17B |
|
||
| Retail | 1 | $60B |
|
||
| Technology Distribution | 1 | $58B |
|
||
| Homebuilding | 1 | $35B |
|
||
| Technology Manufacturing | 1 | $35B |
|
||
Price history
+99.8% since first listed6 events — show timeline
- 2026-05-19 Price Changed $109,900 CPARMLS
- 2026-04-03 Price Changed $119,000 ECAR
- 2026-04-03 Price Changed $119,000 CPARMLS
- 2026-03-19 Listed $125,000 ECAR
- 2026-02-10 Listed $125,000 CPARMLS
- 2026-02-02 Sold (Public Records) $55,000 Public Records
Property tax history
+5.2%/yrLatest (2025): $596 · +1.4% YoY. Source: county tax records.
Cash-flow waterfall
monthlySold comps — $/sqft
last 12 mo · ≤1 miLoading sold comps…