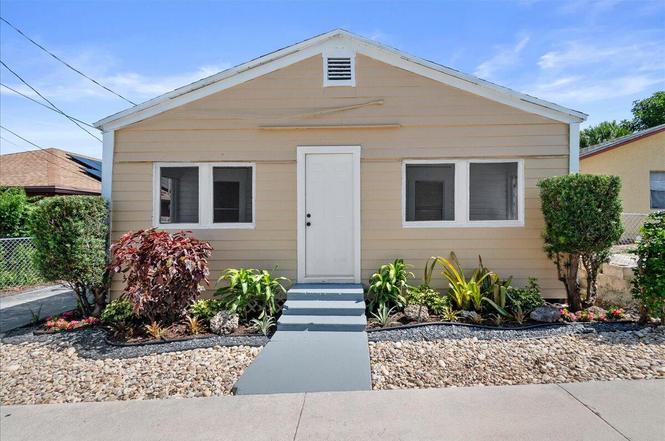
1011 22nd St · West Palm Beach, FL
Flood risk 1/10 · Minimal
- FEMA flood zone
- X (unshaded)
- Chance of flooding over 30 yrs
- 0.0%
- Est. flood insurance / yr
- $507 – $1,088
Fire risk 1/10 · Minimal
- Est. fire insurance / yr
- $947 – $1,759
Heat risk 10/10 · Severe
- Hot days now (above 105°F)
- 7 days/yr
- Hot days in 30 yrs
- 25 days/yr
Wind risk 10/10 · Severe
- Chance of severe wind over 30 yrs
- 99.0%
Air-quality risk 2/10 · Minimal
- Unhealthy air days now
- 1 days/yr
- Unhealthy air days in 30 yrs
- 1 days/yr
Risk factors via First Street. Map © Google.
Why this score? — see what drove the C+ grade
The composite is a weighted blend of 9 inputs, each scored 0–100. Each bar is that input's sub-score; the figure is the points it added to the 100-point composite (weight × sub-score).
- Cash flow +26.8/30.0
- DSCR +9.2/10.0
- ARV discount +7.5/15.0
- 1% rule +6.8/10.0
- Schools +4.3/10.0
- Livability +4.1/5.0
- Rent growth +3.3/5.0
- Condition / age +2.5/5.0
- Appreciation +0.0/10.0
$287,900
🖨 Deal sheet 📄 Offer letter ✓ Due diligence
Listing remarks
Welcome to this charming 3-bedroom, 1-bath single-family home in West Palm Beach! Offering 1,075 square feet of living space, this home blends classic character with everyday comfort. Inside, you'll find a functional layout featuring spacious living areas and a bright kitchen ready for your personal touch. Situated on a 3,600-square-foot lot, the property provides outdoor space for entertaining, gardening, or relaxing. Conveniently located near shopping, dining, schools, major roadways, and just minutes from downtown West Palm Beach and area beaches, this home is an excellent opportunity for first-time buyers, investors, or anyone looking to enjoy the South Florida lifestyle. Don't miss you
Key facts
- 3,600 sq ft lot
- Built 1925
Property features AI
Finance
- Other: Building area reported as 1,075 (per public records)
- Financial info: Pets allowed with no restrictions
Exterior
- Parking: No carport; No designated parking total reported
- Utilities: Public water; Public sewer; Other utilities
- Home design: Single family residence; One story; Resale condition; Faces south
- Construction: Frame construction; Built using public records as area source
- Exterior features: Not waterfront; Other-style roof
Interior
- Bedrooms: Three bedrooms on the main level
- Flooring: Tile; Vinyl
- Bathrooms: One full bathroom
- Heating & cooling: Central heating; Central air conditioning
- Interior features: Tile and vinyl flooring; Washer hookup
- Laundry & utility: Washer hookup
Neighborhood map
What this means for you Summary
Snapshot
- This is a 2-bed/1.0-bath single-family listed at $288k.
Deal economics
- At list price, monthly cash flow is $790 ($9k/yr) — positive.
- The deal already cash-flows at list — no discount required.
- Meets the 1% rule at list price ($3k rent vs $288k).
- Cap rate 9.6% vs local median 3.8% in West Palm Beach — top-decile yield for the area; either an underpriced asset or a hidden risk that comps aren't pricing in. Stress-test before assuming the spread holds.
Location & tenants
- Location reads 82/100 on livability (#75 in FL, #1,255 nationally) — a professional / high-income tenant draw. Strengths: commute A+, housing A+, health & safety A+; Watch: employment C-, crime F.
- Palm Beach (suburban): math 46% / reading 53% proficiency, ranked #34 of 73 in FL (top 47%) — families likely to look elsewhere, expect single-tenant / working-renter base with shorter leases.
- Zoned schools: Pleasant City Elementary School (math 27% / reading 27%, grade F, #1,969 of 2,144 statewide, top 94%, 330 students, 94% FRL); Palm Beach Lakes High School (math 17% / reading 26%, grade F, #546 of 667 statewide, top 82%, 2,688 students, 70% FRL) — zoned schools average 82% FRL vs 52% district-wide (30 pts higher); higher-poverty schools than district average — tighter screening recommended.
- Zoned-school proficiency averages 24% at this address vs 50% district-wide (-25 pts) — the specific schools serving this property underperform the Palm Beach average; the district grade overstates school quality for this exact location.
- Market conditions: Rents rising (+3.1%/yr); 305 active listings in the ZIP; 40 comparable units currently listed for rent nearby; rentals at typical pace (median 24d on market — plan ~3-4 weeks tenant-placement turnaround); 3,974 units permitted in Palm Beach County in 2024 (1,012 in 5+ unit buildings).
Forward outlook
- Local home prices are declining (-3.0%/yr); year-one equity from $2k of loan paydown is wiped out by about $9k of value loss. Plan a longer hold.
- Palm Beach County population projected at +30% by 2050 — long-run rental-demand tailwind backs the buy-and-hold thesis.
- At projected returns (-3.0% appreciation + 3.1% rent growth), your $81k cash investment doubles in ~10 years — after that, you're playing with house money.
Negotiation context
- Only 1 days on market — expect competitive offers; lowballing is unlikely to land.
- 2 sale attempts since 7y ago with the ask held roughly flat each time — persistent listings suggest the price (not the market) is what's stuck; bring a comps-based counter.
- Current owner paid $18k; list at $288k implies a 1499% gain — meaningful room to come down on a strong offer.
Risks & watch-outs
- Watch-outs: built in 1925 — expect roof / HVAC / electrical / plumbing capex.
- Climate carrying-cost: severe wind risk, 99% chance of damaging wind over 30y; extreme-heat days projected 7→25/yr by 2055 (HVAC capex compounding) — expect insurance premiums to compound above CPI over the hold.
Questions for the listing agent
- Built in 1925 — when were the roof, HVAC, electrical panel, plumbing, and water heater last replaced?
- Is there a deadline driving the sale (1031 exchange, divorce, estate, relocation)? That informs how much negotiation room exists.
- Crime grade is F in this area — have there been break-ins, vandalism, or insurance claims at this property in the last 3 years? What carrier currently insures it and at what premium?
- What's the average days-on-market for RENTAL listings here right now (not sales)? A rising rental-DOM trend means longer vacancies and softer asking-rent achievability than the comps imply.
- What's the recent tenant-quality profile in this submarket — average credit score on applications, eviction rate, late-payment / NSF rate, and stable-employment percentage? A property-management company in the area should have these aggregated.
- How much new for-sale + rental construction is in the pipeline within 1–3 miles? Heavy new supply typically softens prices + rents 12–24 months out; constrained supply supports both.
Investment metrics
- 1% rule
- 1.18% ✓
- Cap rate
- 9.59%
- Cash-on-cash
- 11.76%
- DSCR
- 1.52
- GRM
- 7.1
CMA / ARV
No comps found within radius.
Projected returns pro-forma
-3.0% appreciation · 3.08% rent growth · sell at horizon
- IRR
- 1.3%
- Equity multiple
- 1.05×
- Total profit
- $3,927
- Equity at exit
- $42,927
- IRR
- 11.0%
- Equity multiple
- 1.86×
- Total profit
- $69,283
- Equity at exit
- $24,892
Cash invested: $80,612 (down + closing). Projections, not guarantees.
Landlord ↔ Tenant lean methodology
- Overall (STATE)
- 87 Strongly Landlord-Friendly
- State Florida
- 87 Strongly Landlord-Friendly · R+3
- County
- — inherits STATE
- City
- — inherits STATE
ZIP-level market 33407
- Rents YoY
- 3.1%
- Active inventory
- 305
- Price-to-rent
- 7.1×
Monthly cashflow live
- Estimated rent
- $3,387 high interval (Pro) →
- Mortgage (P&I)
- −$1,510
- Tax from tax record
- −$256 /mo · $3,071/yr
- Insurance
- −$120
- HOA
- −$0
- Vacancy / Maint / Mgmt
- −$711
- Net cashflow
- $790
Break-even live
UW: 25.0% down · 7.5% · 30yr · 1.5% tax · 5.0% vac · 8.0% maint · 8.0% mgmt
Financing live
Cash to close
- Down payment
- $71,975
- Closing costs
- $8,637
- Reserves months
- —
- Total cash needed
- —
Loan-product check · same deal, 3 products live
Conventional
25% down · 7.5% · 30yr
- Down + closing
- —
- Monthly P&I
- —
- Monthly cashflow
- —
- DSCR
- —
- Eligible?
- —
Personal DTI + credit; lowest rate.
DSCR
20% down · 8.5% · 30yr
- Down + closing
- —
- Monthly P&I
- —
- Monthly cashflow
- —
- DSCR
- —
- Eligible?
- —
No personal income docs; deal must DSCR.
Hard money
10% down · 12.0% · 12mo
- Down + closing
- —
- Monthly P&I
- —
- Monthly cashflow
- —
- DSCR
- —
- Eligible?
- —
Short-term bridge; refi at stabilization.
Rent comps 40 comps
| Address | Beds | Baths | Sqft | Rent | $/sqft | DOM | Units | Dist |
|---|---|---|---|---|---|---|---|---|
| 1104 State St Unit C West Palm Beach, FL | 3.0 | 1.0 | 875 | $3,000 | $3.43 | 24d | 1 | 0.27mi |
| 2585 Spruce Ave West Palm Beach, FL | 1.0–2.0 | 1.0–2.0 | 841 | $3,225 | $3.83 | 1d | 122 | 0.39mi |
| 565 Lilac Ct West Palm Beach, FL | 3.0 | 2.0 | 1250 | $3,000 | $2.40 | 17d | 1 | 0.44mi |
| 823 14th St West Palm Beach, FL | 3.0 | 1.0 | 1000 | $3,495 | $3.50 | 24d | 1 | 0.50mi |
| 933 30th Ct West Palm Beach, FL | 3.0 | 1.5 | 1085 | $3,100 | $2.86 | 24d | 1 | 0.56mi |
| 932 31st St West Palm Beach, FL | 3.0 | 2.0 | 850 | $3,000 | $3.53 | 24d | 1 | 0.58mi |
| 1805 N Flagler Dr #107 West Palm Beach, FL | 3.0 | 2.0 | 1237 | $2,995 | $2.42 | 3d | 1 | 0.59mi |
| 517 31st St West Palm Beach, FL | 2.0 | 1.5 | 1406 | $3,150 | $2.24 | 24d | 1 | 0.64mi |
| 1319 13th St West Palm Beach, FL | 3.0 | 2.0 | 1215 | $3,200 | $2.63 | 24d | 1 | 0.69mi |
| 1801 N Flagler Dr West Palm Beach, FL | 1.0–2.0 | 1.0–2.0 | 1125 | $4,500 | $4.00 | 1d | 7 | 0.72mi |
| 1801 N Flagler Dr West Palm Beach, FL | 1.0–2.0 | 1.0–2.0 | 998 | $4,250 | $4.26 | 18d | 4 | 0.72mi |
| 1801 N Flagler Dr West Palm Beach, FL | 1.0–2.0 | 1.0–2.0 | 998 | $4,250 | $4.26 | 24d | 3 | 0.72mi |
| 1803 N Flagler Dr #310 West Palm Beach, FL | 2.0 | 1.0 | 995 | $3,000 | $3.02 | 18d | 1 | 0.74mi |
| 245 30th St West Palm Beach, FL | 2.0 | 2.0 | 1271 | $9,000 | $7.08 | 24d | 1 | 0.76mi |
| 1551 N Flagler Dr West Palm Beach, FL | 2.0 | 2.0 | 1175 | $5,050 | $4.30 | 21d | 3 | 0.76mi |
| 1551 N Flagler Dr West Palm Beach, FL | 2.0 | 2.0 | 1175 | $5,098 | $4.34 | 24d | 3 | 0.76mi |
| 415 32nd St Unit 1 West Palm Beach, FL | 1.0 | 1.0 | 700 | $3,600 | $5.14 | 24d | 1 | 0.76mi |
| 636 35th St West Palm Beach, FL | 3.0 | 2.0 | 1133 | $3,500 | $3.09 | 24d | 1 | 0.77mi |
| 1551 N Flagler Dr Unit Uph-2 West Palm Beach, FL | 2.0 | 2.0 | 1175 | $3,750 | $3.19 | 24d | 1 | 0.78mi |
| 3410 Poinsettia Ave West Palm Beach, FL | 2.0 | 1.0 | 1257 | $3,350 | $2.67 | 11d | 1 | 0.86mi |
| 921 8th St West Palm Beach, FL | 3.0 | 1.0 | 1000 | $3,395 | $3.40 | 24d | 1 | 0.89mi |
| 306 34th St West Palm Beach, FL | 2.0 | 1.0 | 1443 | $4,650 | $3.22 | 24d | 1 | 0.90mi |
| 701 37th St West Palm Beach, FL | 3.0 | 2.0 | 1426 | $3,600 | $2.52 | 24d | 1 | 0.90mi |
| 619 37th St West Palm Beach, FL | 3.0 | 2.0 | 1414 | $3,350 | $2.37 | 24d | 1 | 0.92mi |
| 3415 N Flagler Dr West Palm Beach, FL | 2.0 | 2.0 | 1174 | $9,950 | $8.48 | 7d | 1 | 0.97mi |
| 3940 N Flagler Dr #206 West Palm Beach, FL | 1.0 | 1.0 | 1078 | $3,950 | $3.66 | 4d | 1 | 1.05mi |
| 3940 N Flagler Dr #206 West Palm Beach, FL | 1.0 | 1.0 | 1078 | $4,950 | $4.59 | 24d | 1 | 1.05mi |
| 3940 N Flagler Dr #206 West Palm Beach, FL | 1.0 | 1.0 | 1078 | $3,950 | $3.66 | 3d | 1 | 1.05mi |
| 917 N Flagler Dr #311 West Palm Beach, FL | 2.0 | 2.0 | 968 | $3,000 | $3.10 | 24d | 1 | 1.13mi |
| 805 N Olive Ave West Palm Beach, FL | 1.0–2.0 | 1.0–2.0 | 852 | $3,704 | $4.35 | 3d | 15 | 1.16mi |
| 401 42nd St West Palm Beach, FL | 3.0 | 1.0 | 1100 | $4,950 | $4.50 | 24d | 1 | 1.25mi |
| 401 42nd St West Palm Beach, FL | 3.0 | 1.0 | 1400 | $4,950 | $3.54 | 14d | 1 | 1.25mi |
| 609 2nd St West Palm Beach, FL | 2.0 | 2.0 | 1063 | $3,240 | $3.05 | 24d | 1 | 1.27mi |
| 609 2nd St West Palm Beach, FL | 2.0 | 2.0 | 978 | $3,325 | $3.40 | 2d | 1 | 1.27mi |
| 609 2nd St West Palm Beach, FL | 2.0 | 2.0 | 978 | $3,015 | $3.08 | 18d | 1 | 1.27mi |
| 4444 N Flagler Dr Unit 4444-306 West Palm Beach, FL | 1.0 | 1.0 | 925 | $3,395 | $3.67 | 24d | 1 | 1.34mi |
| 4444 N Flagler Dr Unit 4334-2008 West Palm Beach, FL | 1.0 | 1.0 | 885 | $4,150 | $4.69 | 24d | 1 | 1.34mi |
| 4444 N Flagler Dr West Palm Beach, FL | 2.0 | 2.0 | 1300 | $4,579 | $3.52 | 24d | 1 | 1.34mi |
| 4444 N Flagler Dr West Palm Beach, FL | 1.0 | 1.0 | 765 | $5,263 | $6.88 | 16d | 1 | 1.34mi |
| 4444 N Flagler Dr West Palm Beach, FL | 1.0 | 1.0 | 765 | $4,613 | $6.03 | 2d | 1 | 1.34mi |
Listing history 2 events
-
2026-06-18remarks 699-char remark
-
2026-06-18$287,900 Active 1 DOM
ⓘ Source: listings_history table (triggers on properties + properties_extension) + one-shot
backfill from property_details.listing_events for pre-trigger history.
Tax reassessment forecast FL · Resets to sale price
- Current annual tax
- $3,071 · $256/mo
- Projected year-2 tax
- $3,071 · $256/mo
- Expected delta
- $0/yr ($0/mo · 0.0%)
ⓘ Screening estimate from a state-policy table — verify with the county assessor before closing.
Climate risk First Street
- Flood 1/10 Low FEMA zone X (unshaded) · 0% chance over 30 yrs
- Wildfire 1/10 Low
- Heat 10/10 Extreme 7 d/yr ≥105°F today · 25 d/yr by 30 yrs out
- Wind 10/10 Extreme 99% chance of damaging wind over 30 yrs
- Air quality 2/10 Low 1 unhealthy d/yr today · 1 by 30 yrs out
Nearby sold comps map
Loading sold comps map…
Walkable amenities ~0.75 mi
Loading nearby amenities…
Taxation est. · year 1
- Rental income
- $40,644
- − Mortgage interest
- −$16,127
- − Property taxes
- −$3,071
- − Insurance
- −$1,440
- − Repairs & maintenance
- −$3,252
- − Management
- −$3,252
- − Depreciation
- −$8,375
- Taxable income
- $5,128
- Est. tax owed @ 24.0%
- −$1,231
- After-tax cash flow
- $8,250/yr
For passive investors: Depreciation is non-cash, so a rental often shows a tax loss while cash-flowing — sheltering income. Rental losses are passive: they offset passive income freely, and up to $25,000/yr can offset ordinary (W-2) income if you actively participate and your MAGI is under $100k (phasing out to $0 by $150k); unused losses carry forward. On sale, claimed depreciation is recaptured at up to 25%, and gains may owe capital-gains tax (a 1031 exchange can defer both). Figures are a year-1 estimate at your 24.0% rate — not tax advice; consult a CPA.
Schools (NCES district)
- District
- Palm Beach
- NCES district ID
- 1201500
- Math proficiency
- 46% ▼ -16.00%
- Reading proficiency
- 53% ▼ -4.00%
- Median HH income
- $53,943
- Composite
- 42.72/100
- National rank
- #3160
- State rank
- #34 of 73 in FL
Livability — West Palm Beach
- Score
- 82/100
- State rank
- #75
- US rank
- #1255
Category grades
Schools grade is shown separately in the Schools card above.
Census & demographics
- Census place
- West Palm Beach, FL
- County
- Palm Beach County · 1,438,312 people
- City population
- 222,012
- Metro
- Miami-Fort Lauderdale-Pompano Beach, FL
- Population (ZIP)
- 34,851
- Household income
- $59,993
- Rent vs Own
- Severe rent burden
- 2157.0
Population outlook (Palm Beach County) Hauer SSP2
- Today (2025)
- 1,637,487 people
- By 2030
- 1,743,255 · +6.5%
- By 2040
- 1,948,712 · +19.0%
- By 2050
- 2,132,979 · +30.3%
- By 2075
- 2,530,027 · +54.5%
- By 2100
- 2,706,979 · +65.3%
Race, ethnicity, and origin ACS 2023
- Neighborhood character
- Diverse neighborhood (Simpson 0.62)
- Race & ethnicity
- Black 54% White 21% Hispanic / Latino 20% Two or more races 13% Asian 2%
- Hispanic origin (detail)
- Mexican 2% Puerto Rican 2% Cuban 2%
- Common ancestry
- Hispanic 8% Lithuanian 1% Romanian 1%
- Foreign-born
- 26% · Canada, Vietnam, Jamaica
- Languages at home
- 72% English-only · Spanish 17% French/Haitian/Cajun 8% Other Indo-European 1%
Political lean MEDSL · Palm Beach
- 2024 margin
- Toss-up / Even · D 50.0% · R 49.2%
- 2008→2024 swing
- -22.1pp toward R · 2008: 22.9pp · 2024: 0.8pp
- All cycles
- 2024: D+0.8 2020: D+12.8 2016: D+15.3 2012: D+17.0 2008: D+22.9
Not yet ingested
- Civics
- —
Market trends
- HPI YoY
- ▼ -299.26%
- Current HPI
- 363.3995
- Rent YoY
- ▲ 3.08%
- Metro
- Miami-Fort Lauderdale-Pompano Beach, FL
- State GDP YoY
- ▲ 3.28%
- F500 in state
- 36
Industry mix (Fortune 500 HQ in FL)
| Industry | F500 HQs | Revenue |
|---|---|---|
| Industrial Technology | 2 | $29B |
|
||
| Insurance | 2 | $17B |
|
||
| Retail | 1 | $60B |
|
||
| Technology Distribution | 1 | $58B |
|
||
| Homebuilding | 1 | $35B |
|
||
| Technology Manufacturing | 1 | $35B |
|
||
Price history
+1499.4% since first listed8 events — show timeline
- 2026-06-18 Listed $287,900 Beaches MLS
- 2020-06-05 Listing Removed — Beaches MLS
- 2020-04-08 Price Changed $121,000 Beaches MLS
- 2020-02-12 Price Changed $130,000 Beaches MLS
- 2020-01-22 Price Changed $139,000 Beaches MLS
- 2019-12-16 Price Changed $144,000 Beaches MLS
- 2019-11-29 Listed $154,000 Beaches MLS
- 1995-12-11 Sold (Public Records) $18,000 Public Records
Property tax history
+8.3%/yrLatest (2025): $3,071 · +8.1% YoY. Source: county tax records.
Cash-flow waterfall
monthlySold comps — $/sqft
last 12 mo · ≤1 miLoading sold comps…