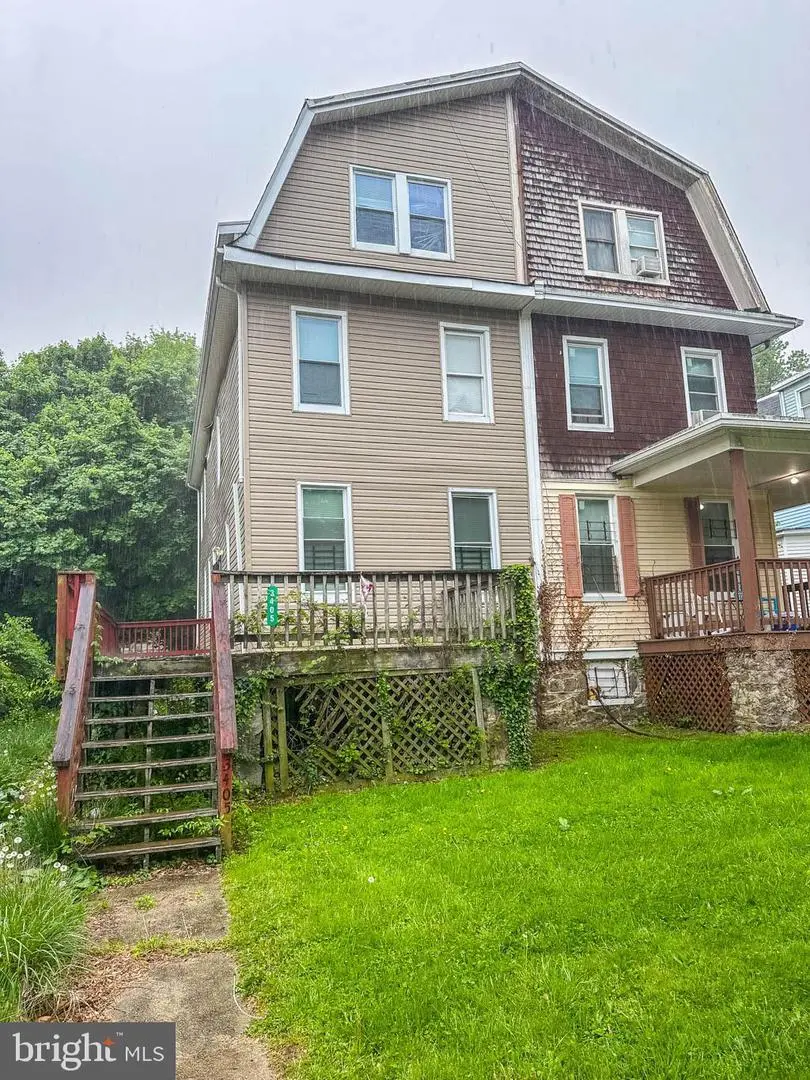
3405 Gwynns Falls Pkwy · Baltimore, MD
Flood risk 1/10 · Minimal
- FEMA flood zone
- X (unshaded)
- Chance of flooding over 30 yrs
- 0.0%
- Est. flood insurance / yr
- $473 – $860
Fire risk 1/10 · Minimal
- Est. fire insurance / yr
- $755 – $1,403
Heat risk 7/10 · Major
- Hot days now (above 103°F)
- 7 days/yr
- Hot days in 30 yrs
- 15 days/yr
Wind risk 6/10 · Moderate
- Chance of severe wind over 30 yrs
- 27.0%
Air-quality risk 3/10 · Minor
- Unhealthy air days now
- 3 days/yr
- Unhealthy air days in 30 yrs
- 4 days/yr
Risk factors via First Street. Map © Google.
Why this score? — see what drove the B grade
The composite is a weighted blend of 9 inputs, each scored 0–100. Each bar is that input's sub-score; the figure is the points it added to the 100-point composite (weight × sub-score).
- Cash flow +30.0/30.0
- ARV discount +15.0/15.0
- DSCR +10.0/10.0
- 1% rule +8.0/10.0
- Rent growth +4.0/5.0
- Livability +3.8/5.0
- Condition / age +2.5/5.0
- Schools +1.0/10.0
- Appreciation +0.0/10.0
$149,900
🖨 Deal sheet 📄 Offer letter ✓ Due diligence
Listing remarks
INVESTMENT OPPORTUNITY! SPACIOUS SEMI-DETACHED COLONIAL WITH LARGE ROOM SIZES. Features include 3 finished levels, main level with a living room and spacious eat-in kitchen, upper 2 levels have a total of 3 generously sized bedrooms and 2 full baths, and an unfinished basement. Perfect opportunity to renovate and resell or fix up and add to your rental portfolio. Cash or hard money only. Sold As-Is. Buyer responsible for clearing any vacant property notice after settlement if one exists.
Key facts
- Built 1920
- Listed 13 days
Property features AI
Finance
- Other: Above-grade finished area estimated at 2,304
- HOA & community: Ground rent $120 annually; Ownership interest: Ground Rent
Exterior
- Utilities: Public water; Public sewer; Electric hot water; Natural gas for heating; Electric cooling
- Home design: Semi-detached structure; Estimated year built
- Construction: Vinyl siding; Other foundation; Above-grade and below-grade structures
- Exterior features: Not in a federal flood zone
Interior
- Kitchen: Refrigerator; Gas oven/range; Built-in microwave; Dishwasher
- Bedrooms: One bedroom on the first upper level; Two bedrooms on the second upper level
- Bathrooms: Two full bathrooms (one on first upper level, one on second upper level)
- Heating & cooling: Forced air heating (natural gas); Electric cooling (other type)
- Interior features: Unfinished basement; Living room; Dining room; Kitchen
- Laundry & utility: Washer; Dryer; Electric hot water
Neighborhood map
What this means for you Summary
Snapshot
- This is a 3-bed/2.0-bath townhouse listed at $150k.
Deal economics
- At list price, monthly cash flow is $617 ($7k/yr) — positive.
- The deal already cash-flows at list — no discount required.
- Meets the 1% rule at list price ($2k rent vs $150k).
- Cap rate 11.2% vs local median 6.0% in Baltimore — top-decile yield for the area; either an underpriced asset or a hidden risk that comps aren't pricing in. Stress-test before assuming the spread holds.
Location & tenants
- Location reads 76/100 on livability (#90 in MD, #3,396 nationally) — a middle-class / working-renter tenant base. Strengths: amenities A+, commute A+, housing A+; Watch: schools D, crime F.
- Baltimore City Public Schools (urban): math 7% / reading 16% proficiency, ranked #24 of 24 in MD (top 100%) — low school quality limits family demand, transient renter base, plan for 1-2y turnover; 79% free/reduced lunch — lower-income household profile, screen leases tightly.
- Market conditions: Rents rising fast (+6.1%/yr); 252 active listings in the ZIP; 27 comparable units currently listed for rent nearby; rentals at typical pace (median 24d on market — plan ~3-4 weeks tenant-placement turnaround); lower-income renter base — watch delinquency; 1,273 units permitted in Baltimore city in 2024 (1,104 in 5+ unit buildings).
- At $1,949/mo this rent would consume 56% of the median local household income ($42k/yr) (locally 2264% of renters already pay >50% of income on rent) — very limited rent-growth headroom before tenants either downsize or default.
Forward outlook
- Local home prices are declining (-3.0%/yr); year-one equity from $1k of loan paydown is wiped out by about $4k of value loss. Plan a longer hold.
- Baltimore County population projected to shrink 4% by 2050 — rents likely to lag national; underwrite the cash flow, not the appreciation.
- At projected returns (-3.0% appreciation + 6.1% rent growth), your $42k cash investment doubles in ~6 years — after that, you're playing with house money.
Negotiation context
- Only 13 days on market — expect competitive offers; lowballing is unlikely to land.
- 3 sale attempts since 8y ago with the ask held roughly flat each time — persistent listings suggest the price (not the market) is what's stuck; bring a comps-based counter.
Risks & watch-outs
- Watch-outs: built in 1920 — expect roof / HVAC / electrical / plumbing capex.
- Climate carrying-cost: major wind risk, 27% chance of damaging wind over 30y; extreme-heat days projected 7→15/yr by 2055 (HVAC capex compounding) — expect insurance premiums to compound above CPI over the hold.
Questions for the listing agent
- Built in 1920 — when were the roof, HVAC, electrical panel, plumbing, and water heater last replaced?
- Is there a deadline driving the sale (1031 exchange, divorce, estate, relocation)? That informs how much negotiation room exists.
- Schools are D-rated, which usually means shorter tenancies and higher turnover. Who's the typical renter profile here, and what's been the actual vacancy rate?
- Crime grade is F in this area — have there been break-ins, vandalism, or insurance claims at this property in the last 3 years? What carrier currently insures it and at what premium?
- What's the average days-on-market for RENTAL listings here right now (not sales)? A rising rental-DOM trend means longer vacancies and softer asking-rent achievability than the comps imply.
- What's the recent tenant-quality profile in this submarket — average credit score on applications, eviction rate, late-payment / NSF rate, and stable-employment percentage? A property-management company in the area should have these aggregated.
- How much new for-sale + rental construction is in the pipeline within 1–3 miles? Heavy new supply typically softens prices + rents 12–24 months out; constrained supply supports both.
Investment metrics
- 1% rule
- 1.30% ✓
- Cap rate
- 11.23%
- Cash-on-cash
- 17.64%
- DSCR
- 1.78
- GRM
- 6.4
CMA / ARV
- ARV (on-the-fly)
- $271,872
- Comps found
- 12
Show comp detail 12 sales within ~0.75 mi
| Address | Dist | Beds/Ba | Sqft | Sold | Price | $/sf | Match |
|---|---|---|---|---|---|---|---|
| 2111 N Ellamont St | 0.25mi | 4/2.0 (+1) | 2,244 (-3%) | 6mo | $265,000 | $118 | 74 |
| 2909 Gwynns Falls Pkwy | 0.44mi | 4/3.5 (+1) | 2,304 (0%) | 9mo | $272,500 | $118 | 61 |
| 1923 N Longwood St N | 0.48mi | 3/1.0 | 2,474 (+7%) | 5mo | $75,000 | $30 | 57 |
| 3804 Woodhaven Ave | 0.65mi | 4/2.5 (+1) | 2,376 (+3%) | 1mo | $280,000 | $118 | 57 |
| 3121 Gwynns Falls Pkwy | 0.24mi | 4/3.5 (+1) | 2,100 (-9%) | 9mo | $285,000 | $136 | 56 |
| 2031 N Dukeland St | 0.62mi | 4/3.0 (+1) | 2,200 (-4%) | 7mo | $270,000 | $123 | 49 |
| 3001 Elgin Ave | 0.36mi | 4/2.0 (+1) | 1,960 (-15%) | 7mo | $252,750 | $129 | 48 |
| 4015 Duvall Ave | 0.69mi | 4/2.5 (+1) | 2,016 (-12%) | 0mo | $225,000 | $112 | 40 |
| 2915 Walbrook Ave | 0.53mi | 3/3.5 | 1,990 (-14%) | 10mo | $245,000 | $123 | 38 |
| 1637 N Hilton St | 0.51mi | 4/3.5 (+1) | 2,568 (+12%) | 9mo | $269,000 | $105 | 38 |
| 2313 Braddish Ave | 0.73mi | 3/2.0 | 1,980 (-14%) | 8mo | $239,000 | $121 | 35 |
| 3032 Chelsea Ter | 0.72mi | 3/3.5 | 2,030 (-12%) | 9mo | $234,500 | $116 | 33 |
Match score weights: distance 35% · size 25% · config 20% · recency 20%. Top-matched comps best support the ARV.
Projected returns pro-forma
-3.0% appreciation · 6.1% rent growth · sell at horizon
- IRR
- 12.3%
- Equity multiple
- 1.51×
- Total profit
- $21,233
- Equity at exit
- $22,351
- IRR
- 23.4%
- Equity multiple
- 3.30×
- Total profit
- $96,341
- Equity at exit
- $12,961
Cash invested: $41,972 (down + closing). Projections, not guarantees.
Landlord ↔ Tenant lean methodology
- Overall (CITY)
- 12 Strongly Tenant-Friendly
- State Maryland
- 27 Tenant-Leaning · D+14
- County
- — inherits STATE
- City Baltimore
- 12 Strongly Tenant-Friendly · D+58
ZIP-level market 21216
- Rents YoY
- 6.1%
- Active inventory
- 252
- Price-to-rent
- 6.4×
Monthly cashflow live
- Estimated rent
- $1,949 high interval (Pro) →
- Mortgage (P&I)
- −$786
- Tax from tax record
- −$74 /mo · $893/yr
- Insurance
- −$62
- HOA
- −$0
- Vacancy / Maint / Mgmt
- −$409
- Net cashflow
- $617
Break-even live
UW: 25.0% down · 7.5% · 30yr · 1.5% tax · 5.0% vac · 8.0% maint · 8.0% mgmt
Financing live
Cash to close
- Down payment
- $37,475
- Closing costs
- $4,497
- Reserves months
- —
- Total cash needed
- —
Loan-product check · same deal, 3 products live
Conventional
25% down · 7.5% · 30yr
- Down + closing
- —
- Monthly P&I
- —
- Monthly cashflow
- —
- DSCR
- —
- Eligible?
- —
Personal DTI + credit; lowest rate.
DSCR
20% down · 8.5% · 30yr
- Down + closing
- —
- Monthly P&I
- —
- Monthly cashflow
- —
- DSCR
- —
- Eligible?
- —
No personal income docs; deal must DSCR.
Hard money
10% down · 12.0% · 12mo
- Down + closing
- —
- Monthly P&I
- —
- Monthly cashflow
- —
- DSCR
- —
- Eligible?
- —
Short-term bridge; refi at stabilization.
Rent comps 27 comps
| Address | Beds | Baths | Sqft | Rent | $/sqft | DOM | Units | Dist |
|---|---|---|---|---|---|---|---|---|
| 3414 Alto Rd Unit 1ST Baltimore, MD | 2.0 | 1.0 | 2824 | $1,850 | $0.66 | 23d | 1 | 0.25mi |
| 3414 Alto Rd Unit 2ND Baltimore, MD | 3.0 | 1.0 | 2824 | $2,000 | $0.71 | 23d | 1 | 0.25mi |
| 3213 Vickers Rd Unit 1 Baltimore, MD | 2.0 | 1.0 | 2568 | $1,700 | $0.66 | 23d | 1 | 0.32mi |
| 3030 Windsor Ave Baltimore, MD | 4.0 | 1.5 | 2124 | $1,995 | $0.94 | 4d | 1 | 0.34mi |
| 3904 Gwynns Falls Pkwy Baltimore, MD | 3.0 | 2.0 | 1772 | $2,600 | $1.47 | 43d | 1 | 0.37mi |
| 2917 Clifton Ave Baltimore, MD | 4.0 | 4.0 | 1700 | $2,150 | $1.26 | 23d | 1 | 0.50mi |
| 1633 N Hilton St Baltimore, MD | 4.0 | 2.5 | 1920 | $2,600 | $1.35 | 17d | 1 | 0.53mi |
| 3411 Fairview Ave Baltimore, MD | 2.0 | 1.0 | 2949 | $1,600 | $0.54 | 17d | 1 | 0.55mi |
| 2812 Clifton Ave Baltimore, MD | 3.0 | 1.5 | 1650 | $1,850 | $1.12 | 43d | 1 | 0.57mi |
| 1530 N Rosedale St Baltimore, MD | 3.0 | 2.0 | 1641 | $1,895 | $1.15 | 14d | 1 | 0.67mi |
| 1513 N Ellamont St Baltimore, MD | 3.0 | 1.0 | 1700 | $1,700 | $1.00 | 23d | 1 | 0.68mi |
| 3213 Dorchester Rd Baltimore, MD | 2.0 | 1.0 | 2640 | $1,850 | $0.70 | 23d | 1 | 0.83mi |
| 3104 Tioga Pkwy Baltimore, MD | 3.0 | 2.0 | 1640 | $2,050 | $1.25 | 21d | 1 | 0.89mi |
| 3914 Maine Ave Unit 3 Baltimore, MD | 2.0 | 1.0 | 2127 | $1,150 | $0.54 | 43d | 1 | 1.03mi |
| 2405 W North Ave Baltimore, MD | 4.0 | 3.0 | 1826 | $1,900 | $1.04 | 4d | 1 | 1.06mi |
| 3204 Sequoia Ave Baltimore, MD | 4.0 | 2.5 | 1791 | $2,600 | $1.45 | 43d | 1 | 1.09mi |
| 2305 Wichita Ave Unit 1 Baltimore, MD | 3.0 | 1.0 | 1950 | $1,300 | $0.67 | 23d | 1 | 1.15mi |
| 3700 Woodridge Rd Baltimore, MD | 3.0 | 1.5 | 1955 | $1,950 | $1.00 | 43d | 1 | 1.16mi |
| 2128 N Pulaski St Baltimore, MD | 4.0 | 3.0 | 2166 | $2,200 | $1.02 | 43d | 1 | 1.25mi |
| 3324 Edmondson Ave Baltimore, MD | 3.0 | 2.5 | 2300 | $1,995 | $0.87 | 21d | 1 | 1.36mi |
| 3619 Edmondson Ave Baltimore, MD | 4.0 | 3.5 | 1962 | $2,800 | $1.43 | 43d | 1 | 1.41mi |
| 2201 Whittier Ave Baltimore, MD | 4.0 | 2.0 | 1750 | $1,700 | $0.97 | 17d | 1 | 1.42mi |
| 2201 Whittier Ave Baltimore, MD | 4.0 | 2.0 | 1750 | $1,700 | $0.97 | 43d | 1 | 1.42mi |
| 2922 Edmondson Ave Baltimore, MD | 3.0 | 2.0 | 1620 | $1,900 | $1.17 | 43d | 1 | 1.43mi |
| 2301 Whittier Ave Unit 3 Baltimore, MD | 2.0 | 2.0 | 3132 | $1,650 | $0.53 | 23d | 1 | 1.47mi |
| 2301 Whittier Ave Unit 2 Baltimore, MD | 2.0 | 2.0 | 3132 | $1,400 | $0.45 | 23d | 1 | 1.47mi |
| 2301 Whittier Ave Unit 1 Baltimore, MD | 2.0 | 1.0 | 3132 | $1,400 | $0.45 | 23d | 1 | 1.47mi |
Listing history 9 events
-
2026-06-18days on market $149,900 Active 13 DOM
-
2026-06-17days on market $149,900 Active 12 DOM
-
2026-06-16days on market $149,900 Active 11 DOM
-
2026-06-15days on market $149,900 Active 10 DOM
-
2026-06-13days on market $149,900 Active 8 DOM
-
2026-06-09days on market $149,900 Active 4 DOM
-
2026-06-08days on market $149,900 Active 3 DOM
-
2026-06-07remarks 493-char remark
-
2026-06-07$149,900 Active 2 DOM
ⓘ Source: listings_history table (triggers on properties + properties_extension) + one-shot
backfill from property_details.listing_events for pre-trigger history.
Tax reassessment forecast MD · Partial reset (capped growth)
- Current annual tax
- $893 · $74/mo
- Projected year-2 tax
- $1,263 · $105/mo
- Expected delta
- +$371/yr (+$31/mo · 41.5%)
ⓘ Screening estimate from a state-policy table — verify with the county assessor before closing.
Climate risk First Street
- Flood 1/10 Low FEMA zone X (unshaded) · 0% chance over 30 yrs
- Wildfire 1/10 Low
- Heat 7/10 Severe 7 d/yr ≥103°F today · 15 d/yr by 30 yrs out
- Wind 6/10 Major 27% chance of damaging wind over 30 yrs
- Air quality 3/10 Moderate 3 unhealthy d/yr today · 4 by 30 yrs out
Nearby sold comps map
Loading sold comps map…
Walkable amenities ~0.75 mi
Loading nearby amenities…
Taxation est. · year 1
- Rental income
- $23,391
- − Mortgage interest
- −$8,397
- − Property taxes
- −$893
- − Insurance
- −$750
- − Repairs & maintenance
- −$1,871
- − Management
- −$1,871
- − Depreciation
- −$4,361
- Taxable income
- $5,249
- Est. tax owed @ 24.0%
- −$1,260
- After-tax cash flow
- $6,144/yr
For passive investors: Depreciation is non-cash, so a rental often shows a tax loss while cash-flowing — sheltering income. Rental losses are passive: they offset passive income freely, and up to $25,000/yr can offset ordinary (W-2) income if you actively participate and your MAGI is under $100k (phasing out to $0 by $150k); unused losses carry forward. On sale, claimed depreciation is recaptured at up to 25%, and gains may owe capital-gains tax (a 1031 exchange can defer both). Figures are a year-1 estimate at your 24.0% rate — not tax advice; consult a CPA.
Schools (NCES district)
- District
- Baltimore City Public Schools
- NCES district ID
- 2400090
- Math proficiency
- 7% ▼ -9.00%
- Reading proficiency
- 16% ▼ -5.00%
- Median HH income
- $42,108
- Composite
- 10.08/100
- National rank
- #9805
- State rank
- #24 of 24 in MD
Livability — Baltimore
- Score
- 76/100
- State rank
- #90
- US rank
- #3396
Category grades
Schools grade is shown separately in the Schools card above.
Census & demographics
- Census place
- Baltimore, MD
- County
- Baltimore City · 558,601 people
- City population
- 588,727
- Metro
- Baltimore-Columbia-Towson, MD
- Population (ZIP)
- 29,426
- Household income
- $42,031
- Rent vs Own
- Severe rent burden
- 2264.0
Population outlook (Baltimore County) Hauer SSP2
- Today (2025)
- 624,249 people
- By 2030
- 621,541 · -0.4%
- By 2040
- 609,756 · -2.3%
- By 2050
- 597,249 · -4.3%
- By 2075
- 552,236 · -11.5%
- By 2100
- 513,934 · -17.7%
Race, ethnicity, and origin ACS 2023
- Neighborhood character
- Predominantly Black (91%)
- Race & ethnicity
- Black 91% Hispanic / Latino 4% Two or more races 3% White 2%
- Foreign-born
- 3% · Canada
- Languages at home
- 96% English-only · Spanish 3% French/Haitian/Cajun 1%
Political lean MEDSL · Baltimore
- 2024 margin
- Solid D (+73.0) · D 85.2% · R 12.2% · Other 2.6%
- 2008→2024 swing
- -2.5pp toward R · 2008: 75.5pp · 2024: 73.0pp
- All cycles
- 2024: D+73.0 2020: D+76.6 2016: D+74.6 2012: D+76.4 2008: D+75.5
Not yet ingested
- Civics
- —
Market trends
- HPI YoY
- ▼ -107.42%
- Current HPI
- 164.3933
- Rent YoY
- ▲ 6.10%
- Metro
- Baltimore-Columbia-Towson, MD
- State GDP YoY
- ▲ 2.97%
- F500 in state
- 12
Industry mix (Fortune 500 HQ in MD)
| Industry | F500 HQs | Revenue |
|---|---|---|
| Aerospace / Defense | 1 | $71B |
|
||
| Utilities | 1 | $25B |
|
||
| Hotels | 1 | $24B |
|
||
| Consumer Goods | 1 | $7B |
|
||
| Real Estate | 1 | $6B |
|
||
| Chemicals | 1 | $2B |
|
||
Price history
+199.8% since first listed18 events — show timeline
- 2026-06-05 Listed $149,900 BRIGHT MLS
- 2024-01-29 Sold (Public Records) $295,000 Public Records
- 2023-07-31 Listing Removed — BRIGHT MLS
- 2023-05-05 Price Changed $189,900 BRIGHT MLS
- 2023-02-03 Price Changed $199,999 BRIGHT MLS
- 2023-01-19 Price Changed $205,000 BRIGHT MLS
- 2023-01-19 Price Changed $205,000 BRIGHT MLS
- 2023-01-19 Price Changed $205,000 BRIGHT MLS
- 2022-11-18 Price Changed $210,000 BRIGHT MLS
- 2022-11-18 Price Changed $210,000 BRIGHT MLS
- 2022-11-18 Price Changed $210,000 BRIGHT MLS
- 2022-09-26 Price Changed $215,000 BRIGHT MLS
- 2022-06-30 Price Changed $230,000 BRIGHT MLS
- 2022-04-18 Listed $275,000 BRIGHT MLS
- 2018-11-15 Sold (Public Records) $355,000 Public Records
- 2018-11-04 Listing Removed — BRIGHT MLS
- 2018-11-03 Listed $50,000 BRIGHT MLS
- 2018-11-01 Sold (MLS) $50,000 BRIGHT MLS
Property tax history
-1.3%/yrLatest (2025): $893 · +3.6% YoY. Source: county tax records.
Cash-flow waterfall
monthlySold comps — $/sqft
last 12 mo · ≤1 miLoading sold comps…