1195 Gifford Tram Rd · Perla, AR
Flood risk 1/10 · Minimal
- FEMA flood zone
- X (unshaded)
- Chance of flooding over 30 yrs
- 0.0%
- Est. flood insurance / yr
- $507 – $1,088
Fire risk 7/10 · Major
- Est. fire insurance / yr
- $1,499 – $2,785
Heat risk 6/10 · Moderate
- Hot days now (above 111°F)
- 7 days/yr
- Hot days in 30 yrs
- 20 days/yr
Wind risk 4/10 · Minor
- Chance of severe wind over 30 yrs
- 14.0%
Air-quality risk 2/10 · Minimal
- Unhealthy air days now
- 0 days/yr
- Unhealthy air days in 30 yrs
- 1 days/yr
Risk factors via First Street. Map © Google.
Why this score? — see what drove the D grade
The composite is a weighted blend of 9 inputs, each scored 0–100. Each bar is that input's sub-score; the figure is the points it added to the 100-point composite (weight × sub-score).
- Cash flow +17.2/30.0
- ARV discount +7.5/15.0
- DSCR +5.3/10.0
- 1% rule +3.3/10.0
- Schools +3.2/10.0
- Livability +3.1/5.0
- Rent growth +2.5/5.0
- Condition / age +2.5/5.0
- Appreciation +0.0/10.0
$129,900
🖨 Deal sheet 📄 Offer letter ✓ Due diligence
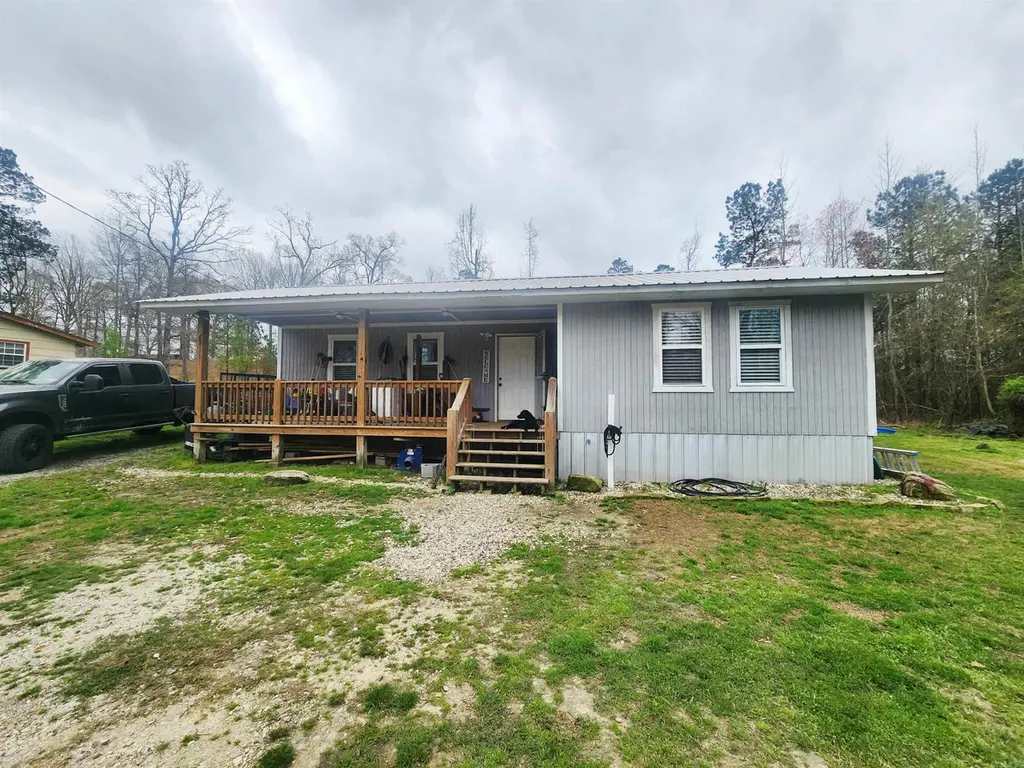
Listing remarks
This home is priced to sell!! 1195 Gifford Tram is 1 bedroom, 1 bathroom, 832 sq ft built in 2021. The home is 100% move in ready. Wood planked walls, open floor plan, kitchen is updated with nice appliances, LVP flooring, very large master closet and metal roof. Must see.
Key facts
- Open floor plan
- Metal roof
- Updated kitchen
Tags
Property features AI
Finance
- Other: Approximately 5.2 acres (per courthouse); Approximate living area 1,552
- Financial info: Financing options may include FHA, conventional, cash, or other (see remarks)
Exterior
- Utilities: Public water; Septic system; Municipal electric service (Entergy); Insulated windows
- Home design: Wood exterior
- Construction: Crawl space foundation; Metal and 3-tab shingle roof
- Exterior features: Deck; Paved road access; Sloped, down-slope lot
Interior
- Kitchen: Free-standing stove; Electric range
- Flooring: Vinyl flooring
- Bathrooms: 2 full bathrooms
- Heating & cooling: Central electric heating; Central electric cooling; Window air conditioning units
- Interior features: Washer and dryer connections (dryer is electric); Electric water heater; Sheetrock and paneling walls/ceilings; Vinyl floors
- Laundry & utility: Laundry room
Neighborhood map
What this means for you Summary
Snapshot
- This is a 3-bed/1.0-bath single-family listed at $130k.
Deal economics
- At list price, monthly cash flow is $92 ($1k/yr) — positive.
- The deal already cash-flows at list — no discount required.
- To meet the 1% rule (rent ≥ 1% of price), the offer needs to be $107k (17.3% below list).
- Recommended offer: $107k (17.3% below list) — sets the bar for 1% rule.
Location & tenants
- Location reads 62/100 on livability (#221 in AR) — a middle-class / working-renter tenant base. Strengths: cost of living A+, housing A+, health & safety A+; Watch: crime F, amenities F, commute F.
- Glen Rose School District (rural): math 42% / reading 33% proficiency, ranked #84 of 238 in AR (top 35%) — families likely to look elsewhere, expect single-tenant / working-renter base with shorter leases.
- Zoned schools: Glen Rose Elementary School (math 47% / reading 37%, grade F, #173 of 454 statewide, top 43%, 373 students, 54% FRL); Glen Rose High School (math 32% / reading 22%, grade F, #164 of 292 statewide, top 61%, 304 students, 34% FRL) — zoned schools at 44% FRL track the district average.
- Market conditions: 171 active listings in the ZIP; 4 units permitted in Hot Spring County in 2024 (0 in 5+ unit buildings).
Forward outlook
- Local home prices are declining (-3.0%/yr); year-one equity from $898 of loan paydown is wiped out by about $4k of value loss. Plan a longer hold.
- Hot Spring County population projected to shrink 3% by 2050 — rents likely to lag national; underwrite the cash flow, not the appreciation.
Negotiation context
- It's been on market 26 days — a 2% lower offer ($128k) is reasonable based on typical stale-listing flexibility.
- 2 sale attempts with the ask held roughly flat each time — persistent listings suggest the price (not the market) is what's stuck; bring a comps-based counter.
- Current owner paid $10k; list at $130k implies a 1199% gain — meaningful room to come down on a strong offer.
Risks & watch-outs
- Climate carrying-cost: major wildfire risk; extreme-heat days projected 7→20/yr by 2055 (HVAC capex compounding) — expect insurance premiums to compound above CPI over the hold.
Questions for the listing agent
- Is there a deadline driving the sale (1031 exchange, divorce, estate, relocation)? That informs how much negotiation room exists.
- Schools are F-rated, which usually means shorter tenancies and higher turnover. Who's the typical renter profile here, and what's been the actual vacancy rate?
- Crime grade is F in this area — have there been break-ins, vandalism, or insurance claims at this property in the last 3 years? What carrier currently insures it and at what premium?
- The area grade is low — what's the realistic commute time and amenity access for the typical tenant pool here? Any planned neighborhood developments (good or bad) we should know about?
- What's the average days-on-market for RENTAL listings here right now (not sales)? A rising rental-DOM trend means longer vacancies and softer asking-rent achievability than the comps imply.
- What's the recent tenant-quality profile in this submarket — average credit score on applications, eviction rate, late-payment / NSF rate, and stable-employment percentage? A property-management company in the area should have these aggregated.
- How much new for-sale + rental construction is in the pipeline within 1–3 miles? Heavy new supply typically softens prices + rents 12–24 months out; constrained supply supports both.
Investment metrics
- 1% rule
- 0.83% ✗
- Cap rate
- 7.14%
- Cash-on-cash
- 3.02%
- DSCR
- 1.13
- GRM
- 10.1
CMA / ARV
No comps found within radius.
Projected returns pro-forma
-3.0% appreciation · 3.0% rent growth · sell at horizon
- IRR
- -11.6%
- Equity multiple
- 0.58×
- Total profit
- $-15,286
- Equity at exit
- $19,369
- IRR
- -2.5%
- Equity multiple
- 0.83×
- Total profit
- $-6,083
- Equity at exit
- $11,231
Cash invested: $36,372 (down + closing). Projections, not guarantees.
Landlord ↔ Tenant lean methodology
- Overall (STATE)
- 92 Strongly Landlord-Friendly
- State Arkansas
- 92 Strongly Landlord-Friendly · R+14
- County
- — inherits STATE
- City
- — inherits STATE
ZIP-level market 72104
- Home prices YoY
- -7.3%
- Active inventory
- 171
- Price-to-rent
- 10.1×
Monthly cashflow live
- Estimated rent
- $1,075 medium interval (Pro) →
- Mortgage (P&I)
- −$681
- Tax from tax record
- −$22 /mo · $265/yr
- Insurance
- −$54
- HOA
- −$0
- Vacancy / Maint / Mgmt
- −$226
- Net cashflow
- $92
Break-even live
UW: 25.0% down · 7.5% · 30yr · 1.5% tax · 5.0% vac · 8.0% maint · 8.0% mgmt
Financing live
Cash to close
- Down payment
- $32,475
- Closing costs
- $3,897
- Reserves months
- —
- Total cash needed
- —
Loan-product check · same deal, 3 products live
Conventional
25% down · 7.5% · 30yr
- Down + closing
- —
- Monthly P&I
- —
- Monthly cashflow
- —
- DSCR
- —
- Eligible?
- —
Personal DTI + credit; lowest rate.
DSCR
20% down · 8.5% · 30yr
- Down + closing
- —
- Monthly P&I
- —
- Monthly cashflow
- —
- DSCR
- —
- Eligible?
- —
No personal income docs; deal must DSCR.
Hard money
10% down · 12.0% · 12mo
- Down + closing
- —
- Monthly P&I
- —
- Monthly cashflow
- —
- DSCR
- —
- Eligible?
- —
Short-term bridge; refi at stabilization.
Listing history 5 events
-
2026-04-12status Under Contract
-
2026-04-02status Back on Market
-
2026-03-29historical Take Backups
-
2026-03-17$129,900 New Listing
-
2011-02-28soldstatus $10,000
ⓘ Source: listings_history table (triggers on properties + properties_extension) + one-shot
backfill from property_details.listing_events for pre-trigger history.
Tax reassessment forecast AR · Resets to sale price
- Current annual tax
- $265 · $22/mo
- Projected year-2 tax
- $831 · $69/mo
- Expected delta
- +$566/yr (+$47/mo · 213.9%)
ⓘ Screening estimate from a state-policy table — verify with the county assessor before closing.
Climate risk First Street
- Flood 1/10 Low FEMA zone X (unshaded) · 0% chance over 30 yrs
- Wildfire 7/10 Severe
- Heat 6/10 Major 7 d/yr ≥111°F today · 20 d/yr by 30 yrs out
- Wind 4/10 Moderate 14% chance of damaging wind over 30 yrs
- Air quality 2/10 Low 0 unhealthy d/yr today · 1 by 30 yrs out
Nearby sold comps map
Loading sold comps map…
Walkable amenities ~0.75 mi
Loading nearby amenities…
Taxation est. · year 1
- Rental income
- $12,896
- − Mortgage interest
- −$7,276
- − Property taxes
- −$265
- − Insurance
- −$650
- − Repairs & maintenance
- −$1,032
- − Management
- −$1,032
- − Depreciation
- −$3,779
- Taxable loss
- −$1,137
- Est. tax savings @ 24.0%
- +$273
- After-tax cash flow
- $1,372/yr
For passive investors: Depreciation is non-cash, so a rental often shows a tax loss while cash-flowing — sheltering income. Rental losses are passive: they offset passive income freely, and up to $25,000/yr can offset ordinary (W-2) income if you actively participate and your MAGI is under $100k (phasing out to $0 by $150k); unused losses carry forward. On sale, claimed depreciation is recaptured at up to 25%, and gains may owe capital-gains tax (a 1031 exchange can defer both). Figures are a year-1 estimate at your 24.0% rate — not tax advice; consult a CPA.
Schools (NCES district)
- District
- Glen Rose School District
- NCES district ID
- 0506630
- Math proficiency
- 42% ▼ -13.00%
- Reading proficiency
- 33% ▼ -7.00%
- Median HH income
- $47,423
- Composite
- 32.22/100
- National rank
- #5772
- State rank
- #84 of 238 in AR
Livability — Perla
- Score
- 62/100
- State rank
- #221
- US rank
- #16895
Category grades
Schools grade is shown separately in the Schools card above.
Census & demographics
- Population (ZIP)
- 23,222
Population outlook (Hot Spring County) Hauer SSP2
- Today (2025)
- 34,464 people
- By 2030
- 34,659 · +0.6%
- By 2040
- 34,486 · +0.1%
- By 2050
- 33,419 · -3.0%
- By 2075
- 28,702 · -16.7%
- By 2100
- 21,415 · -37.9%
Race, ethnicity, and origin ACS 2023
- Neighborhood character
- Predominantly White (75%)
- Race & ethnicity
- White 75% Black 16% Two or more races 5% Hispanic / Latino 4%
- Common ancestry
- Serbian 2% Slovak 1% Iranian 1%
- Foreign-born
- 1% · Canada
- Languages at home
- 97% English-only · Spanish 3%
Political lean MEDSL · Hot Spring
- 2024 margin
- Solid R (+52.2) · D 22.9% · R 75.1% · Other 1.9%
- 2008→2024 swing
- -27.7pp toward R · 2008: -24.4pp · 2024: -52.2pp
- All cycles
- 2024: R+52.2 2020: R+48.7 2016: R+42.5 2012: R+29.0 2008: R+24.4
Not yet ingested
- Civics
- —
Market trends
- HPI YoY
- ▼ -16.79%
- Current HPI
- 211.6419
- Rent YoY
- —
- Metro
- —
- State GDP YoY
- ▲ 3.80%
- F500 in state
- 10
Industry mix (Fortune 500 HQ in AR)
| Industry | F500 HQs | Revenue |
|---|---|---|
| Retail | 1 | $681B |
|
||
| Food / Agriculture | 1 | $53B |
|
||
| Retail / Energy | 1 | $22B |
|
||
| Transportation / Logistics | 1 | $12B |
|
||
| Energy | 1 | $4B |
|
||
Price history
+1199.0% since first listed5 events — show timeline
- 2026-04-12 Pending — CARMLS
- 2026-04-02 Relisted — CARMLS
- 2026-03-29 Contingent — CARMLS
- 2026-03-17 Listed $129,900 CARMLS
- 2011-02-28 Sold (Public Records) $10,000 Public Records
Property tax history
+3.6%/yrLatest (2025): $265 · -64.7% YoY. Source: county tax records.
Cash-flow waterfall
monthlySold comps — $/sqft
last 12 mo · ≤1 miLoading sold comps…