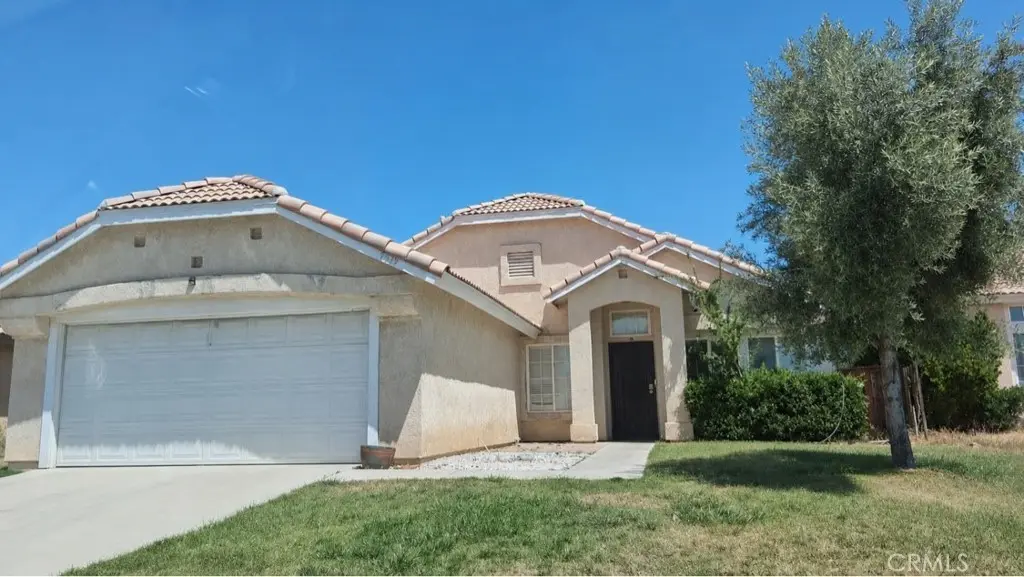
5535 Cisero Dr · Palmdale, CA
Flood risk 1/10 · Minimal
- FEMA flood zone
- X (unshaded)
- Chance of flooding over 30 yrs
- 0.0%
- Est. flood insurance / yr
- $507 – $1,088
Fire risk 7/10 · Major
- Est. fire insurance / yr
- $659 – $1,223
Heat risk 6/10 · Moderate
- Hot days now (above 99°F)
- 3 days/yr
- Hot days in 30 yrs
- 7 days/yr
Wind risk 1/10 · Minimal
- Chance of severe wind over 30 yrs
- —
Air-quality risk 10/10 · Severe
- Unhealthy air days now
- 27 days/yr
- Unhealthy air days in 30 yrs
- 34 days/yr
Risk factors via First Street. Map © Google.
Why this score? — see what drove the D+ grade
The composite is a weighted blend of 9 inputs, each scored 0–100. Each bar is that input's sub-score; the figure is the points it added to the 100-point composite (weight × sub-score).
- ARV discount +15.0/15.0
- Cash flow +14.8/30.0
- DSCR +4.5/10.0
- 1% rule +3.7/10.0
- Livability +2.8/5.0
- Rent growth +2.5/5.0
- Schools +2.5/10.0
- Condition / age +2.5/5.0
- Appreciation +0.0/10.0
$350,000
🖨 Deal sheet (PDF) 📄 Offer letter ✓ Due diligence
Listing remarks MLS
Back on the market, due to previous cancelation. Beautiful very well maintained house in move in condition, new carpet, new kitchen & bathroom floors, granite kitchen counter tops & newly painted inside. Seller has upgraded new window shutters. House is located in a very quiet neighborhood, close to schools, shops, restaurants & freeway access.
Key facts
- Backyard space
- 5,696 sq ft lot
- 2 garage spots
Tags
Property features AI
Finance
- HOA & community: Street lighting; Sidewalks
Exterior
- Parking: Attached 2-car garage; 2 total parking spaces
- Utilities: Public sewer; District/public water
- Home design: Single-family house; Single-story
- Construction: No common walls; Year built from public records
- Exterior features: Front yard; Back yard; No pool
Interior
- Bedrooms: 3 bedrooms on the main level
- Bathrooms: 2 full bathrooms on the main level
- Heating & cooling: Central heating (furnace); Central cooling
- Interior features: One-level home with front entry; Living room; Walk-in closet; Dining room fireplace
- Laundry & utility: Separate laundry room; Gas and electric dryer hookups
Neighborhood map
What this means for you Summary
Snapshot
- This is a 3-bed/2.0-bath single-family listed at $350k.
Deal economics
- At list price, monthly cash flow is $97 ($1k/yr) — positive.
- The deal already cash-flows at list — no discount required.
- To meet the 1% rule (rent ≥ 1% of price), the offer needs to be $304k (13.2% below list).
- Recommended offer: $304k (13.2% below list) — sets the bar for 1% rule.
- Cap rate 6.6% vs local median 4.5% in Palmdale — top-decile yield for the area; either an underpriced asset or a hidden risk that comps aren't pricing in. Stress-test before assuming the spread holds.
Location & tenants
- Location reads 55/100 on livability (#861 in CA) — a working-class tenant base; expect higher turnover. Strengths: housing A+; Watch: crime F, amenities F, cost of living F.
- Palmdale Elementary (suburban): math 20% / reading 31% proficiency, ranked #1,147 of 1,400 in CA (top 82%) — low school quality limits family demand, transient renter base, plan for 1-2y turnover; 69% free/reduced lunch — lower-income household profile, screen leases tightly.
- Zoned schools: Palmdale Learning Plaza (783 students, 80% FRL); Shadow Hills Engineering And Design Magnet Academy (891 students, 92% FRL); William J. (Pete) Knight High (2,793 students, 55% FRL).
- Market conditions: 129 active listings in the ZIP; 12 comparable units currently listed for rent nearby; rentals leasing fast (median 0d on market — plan ~1-2 weeks tenant-placement turnaround); solid renter incomes; 19,697 units permitted in Los Angeles County in 2024 (9,426 in 5+ unit buildings).
- This rent runs 42% of the median local income ($86k/yr) — at the standard rent-burdened threshold; future hikes will face affordability resistance.
Forward outlook
- Local home prices are declining (-3.0%/yr); year-one equity from $2k of loan paydown is wiped out by about $10k of value loss. Plan a longer hold.
- Los Angeles County population projected at +9% by 2050 — modest demand growth; plan on rents tracking national, not racing it.
Negotiation context
- Only 6 days on market — expect competitive offers; lowballing is unlikely to land.
- 9 sale attempts since 22y ago with the ask held roughly flat each time — persistent listings suggest the price (not the market) is what's stuck; bring a comps-based counter.
- Current owner paid $184k; list at $350k implies a 90% gain — meaningful room to come down on a strong offer.
Risks & watch-outs
- Climate carrying-cost: major wildfire risk; extreme-heat days projected 3→7/yr by 2055 (HVAC capex compounding) — expect insurance premiums to compound above CPI over the hold.
Questions for the listing agent
- Is there a deadline driving the sale (1031 exchange, divorce, estate, relocation)? That informs how much negotiation room exists.
- Schools are F-rated, which usually means shorter tenancies and higher turnover. Who's the typical renter profile here, and what's been the actual vacancy rate?
- Crime grade is F in this area — have there been break-ins, vandalism, or insurance claims at this property in the last 3 years? What carrier currently insures it and at what premium?
- The area grade is low — what's the realistic commute time and amenity access for the typical tenant pool here? Any planned neighborhood developments (good or bad) we should know about?
- What's the average days-on-market for RENTAL listings here right now (not sales)? A rising rental-DOM trend means longer vacancies and softer asking-rent achievability than the comps imply.
- What's the recent tenant-quality profile in this submarket — average credit score on applications, eviction rate, late-payment / NSF rate, and stable-employment percentage? A property-management company in the area should have these aggregated.
- How much new for-sale + rental construction is in the pipeline within 1–3 miles? Heavy new supply typically softens prices + rents 12–24 months out; constrained supply supports both.
Investment metrics
- 1% rule
- 0.87% ✗
- Cap rate
- 6.63%
- Cash-on-cash
- 1.19%
- DSCR
- 1.05
- GRM
- 9.6
CMA / ARV
- ARV (on-the-fly)
- $474,710
- Comps found
- 12
Show comp detail 12 sales within ~0.75 mi
| Address | Dist | Beds/Ba | Sqft | Sold | Price | $/sf | Match |
|---|---|---|---|---|---|---|---|
| 36918 57th E | 0.14mi | 3/2.0 | 1,113 (-13%) | 0mo | $400,000 | $359 | 71 |
| 36820 57th St E | 0.14mi | 3/2.0 | 1,189 (-7%) | 13mo | $485,000 | $408 | 71 |
| 5382 Sunburst | 0.15mi | 3/2.0 | 1,127 (-12%) | 7mo | $437,000 | $388 | 67 |
| 37334 E 55th St | 0.59mi | 4/2.0 (+1) | 1,250 (-3%) | 0mo | $435,000 | $348 | 63 |
| 36829 Burroughs Way | 0.24mi | 3/2.0 | 1,127 (-12%) | 7mo | $450,000 | $399 | 63 |
| 37213 55th St E | 0.47mi | 3/2.0 | 1,200 (-6%) | 11mo | $440,000 | $367 | 58 |
| 37222 55th St E | 0.48mi | 4/2.0 (+1) | 1,200 (-6%) | 7mo | $480,000 | $400 | 56 |
| 37230 Sabal Ave | 0.51mi | 4/2.0 (+1) | 1,198 (-7%) | 6mo | $471,000 | $393 | 56 |
| 37304 Sabal Ave | 0.55mi | 4/2.0 (+1) | 1,230 (-4%) | 8mo | $455,000 | $370 | 56 |
| 4817 Harbor Ct | 0.74mi | 4/2.0 (+1) | 1,327 (+3%) | 4mo | $420,000 | $317 | 52 |
| 5361 E R 12 Ave | 0.66mi | 4/2.0 (+1) | 1,200 (-6%) | 7mo | $430,000 | $358 | 48 |
| 4937 Sunburst | 0.65mi | 4/3.0 (+1) | 1,127 (-12%) | 2mo | $375,000 | $333 | 39 |
Match score weights: distance 35% · size 25% · config 20% · recency 20%. Top-matched comps best support the ARV.
Projected returns pro-forma
-3.0% appreciation · 3.0% rent growth · sell at horizon
- IRR
- -14.4%
- Equity multiple
- 0.48×
- Total profit
- $-50,532
- Equity at exit
- $52,186
- IRR
- -5.7%
- Equity multiple
- 0.63×
- Total profit
- $-36,112
- Equity at exit
- $30,262
Cash invested: $98,000 (down + closing). Projections, not guarantees.
Landlord ↔ Tenant lean methodology
- Overall (STATE)
- 18 Strongly Tenant-Friendly
- State California
- 18 Strongly Tenant-Friendly · D+13
- County
- — inherits STATE
- City
- — inherits STATE
ZIP-level market 93552
- Home prices YoY
- -6.4%
- Active inventory
- 129
- Price-to-rent
- 9.6×
Monthly cashflow live
- Estimated rent
- $3,038 high interval (Pro) →
- Mortgage (P&I)
- −$1,835
- Tax from tax record
- −$321 /mo · $3,852/yr
- Insurance
- −$146
- HOA
- −$0
- Vacancy / Maint / Mgmt
- −$638
- Net cashflow
- $97
Break-even live
Sensitivity live
| Price | -10% $296 | -5% $197 | +0% $97 | +5% $-2 | +10% $-101 |
|---|---|---|---|---|---|
| Rent | -10% $-142 | -5% $-23 | +0% $97 | +5% $217 | +10% $337 |
| Rate | -1.0pp $274 | -0.5pp $187 | base $97 | +0.5pp $7 | +1.0pp $-85 |
UW: 25.0% down · 7.5% · 30yr · 1.5% tax · 5.0% vac · 8.0% maint · 8.0% mgmt
Financing live
Cash to close
- Down payment
- $87,500
- Closing costs
- $10,500
- Reserves months
- —
- Total cash needed
- —
Loan-product check · same deal, 3 products live
Conventional
25% down · 7.5% · 30yr
- Down + closing
- —
- Monthly P&I
- —
- Monthly cashflow
- —
- DSCR
- —
- Eligible?
- —
Personal DTI + credit; lowest rate.
DSCR
20% down · 8.5% · 30yr
- Down + closing
- —
- Monthly P&I
- —
- Monthly cashflow
- —
- DSCR
- —
- Eligible?
- —
No personal income docs; deal must DSCR.
Hard money
10% down · 12.0% · 12mo
- Down + closing
- —
- Monthly P&I
- —
- Monthly cashflow
- —
- DSCR
- —
- Eligible?
- —
Short-term bridge; refi at stabilization.
Rent comps 12 comps
| Address | Beds | Baths | Sqft | Rent | $/sqft | DOM | Units | Dist |
|---|---|---|---|---|---|---|---|---|
| 36805 Alder St Palmdale, CA | 3.0 | 2.0 | 1189 | $2,700 | $2.27 | 21d | 1 | 0.09mi |
| 37147 Alder St Palmdale, CA | 3.0 | 2.5 | 1712 | $2,900 | $1.69 | 0d | 1 | 0.38mi |
| 37210 Sabal Ave Palmdale, CA | 3.0 | 2.0 | 1198 | $2,395 | $2.00 | 0d | 1 | 0.48mi |
| 6012 Sandpiper Pl Palmdale, CA | 4.0 | 2.0 | 1645 | $2,798 | $1.70 | 0d | 1 | 0.87mi |
| 5204 E Avenue T4 Palmdale, CA | 4.0 | 2.0 | 1586 | $3,500 | $2.21 | 0d | 1 | 1.00mi |
| 36717 Sulphur Springs Rd Palmdale, CA | 3.0 | 2.0 | 1548 | $3,100 | $2.00 | 20d | 1 | 1.01mi |
| 5327 Meredith Ave Palmdale, CA | 4.0 | 2.0 | 1600 | $3,200 | $2.00 | 0d | 1 | 1.04mi |
| 37707 57th St E Palmdale, CA | 3.0 | 2.5 | 1454 | $2,700 | $1.86 | 0d | 1 | 1.06mi |
| 37734 Tackstem St Palmdale, CA | 4.0 | 2.0 | 1488 | $2,950 | $1.98 | 0d | 1 | 1.13mi |
| 37526 Rose St Palmdale, CA | 3.0 | 2.0 | 1361 | $3,150 | $2.31 | 0d | 1 | 1.23mi |
| 37835 58th St E Palmdale, CA | 3.0 | 2.0 | 1232 | $2,800 | $2.27 | 0d | 1 | 1.26mi |
| 4636 Blue Ridge Ave Palmdale, CA | 3.0 | 2.0 | 1526 | $3,000 | $1.97 | 26d | 1 | 1.45mi |
Listing history 3 events
-
2026-06-01days on market $350,000 Active 6 DOM
-
2026-05-31remarks 470-char remark
-
2026-05-31$350,000 Active 5 DOM
ⓘ Source: listings_history table (triggers on properties + properties_extension) + one-shot
backfill from property_details.listing_events for pre-trigger history.
Tax reassessment forecast CA · Resets to sale price
- Current annual tax
- $3,852 · $321/mo
- Projected year-2 tax
- $3,852 · $321/mo
- Expected delta
- $0/yr ($0/mo · -0.0%)
ⓘ Screening estimate from a state-policy table — verify with the county assessor before closing.
Climate risk First Street
- Flood 1/10 Low FEMA zone X (unshaded) · 0% chance over 30 yrs
- Wildfire 7/10 Severe
- Heat 6/10 Major 3 d/yr ≥99°F today · 7 d/yr by 30 yrs out
- Wind 1/10 Low
- Air quality 10/10 Extreme 27 unhealthy d/yr today · 34 by 30 yrs out
Nearby sold comps map
Loading sold comps map…
Walkable amenities ~0.75 mi
Loading nearby amenities…
Taxation est. · year 1
- Rental income
- $36,453
- − Mortgage interest
- −$19,605
- − Property taxes
- −$3,852
- − Insurance
- −$1,750
- − Repairs & maintenance
- −$2,916
- − Management
- −$2,916
- − Depreciation
- −$10,182
- Taxable loss
- −$4,770
- Est. tax savings @ 24.0%
- +$1,145
- After-tax cash flow
- $2,315/yr
For passive investors: Depreciation is non-cash, so a rental often shows a tax loss while cash-flowing — sheltering income. Rental losses are passive: they offset passive income freely, and up to $25,000/yr can offset ordinary (W-2) income if you actively participate and your MAGI is under $100k (phasing out to $0 by $150k); unused losses carry forward. On sale, claimed depreciation is recaptured at up to 25%, and gains may owe capital-gains tax (a 1031 exchange can defer both). Figures are a year-1 estimate at your 24.0% rate — not tax advice; consult a CPA.
Schools (NCES district)
- District
- Palmdale Elementary
- NCES district ID
- 0629580
- Math proficiency
- 20% ▲ 1.00%
- Reading proficiency
- 31% ▲ 1.00%
- Median HH income
- $48,652
- Composite
- 25.34/100
- National rank
- #12888
- State rank
- #1147 of 1400 in CA
Livability — Palmdale
- Score
- 55/100
- State rank
- #861
- US rank
- #23501
Category grades
Schools grade is shown separately in the Schools card above.
Census & demographics
- Census place
- Palmdale, CA
- County
- Los Angeles County · 9,444,647 people
- City population
- 177,644
- Metro
- Los Angeles-Long Beach-Anaheim, CA
- Population (ZIP)
- 42,639
- Household income
- $85,954
- Rent vs Own
- Severe rent burden
- 747.0
Population outlook (Los Angeles County) Hauer SSP2
- Today (2025)
- 10,940,515 people
- By 2030
- 11,256,481 · +2.9%
- By 2040
- 11,729,929 · +7.2%
- By 2050
- 11,948,407 · +9.2%
- By 2075
- 11,818,114 · +8.0%
- By 2100
- 10,842,928 · -0.9%
Race, ethnicity, and origin ACS 2023
- Neighborhood character
- Predominantly Hispanic (72%)
- Race & ethnicity
- Hispanic / Latino 72% Two or more races 21% Black 13% White 11% Asian 2% Native American 1%
- Hispanic origin (detail)
- Mexican 55%
- Common ancestry
- Italian 1%
- Foreign-born
- 27% · Canada, Dominican Republic
- Languages at home
- 42% English-only · Spanish 55% Tagalog/Filipino 1%
Political lean MEDSL · Los Angeles
- 2024 margin
- Solid D (+32.9) · D 64.8% · R 31.9% · Other 3.3%
- 2008→2024 swing
- -7.4pp toward R · 2008: 40.4pp · 2024: 32.9pp
- All cycles
- 2024: D+32.9 2020: D+44.2 2016: D+48.0 2012: D+40.0 2008: D+40.4
Not yet ingested
- Civics
- —
Market trends
- HPI YoY
- ▼ -27.00%
- Current HPI
- 394.1607
- Rent YoY
- —
- Metro
- Los Angeles-Long Beach-Anaheim, CA
- State GDP YoY
- ▲ 3.21%
- F500 in state
- 116
Industry mix (Fortune 500 HQ in CA)
| Industry | F500 HQs | Revenue |
|---|---|---|
| Technology | 27 | $1,492B |
|
||
| Financial Services | 3 | $174B |
|
||
| Retail | 3 | $44B |
|
||
| Insurance | 3 | $26B |
|
||
| Media / Entertainment | 2 | $115B |
|
||
| Pharmaceuticals / Biotech | 2 | $62B |
|
||
Price history
+264.6% since first listed21 events — show timeline
- 2026-05-31 Relisted — CRMLS
- 2026-05-11 Listed $350,000 CRMLS
- 2019-07-05 Listing Removed — AVMLS
- 2019-07-01 Listed $279,995 AVMLS
- 2014-02-21 Sold (Public Records) $184,000 Public Records
- 2014-02-21 Sold (MLS) $184,000 AVMLS
- 2014-02-21 Sold (MLS) $184,000 CRMLS
- 2014-01-26 Pending — CRMLS
- 2013-12-17 Relisted — CRMLS
- 2013-12-11 Pending — CRMLS
- 2013-11-30 Listed $178,000 CRMLS
- 2013-10-24 Listed $184,000 AVMLS
- 2013-09-20 Sold (Public Records) $101,500 Public Records
- 2013-09-20 Sold (MLS) $101,500 AVMLS
- 2012-11-05 Listed $100,000 AVMLS
- 2008-05-20 Sold (MLS) $185,000 AVMLS
- 2007-09-16 Listed $185,000 AVMLS
- 2005-03-07 Sold (Public Records) $280,000 Public Records
- 2005-02-08 Sold (MLS) $275,000 CRMLS
- 2004-12-11 Listed $275,000 CRMLS
- 1996-09-06 Sold (Public Records) $96,000 Public Records
Property tax history
+0.2%/yrLatest (2025): $3,852 · +6.3% YoY. Source: county tax records.
Cash-flow waterfall
monthlySold comps — $/sqft
last 12 mo · ≤1 miLoading sold comps…