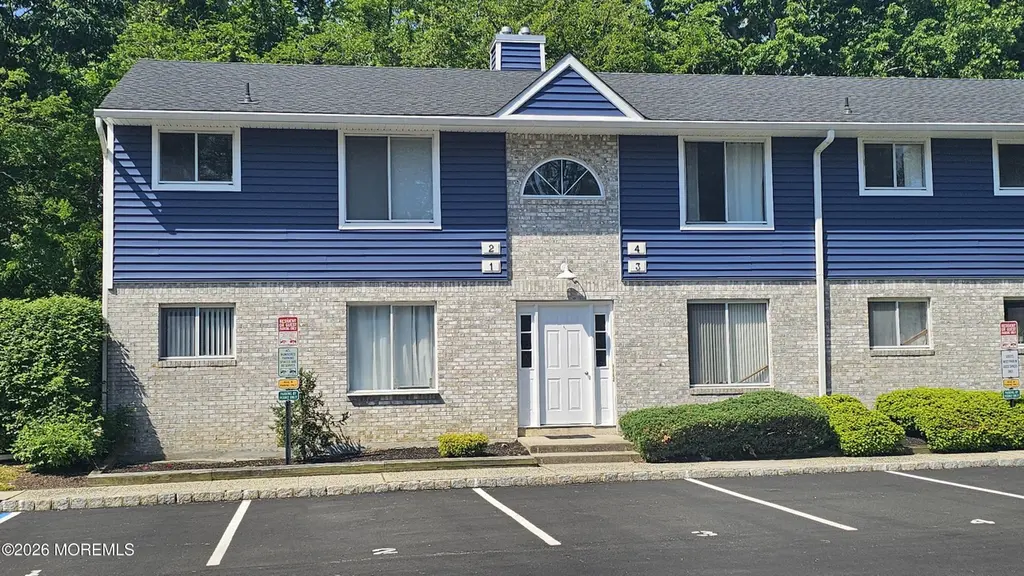
4 Spring Meadow Dr · Tinton Falls, NJ
Flood risk 1/10 · Minimal
- FEMA flood zone
- X (unshaded)
- Chance of flooding over 30 yrs
- 0.0%
- Est. flood insurance / yr
- $507 – $1,088
Fire risk 2/10 · Minimal
- Est. fire insurance / yr
- $526 – $976
Heat risk 7/10 · Major
- Hot days now (above 96°F)
- 7 days/yr
- Hot days in 30 yrs
- 15 days/yr
Wind risk 8/10 · Major
- Chance of severe wind over 30 yrs
- 80.0%
Air-quality risk 3/10 · Minor
- Unhealthy air days now
- 3 days/yr
- Unhealthy air days in 30 yrs
- 4 days/yr
Risk factors via First Street. Map © Google.
Why this score? — see what drove the B- grade
The composite is a weighted blend of 9 inputs, each scored 0–100. Each bar is that input's sub-score; the figure is the points it added to the 100-point composite (weight × sub-score).
- Cash flow +30.0/30.0
- 1% rule +10.0/10.0
- DSCR +10.0/10.0
- ARV discount +7.5/15.0
- Schools +3.7/10.0
- Livability +3.4/5.0
- Rent growth +2.5/5.0
- Condition / age +2.5/5.0
- Appreciation +0.0/10.0
$101,432
🖨 Deal sheet 📄 Offer letter ✓ Due diligence
Listing remarks MLS
Not to be missed! Centrally located affordable housing unit freshly painted for qualified homeowner. Don's miss out on this perfect opportunity!
Key facts
- $145 HOA
- Built 1988
- Listed 30 days
Property features AI
Finance
- HOA & community: HOA/association present (CME Associates); Monthly association fee of $145; Association covers common area, lawn maintenance and snow removal; Common area amenities
Exterior
- Parking: No garage spaces
- Utilities: Public sewer
- Exterior features: Shingle roof; Property is attached (townhouse/condo style)
Interior
- Kitchen: Dishwasher; Microwave; Stove; Refrigerator
- Bedrooms: 1 bedroom
- Flooring: Laminate
- Bathrooms: 1 full bathroom
- Heating & cooling: Forced air heating; Central air conditioning
- Interior features: Includes dishwasher, microwave, stove and refrigerator; Laminate flooring; No fireplaces
Neighborhood map
What this means for you Summary
Snapshot
- This is a 1-bed/1.0-bath condo listed at $101k.
Deal economics
- At list price, monthly cash flow is $737 ($9k/yr) — positive.
- The deal already cash-flows at list — no discount required.
- Meets the 1% rule at list price ($2k rent vs $101k).
- Recommended offer: $100k (1.5% below list) — sets the bar for market timing.
- Cap rate 15.0% vs local median 2.7% in Tinton Falls — top-decile yield for the area; either an underpriced asset or a hidden risk that comps aren't pricing in. Stress-test before assuming the spread holds.
Location & tenants
- Location reads 68/100 on livability (#319 in NJ) — a middle-class / working-renter tenant base. Strengths: employment A+, housing A+, crime A; Watch: amenities F, commute F, cost of living F.
- Tinton Falls School District (suburban): math 27% / reading 55% proficiency, ranked #209 of 472 in NJ (top 44%) — families likely to look elsewhere, expect single-tenant / working-renter base with shorter leases; only 13% free/reduced lunch — higher-income household profile.
- Market conditions: 124 active listings in the ZIP; solid renter incomes; 2,840 units permitted in Monmouth County in 2024 (484 in 5+ unit buildings).
Forward outlook
- Local home prices are declining (-3.0%/yr); year-one equity from $701 of loan paydown is wiped out by about $3k of value loss. Plan a longer hold.
- Monmouth County population projected at -11% by 2050 — secular population decline; favor cash flow + early exit over multi-decade hold.
- At projected returns (-3.0% appreciation + 3.0% rent growth), your $28k cash investment doubles in ~4 years — after that, you're playing with house money.
Negotiation context
- It's been on market 30 days — a 2% lower offer ($100k) is reasonable based on typical stale-listing flexibility.
- 2 sale attempts since 13y ago with the ask held roughly flat each time — persistent listings suggest the price (not the market) is what's stuck; bring a comps-based counter.
- Current owner paid $70k; 45% above their basis — modest negotiation headroom, anchor on the comps not their cost.
Risks & watch-outs
- Climate carrying-cost: severe wind risk, 80% chance of damaging wind over 30y; extreme-heat days projected 7→15/yr by 2055 (HVAC capex compounding) — expect insurance premiums to compound above CPI over the hold.
Questions for the listing agent
- What does the HOA fee cover, when was the last increase, and are there any pending special assessments or reserve-fund shortfalls?
- Any open or pending special assessments — roof, HVAC, plumbing, elevator, façade? What's the per-unit balance and payoff schedule, and is the seller paying it off at close or rolling it to the buyer?
- Is there a deadline driving the sale (1031 exchange, divorce, estate, relocation)? That informs how much negotiation room exists.
- Schools are A-rated — typically a magnet for longer-tenancy family renters. What's the average tenant stay here, and is there a school-zone premium baked into asking?
- What's the average days-on-market for RENTAL listings here right now (not sales)? A rising rental-DOM trend means longer vacancies and softer asking-rent achievability than the comps imply.
- What's the recent tenant-quality profile in this submarket — average credit score on applications, eviction rate, late-payment / NSF rate, and stable-employment percentage? A property-management company in the area should have these aggregated.
- How much new apartment / multifamily construction is in the pipeline within 1–3 miles? Heavy new supply (>2% of stock underway) typically softens rents 12–24 months out; light construction supports rent growth.
Investment metrics
- 1% rule
- 1.96% ✓
- Cap rate
- 15.01%
- Cash-on-cash
- 31.13%
- DSCR
- 2.39
- GRM
- 4.2
CMA / ARV
No comps found within radius.
Projected returns pro-forma
-3.0% appreciation · 3.0% rent growth · sell at horizon
- IRR
- 26.0%
- Equity multiple
- 2.08×
- Total profit
- $30,600
- Equity at exit
- $15,124
- IRR
- 33.7%
- Equity multiple
- 4.08×
- Total profit
- $87,527
- Equity at exit
- $8,770
Cash invested: $28,401 (down + closing). Projections, not guarantees.
Landlord ↔ Tenant lean methodology
- Overall (STATE)
- 21 Tenant-Leaning
- State New Jersey
- 21 Tenant-Leaning · D+6
- County
- — inherits STATE
- City
- — inherits STATE
ZIP-level market 07724
- Active inventory
- 124
- Price-to-rent
- 4.2×
Monthly cashflow live
- Estimated rent
- $1,992 medium interval (Pro) →
- Mortgage (P&I)
- −$532
- Tax from tax record
- −$118 /mo · $1,413/yr
- Insurance
- −$42
- HOA
- −$145
- Vacancy / Maint / Mgmt
- −$418
- Net cashflow
- $737
Break-even live
UW: 25.0% down · 7.5% · 30yr · 1.5% tax · 5.0% vac · 8.0% maint · 8.0% mgmt
Financing live
Cash to close
- Down payment
- $25,358
- Closing costs
- $3,043
- Reserves months
- —
- Total cash needed
- —
Loan-product check · same deal, 3 products live
Conventional
25% down · 7.5% · 30yr
- Down + closing
- —
- Monthly P&I
- —
- Monthly cashflow
- —
- DSCR
- —
- Eligible?
- —
Personal DTI + credit; lowest rate.
DSCR
20% down · 8.5% · 30yr
- Down + closing
- —
- Monthly P&I
- —
- Monthly cashflow
- —
- DSCR
- —
- Eligible?
- —
No personal income docs; deal must DSCR.
Hard money
10% down · 12.0% · 12mo
- Down + closing
- —
- Monthly P&I
- —
- Monthly cashflow
- —
- DSCR
- —
- Eligible?
- —
Short-term bridge; refi at stabilization.
HOA detail condo
- Monthly dues
- $145 · $1,740/yr
- Assessments
- None detected in remarks — confirm with the listing agent.
Listing history 20 events
-
2026-06-18status $101,432 Pending 30 DOM
-
2026-06-18days on market $101,432 Active 30 DOM
-
2026-06-17days on market $101,432 Active 29 DOM
-
2026-06-16days on market $101,432 Active 28 DOM
-
2026-06-15days on market $101,432 Active 27 DOM
-
2026-06-13days on market $101,432 Active 25 DOM
-
2026-06-13days on market $101,432 Active 24 DOM
-
2026-06-09days on market $101,432 Active 21 DOM
-
2026-06-08days on market $101,432 Active 20 DOM
-
2026-06-07days on market $101,432 Active 19 DOM
-
2026-06-04days on market $101,432 Active 16 DOM
-
2026-06-03days on market $101,432 Active 15 DOM
-
2026-06-02days on market $101,432 Active 14 DOM
-
2026-06-01days on market $101,432 Active 13 DOM
-
2026-05-31days on market $101,432 Active 12 DOM
-
2026-05-19$101,432 Active
-
2015-10-05soldstatus $70,000
-
2013-11-27soldstatus $70,000 144-char remark
Show marketing remark (144 chars)
Not to be missed! Centrally located affordable housing unit freshly painted for qualified homeowner. Don's miss out on this perfect opportunity!
-
2013-07-01$70,000 144-char remark
Show marketing remark (144 chars)
Not to be missed! Centrally located affordable housing unit freshly painted for qualified homeowner. Don's miss out on this perfect opportunity!
-
1992-07-09soldstatus $50,500
ⓘ Source: listings_history table (triggers on properties + properties_extension) + one-shot
backfill from property_details.listing_events for pre-trigger history.
Tax reassessment forecast NJ · Partial reset (capped growth)
- Current annual tax
- $1,413 · $118/mo
- Projected year-2 tax
- $1,969 · $164/mo
- Expected delta
- +$556/yr (+$46/mo · 39.4%)
ⓘ Screening estimate from a state-policy table — verify with the county assessor before closing.
Climate risk First Street
- Flood 1/10 Low FEMA zone X (unshaded) · 0% chance over 30 yrs
- Wildfire 2/10 Low
- Heat 7/10 Severe 7 d/yr ≥96°F today · 15 d/yr by 30 yrs out
- Wind 8/10 Severe 80% chance of damaging wind over 30 yrs
- Air quality 3/10 Moderate 3 unhealthy d/yr today · 4 by 30 yrs out
Nearby sold comps map
Loading sold comps map…
Walkable amenities ~0.75 mi
Loading nearby amenities…
Taxation est. · year 1
- Rental income
- $23,904
- − Mortgage interest
- −$5,682
- − Property taxes
- −$1,413
- − Insurance
- −$507
- − Repairs & maintenance
- −$1,912
- − Management
- −$1,912
- − HOA
- −$1,740
- − Depreciation
- −$2,951
- Taxable income
- $7,786
- Est. tax owed @ 24.0%
- −$1,869
- After-tax cash flow
- $6,972/yr
For passive investors: Depreciation is non-cash, so a rental often shows a tax loss while cash-flowing — sheltering income. Rental losses are passive: they offset passive income freely, and up to $25,000/yr can offset ordinary (W-2) income if you actively participate and your MAGI is under $100k (phasing out to $0 by $150k); unused losses carry forward. On sale, claimed depreciation is recaptured at up to 25%, and gains may owe capital-gains tax (a 1031 exchange can defer both). Figures are a year-1 estimate at your 24.0% rate — not tax advice; consult a CPA.
Schools (NCES district)
- District
- Tinton Falls School District
- NCES district ID
- 3416200
- Math proficiency
- 27% ▼ -30.00%
- Reading proficiency
- 55% ▼ -13.00%
- Median HH income
- $73,461
- Composite
- 37.45/100
- National rank
- #4411
- State rank
- #209 of 472 in NJ
Livability — Tinton Falls
- Score
- 68/100
- State rank
- #319
- US rank
- #9845
Category grades
Schools grade is shown separately in the Schools card above.
Census & demographics
- Census place
- Tinton Falls, NJ
- County
- Monmouth County · 505,557 people
- Metro
- New York-Newark-Jersey City, NY-NJ-PA
- Population (ZIP)
- 24,016
- Household income
- $102,756
- Rent vs Own
- Severe rent burden
- 747.0
Population outlook (Monmouth County) Hauer SSP2
- Today (2025)
- 620,308 people
- By 2030
- 612,309 · -1.3%
- By 2040
- 587,297 · -5.3%
- By 2050
- 551,342 · -11.1%
- By 2075
- 472,934 · -23.8%
- By 2100
- 381,534 · -38.5%
Race, ethnicity, and origin ACS 2023
- Neighborhood character
- Diverse neighborhood (Simpson 0.56)
- Race & ethnicity
- White 64% Hispanic / Latino 13% Two or more races 11% Asian 10% Black 8%
- Hispanic origin (detail)
- Mexican 3% Puerto Rican 3% Dominican 1%
- Common ancestry
- Romanian 5% Lithuanian 2% Russian 2%
- Foreign-born
- 20% · Canada, Vietnam, South Korea
- Languages at home
- 77% English-only · Spanish 8% Other Indo-European 5% Vietnamese 2%
Political lean MEDSL · Monmouth
- 2024 margin
- R (+11.4) · D 43.4% · R 54.8% · Other 1.8%
- 2008→2024 swing
- -7.7pp toward R · 2008: -3.7pp · 2024: -11.4pp
- All cycles
- 2024: R+11.4 2020: R+2.8 2016: R+9.5 2012: R+5.5 2008: R+3.7
Not yet ingested
- Civics
- —
Market trends
- HPI YoY
- ▼ -291.64%
- Current HPI
- 330.7934
- Rent YoY
- —
- Metro
- New York-Newark-Jersey City, NY-NJ-PA
- State GDP YoY
- ▲ 2.05%
- F500 in state
- 34
Industry mix (Fortune 500 HQ in NJ)
| Industry | F500 HQs | Revenue |
|---|---|---|
| Consumer Goods | 3 | $31B |
|
||
| Pharmaceuticals | 2 | $153B |
|
||
| Technology | 2 | $21B |
|
||
| Insurance | 2 | $20B |
|
||
| Healthcare | 2 | $19B |
|
||
| Financial Services | 1 | $70B |
|
||
Price history
+100.9% since first listed5 events — show timeline
- 2026-05-19 Listed $101,432 MOMLS
- 2015-10-05 Sold (Public Records) $70,000 Public Records
- 2013-11-27 Sold (MLS) $70,000 MOMLS
- 2013-07-01 Listed $70,000 MOMLS
- 1992-07-09 Sold (Public Records) $50,500 Public Records
Property tax history
-1.0%/yrLatest (2025): $1,413 · -0.8% YoY. Source: county tax records.
Cash-flow waterfall
monthlySold comps — $/sqft
last 12 mo · ≤1 miLoading sold comps…