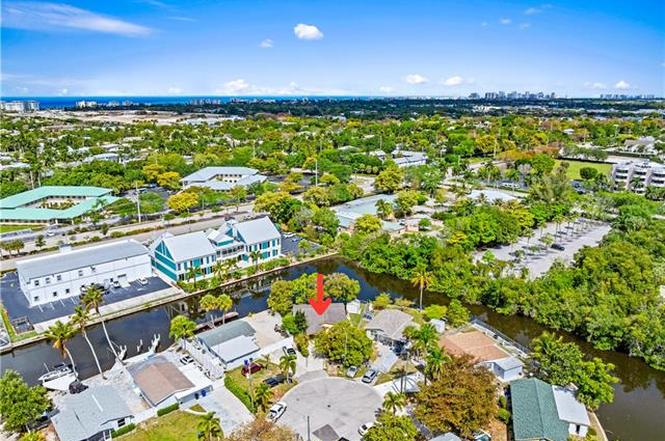
579 13th St N · Naples, FL
Flood risk 9/10 · Severe
- FEMA flood zone
- AE
- Chance of flooding over 30 yrs
- 0.99%
- Est. flood insurance / yr
- $1,737 – $8,500
Fire risk 1/10 · Minimal
- Est. fire insurance / yr
- $947 – $1,759
Heat risk 10/10 · Severe
- Hot days now (above 107°F)
- 7 days/yr
- Hot days in 30 yrs
- 27 days/yr
Wind risk 10/10 · Severe
- Chance of severe wind over 30 yrs
- 99.0%
Air-quality risk 2/10 · Minimal
- Unhealthy air days now
- 2 days/yr
- Unhealthy air days in 30 yrs
- 2 days/yr
Risk factors via First Street. Map © Google.
Why this score? — see what drove the B- grade
The composite is a weighted blend of 9 inputs, each scored 0–100. Each bar is that input's sub-score; the figure is the points it added to the 100-point composite (weight × sub-score).
- Cash flow +24.8/30.0
- DSCR +8.0/10.0
- ARV discount +7.5/15.0
- Appreciation +7.0/10.0
- 1% rule +6.4/10.0
- Schools +5.0/10.0
- Rent growth +4.7/5.0
- Livability +4.0/5.0
- Condition / age +2.5/5.0
$589,000
🖨 Deal sheet (PDF) 📄 Offer letter ✓ Due diligence
Listing remarks
PRICE TO SELL — RARE GULF ACCESS UNDER $600K IN NAPLES 34102! Bring your boat, kayak, or paddleboard and start living the Southwest Florida waterfront lifestyle today. This updated 3-bedroom, 2-bath Gulf access home sits on an oversized cul-de-sac lot just minutes from Downtown Naples, 5th Avenue South, and world-famous Gulf beaches. Inside, an open-concept floor plan connects the living, dining, and kitchen areas — bright, airy, and built for easy Florida living. Major updates already done for you: HURRICANE IMPACT WINDOWS, new laminate flooring, and refreshed bathrooms. Move-in ready as a primary residence, seasonal escape, or high-demand rental investment. The backyard is the
Key facts
- Functional kitchen
- Gulf access
- Oversized backyard
Tags
Property features AI
Finance
- Other: Deeded restrictions; Located in the River Park development
- HOA & community: Non-gated community; No HOA maintenance or amenities
Exterior
- Parking: Attached carport (1 space)
- Security: Impact resistant windows
- Utilities: Central water; Central sewer; Cable available
- Home design: Single family residence; 1 story / ranch; Rear exposure northwest
- Construction: Concrete block construction; Stucco exterior; Shingle roof; Built in 1985
- Exterior features: Fruit trees; Canal view; Gulf access; Canal width 31–80 ft
Interior
- Kitchen: Cooktop (electric); Microwave; Refrigerator/ice maker
- Bedrooms: 3 bedrooms
- Flooring: Laminate; Tile
- Bathrooms: 2 full bathrooms; Master bath with shower only
- Heating & cooling: Central electric heat; Central electric cooling; Ceiling fans
- Interior features: Cable prewire; Open porch/lanai; Great room floor plan; Dining area combined with living
- Laundry & utility: Washer and dryer; Laundry in residence
Neighborhood map
What this means for you Summary
Snapshot
- This is a 3-bed/2.0-bath single-family listed at $589k.
Deal economics
- At list price, monthly cash flow is $812 ($10k/yr) — positive.
- The deal already cash-flows at list — no discount required.
- Meets the 1% rule at list price ($7k rent vs $589k).
- Recommended offer: $518k (12.0% below list) — sets the bar for market timing.
Location & tenants
- Location reads 80/100 on livability (#126 in FL, #1,903 nationally) — a professional / high-income tenant draw. Strengths: crime A+, amenities A+, employment A+; Watch: commute D+, cost of living F.
- Market conditions: Rents rising fast (+8.8%/yr); 616 active listings in the ZIP; 40 comparable units currently listed for rent nearby; rentals at typical pace (median 25d on market — plan ~3-4 weeks tenant-placement turnaround); high-income renter base; 3,520 units permitted in Collier County in 2024 (959 in 5+ unit buildings).
- At $6,721/mo this rent would consume 62% of the median local household income ($131k/yr) (locally 333% of renters already pay >50% of income on rent) — very limited rent-growth headroom before tenants either downsize or default.
Forward outlook
- In year one you build about $28k of equity ($4k loan paydown + $24k appreciation (4.1% local appreciation)).
- Collier County population projected at +30% by 2050 — long-run rental-demand tailwind backs the buy-and-hold thesis.
- At projected returns (4.1% appreciation + 8.0% rent growth), your $165k cash investment doubles in ~4 years — after that, you're playing with house money.
- By year 2, paydown + projected appreciation supports a ~$45k cash-out refi (75% LTV) — recoverable capital for the next deal without selling this one.
Negotiation context
- It's been on market 133 days — a 12% lower offer ($518k) is reasonable based on typical stale-listing flexibility.
Risks & watch-outs
- Watch-outs: flood insurance adds $427/mo.
- Climate carrying-cost: in FEMA flood zone AE (mandatory federal flood insurance); severe wind risk, 99% chance of damaging wind over 30y; extreme-heat days projected 7→27/yr by 2055 (HVAC capex compounding) — expect insurance premiums to compound above CPI over the hold.
Questions for the listing agent
- It's been on market 133 days. Have you received any prior offers? Is the seller open to a 12% concession, seller financing, or rate buy-down credit?
- What's the actual annual flood-insurance premium (NFIP or private), and is the property in a SFHA with mandatory coverage?
- Why hasn't it sold? Are there any deal-killer items the seller is aware of (foundation, flood, title, zoning, code violations)?
- Is there a deadline driving the sale (1031 exchange, divorce, estate, relocation)? That informs how much negotiation room exists.
- Schools are B-rated — typically a magnet for longer-tenancy family renters. What's the average tenant stay here, and is there a school-zone premium baked into asking?
- What's the average days-on-market for RENTAL listings here right now (not sales)? A rising rental-DOM trend means longer vacancies and softer asking-rent achievability than the comps imply.
- What's the recent tenant-quality profile in this submarket — average credit score on applications, eviction rate, late-payment / NSF rate, and stable-employment percentage? A property-management company in the area should have these aggregated.
- How much new for-sale + rental construction is in the pipeline within 1–3 miles? Heavy new supply typically softens prices + rents 12–24 months out; constrained supply supports both.
Investment metrics
- 1% rule
- 1.14% ✓
- Cap rate
- 8.82%
- Cash-on-cash
- 9.01%
- DSCR
- 1.40
- GRM
- 7.3
CMA / ARV
No comps found within radius.
Projected returns pro-forma
4.08% appreciation · 8.0% rent growth · sell at horizon
- IRR
- 18.8%
- Equity multiple
- 2.17×
- Total profit
- $193,045
- Equity at exit
- $301,511
- IRR
- 21.9%
- Equity multiple
- 4.89×
- Total profit
- $640,802
- Equity at exit
- $495,456
Cash invested: $164,920 (down + closing). Projections, not guarantees.
Landlord ↔ Tenant lean methodology
- Overall (STATE)
- 87 Strongly Landlord-Friendly
- State Florida
- 87 Strongly Landlord-Friendly · R+3
- County
- — inherits STATE
- City
- — inherits STATE
ZIP-level market 34102
- Home prices YoY
- 1.3%
- Rents YoY
- 8.8%
- Active inventory
- 616
- Price-to-rent
- 7.3×
Monthly cashflow live
- Estimated rent
- $6,721 medium interval (Pro) →
- Mortgage (P&I)
- −$3,089
- Tax est. 1.5%
- −$736 /mo · $8,835/yr
- Insurance
- −$245
- Flood insurance flood zone
- −$427 /mo · $5,118/yr
- HOA
- −$0
- Vacancy / Maint / Mgmt
- −$1,411
- Net cashflow
- $812
Break-even live
Sensitivity live
| Price | -10% $1,219 | -5% $1,016 | +0% $812 | +5% $609 | +10% $405 |
|---|---|---|---|---|---|
| Rent | -10% $281 | -5% $547 | +0% $812 | +5% $1,078 | +10% $1,343 |
| Rate | -1.0pp $1,109 | -0.5pp $962 | base $812 | +0.5pp $660 | +1.0pp $504 |
UW: 25.0% down · 7.5% · 30yr · 1.5% tax · 5.0% vac · 8.0% maint · 8.0% mgmt
Financing live
Cash to close
- Down payment
- $147,250
- Closing costs
- $17,670
- Reserves months
- —
- Total cash needed
- —
Loan-product check · same deal, 3 products live
Conventional
25% down · 7.5% · 30yr
- Down + closing
- —
- Monthly P&I
- —
- Monthly cashflow
- —
- DSCR
- —
- Eligible?
- —
Personal DTI + credit; lowest rate.
DSCR
20% down · 8.5% · 30yr
- Down + closing
- —
- Monthly P&I
- —
- Monthly cashflow
- —
- DSCR
- —
- Eligible?
- —
No personal income docs; deal must DSCR.
Hard money
10% down · 12.0% · 12mo
- Down + closing
- —
- Monthly P&I
- —
- Monthly cashflow
- —
- DSCR
- —
- Eligible?
- —
Short-term bridge; refi at stabilization.
Rent comps 40 comps
| Address | Beds | Baths | Sqft | Rent | $/sqft | DOM | Units | Dist |
|---|---|---|---|---|---|---|---|---|
| 714 11th St N Naples, FL | 3.0 | 2.0 | 1183 | $9,500 | $8.03 | 24d | 1 | 0.27mi |
| 982 13th St N Naples, FL | 3.0 | 2.5 | 1204 | $8,000 | $6.64 | 24d | 1 | 0.33mi |
| 905 13th St N Naples, FL | 3.0 | 2.0 | 1292 | $8,000 | $6.19 | 24d | 1 | 0.34mi |
| 981 8th Ter N Naples, FL | 3.0 | 2.0 | 1200 | $8,500 | $7.08 | 24d | 1 | 0.37mi |
| 1111 Central Ave Unit 417S Naples, FL | 2.0 | 2.0 | 1265 | $10,000 | $7.91 | 24d | 1 | 0.55mi |
| 1111 Central Ave Unit 417A Naples, FL | 2.0 | 2.0 | 1265 | $6,500 | $5.14 | 24d | 1 | 0.55mi |
| 1236 13th Ave N Naples, FL | 3.0 | 2.0 | 1461 | $14,500 | $9.92 | 24d | 1 | 0.56mi |
| 1115 Central Ave Naples, FL | 2.0 | 2.5 | 1735 | $14,000 | $8.07 | 24d | 3 | 0.59mi |
| 1111 Central Ave Naples, FL | 2.0–3.0 | 2.0–3.5 | 1627 | $17,000 | $10.45 | 24d | 4 | 0.59mi |
| 850 Central Ave Naples, FL | 2.0–3.0 | 2.0–3.0 | 1530 | $18,000 | $11.76 | 15d | 4 | 0.73mi |
| 1135 3rd Ave S Naples, FL | 2.0 | 2.0–2.5 | 1638 | $15,750 | $9.62 | 24d | 2 | 0.77mi |
| 1135 3rd Ave S Naples, FL | 2.0 | 2.0–2.5 | 1679 | $11,500 | $6.85 | 22d | 3 | 0.77mi |
| 766 Central Ave Naples, FL | 2.0–3.0 | 2.0 | 943 | $6,500 | $6.89 | 14d | 4 | 0.79mi |
| 766 Central Ave Naples, FL | 2.0–3.0 | 2.0 | 855 | $6,500 | $7.60 | 22d | 3 | 0.79mi |
| 401 Bayfront Pl Naples, FL | 2.0 | 2.0 | 1367 | $9,000 | $6.58 | 24d | 3 | 0.81mi |
| 1035 3rd Ave S Naples, FL | 2.0 | 2.0 | 1268 | $8,538 | $6.73 | 24d | 2 | 0.81mi |
| 1035 3rd Ave S Naples, FL | 2.0 | 2.0 | 1268 | $8,388 | $6.61 | 22d | 2 | 0.81mi |
| 307 Goodlette-Frank Rd S Unit B506 Naples, FL | 2.0 | 2.0 | 1166 | $6,800 | $5.83 | 24d | 1 | 0.82mi |
| 410 Bayfront Pl Naples, FL | 1.0–3.0 | 1.0–2.0 | 1242 | $9,750 | $7.85 | 24d | 6 | 0.83mi |
| 469 3rd Ave N Naples, FL | 3.0 | 2.0 | 1400 | $6,900 | $4.93 | 24d | 1 | 0.86mi |
| 450 Bayfront Pl Naples, FL | 1.0–3.0 | 1.0–2.5 | 1324 | $12,000 | $9.06 | 24d | 6 | 0.86mi |
| 451 Bayfront Pl Naples, FL | 1.0–2.0 | 1.5–2.0 | 1421 | $11,000 | $7.74 | 24d | 2 | 0.86mi |
| 1030 3rd Ave S Naples, FL | 2.0–3.0 | 2.0–3.5 | 2101 | $18,000 | $8.57 | 24d | 4 | 0.88mi |
| 361 1st Ave N Naples, FL | 3.0 | 3.0 | 1500 | $16,000 | $10.67 | 24d | 1 | 1.00mi |
| 116 3rd St N Naples, FL | 3.0 | 2.5 | 1400 | $14,000 | $10.00 | 24d | 1 | 1.03mi |
| 1334 Crayton Rd #1 Naples, FL | 2.0 | 2.0 | 1100 | $6,800 | $6.18 | 24d | 1 | 1.09mi |
| 780 5th Ave S #302 Naples, FL | 2.0 | 2.5 | 1449 | $15,000 | $10.35 | 15d | 1 | 1.09mi |
| 2328 Clipper Way Naples, FL | 2.0 | 2.0 | 1469 | $10,000 | $6.81 | 24d | 1 | 1.11mi |
| 290 4th St S #202 Naples, FL | 2.0 | 2.0 | 1058 | $10,000 | $9.45 | 24d | 1 | 1.15mi |
| 286 4th St S #203 Naples, FL | 2.0 | 2.0 | 1058 | $10,000 | $9.45 | 24d | 1 | 1.15mi |
| 284 4th St S #103 Naples, FL | 2.0 | 2.0 | 979 | $9,000 | $9.19 | 24d | 1 | 1.15mi |
| 282 4th St S Naples, FL | 2.0 | 2.0 | 1058 | $11,000 | $10.40 | 24d | 1 | 1.15mi |
| 1100 8th Ave S Naples, FL | 2.0 | 2.0 | 1218 | $9,000 | $7.39 | 15d | 5 | 1.16mi |
| 1100 Gulf Shore Blvd N Naples, FL | 2.0 | 2.0 | 945 | $6,000 | $6.35 | 24d | 2 | 1.16mi |
| 341 3rd Ave S #341 Naples, FL | 2.0 | 2.0 | 1300 | $7,500 | $5.77 | 24d | 1 | 1.18mi |
| 280 2nd Ave S #206 Naples, FL | 2.0 | 2.0 | 1162 | $7,500 | $6.45 | 22d | 1 | 1.21mi |
| 1300 Gulf Shore Blvd N #406 Naples, FL | 2.0 | 2.0 | 850 | $6,500 | $7.65 | 24d | 1 | 1.21mi |
| 1300 Gulf Shore Blvd N #700 Naples, FL | 2.0 | 2.0 | 850 | $6,250 | $7.35 | 24d | 1 | 1.21mi |
| 1300 Gulf Shore Blvd N #205 Naples, FL | 2.0 | 2.0 | 850 | $5,900 | $6.94 | 24d | 1 | 1.21mi |
| 1300 Gulf Shore Blvd N #304 Naples, FL | 2.0 | 2.0 | 850 | $5,500 | $6.47 | 24d | 1 | 1.21mi |
Listing history 18 events
-
2026-06-21days on market $589,000 Active 133 DOM
-
2026-06-18days on market $589,000 Active 130 DOM
-
2026-06-17days on market $589,000 Active 129 DOM
-
2026-06-16days on market $589,000 Active 128 DOM
-
2026-06-15days on market $589,000 Active 127 DOM
-
2026-06-14days on market $589,000 Active 125 DOM
-
2026-06-10days on market $589,000 Active 122 DOM
-
2026-06-09days on market $589,000 Active 121 DOM
-
2026-06-08days on market $589,000 Active 120 DOM
-
2026-06-07days on market $589,000 Active 119 DOM
-
2026-06-03days on market $589,000 Active 115 DOM
-
2026-06-02days on market $589,000 Active 114 DOM
-
2026-06-01days on market $589,000 Active 113 DOM
-
2026-05-31days on market $589,000 Active 112 DOM
-
2026-05-30days on market $589,000 Active 111 DOM
-
2026-05-08price $589,000
-
2026-03-17price $599,000
-
2026-02-09$599,900 Active
ⓘ Source: listings_history table (triggers on properties + properties_extension) + one-shot
backfill from property_details.listing_events for pre-trigger history.
Climate risk First Street
- Flood 9/10 Extreme FEMA zone AE · 99% chance over 30 yrs
- Wildfire 1/10 Low
- Heat 10/10 Extreme 7 d/yr ≥107°F today · 27 d/yr by 30 yrs out
- Wind 10/10 Extreme 99% chance of damaging wind over 30 yrs
- Air quality 2/10 Low 2 unhealthy d/yr today · 2 by 30 yrs out
Nearby sold comps map
Loading sold comps map…
Walkable amenities ~0.75 mi
Loading nearby amenities…
Taxation est. · year 1
- Rental income
- $80,649
- − Mortgage interest
- −$32,993
- − Property taxes
- −$8,835
- − Insurance
- −$8,064
- − Repairs & maintenance
- −$6,452
- − Management
- −$6,452
- − Depreciation
- −$17,135
- Taxable income
- $719
- Est. tax owed @ 24.0%
- −$172
- After-tax cash flow
- $9,576/yr
For passive investors: Depreciation is non-cash, so a rental often shows a tax loss while cash-flowing — sheltering income. Rental losses are passive: they offset passive income freely, and up to $25,000/yr can offset ordinary (W-2) income if you actively participate and your MAGI is under $100k (phasing out to $0 by $150k); unused losses carry forward. On sale, claimed depreciation is recaptured at up to 25%, and gains may owe capital-gains tax (a 1031 exchange can defer both). Figures are a year-1 estimate at your 24.0% rate — not tax advice; consult a CPA.
Schools (NCES district)
No district data.
Livability — Naples
- Score
- 80/100
- State rank
- #126
- US rank
- #1903
Category grades
Schools grade is shown separately in the Schools card above.
Census & demographics
- Census place
- Naples, FL
- County
- Collier County · 396,295 people
- City population
- 344,941
- Metro
- Naples-Marco Island, FL
- Population (ZIP)
- 11,179
- Household income
- $130,929
- Rent vs Own
- Severe rent burden
- 333.0
Population outlook (Collier County) Hauer SSP2
- Today (2025)
- 420,858 people
- By 2030
- 450,054 · +6.9%
- By 2040
- 502,232 · +19.3%
- By 2050
- 544,932 · +29.5%
- By 2075
- 627,203 · +49.0%
- By 2100
- 659,015 · +56.6%
Race, ethnicity, and origin ACS 2023
- Neighborhood character
- Predominantly White (79%)
- Race & ethnicity
- White 79% Hispanic / Latino 9% Two or more races 8% Black 8% Asian 1%
- Hispanic origin (detail)
- Cuban 6%
- Common ancestry
- Hispanic 4% Lithuanian 4% Romanian 4%
- Foreign-born
- 17% · Canada, China
- Languages at home
- 87% English-only · Spanish 7% French/Haitian/Cajun 4% German/W. Germanic 1%
Political lean MEDSL · Collier
- 2024 margin
- Solid R (+33.1) · D 33.1% · R 66.2%
- 2008→2024 swing
- -10.6pp toward R · 2008: -22.5pp · 2024: -33.1pp
- All cycles
- 2024: R+33.1 2020: R+24.7 2016: R+26.0 2012: R+30.1 2008: R+22.5
Not yet ingested
- Civics
- —
Market trends
- HPI YoY
- ▲ 4.08%
- Current HPI
- 328.2755
- Rent YoY
- ▲ 8.75%
- Metro
- Naples-Marco Island, FL
- State GDP YoY
- ▲ 3.28%
- F500 in state
- 36
Industry mix (Fortune 500 HQ in FL)
| Industry | F500 HQs | Revenue |
|---|---|---|
| Industrial Technology | 2 | $29B |
|
||
| Insurance | 2 | $17B |
|
||
| Retail | 1 | $60B |
|
||
| Technology Distribution | 1 | $58B |
|
||
| Homebuilding | 1 | $35B |
|
||
| Technology Manufacturing | 1 | $35B |
|
||
Price history
-1.8% since first listed3 events — show timeline
- 2026-05-08 Price Changed $589,000 NAPLESMLS
- 2026-03-17 Price Changed $599,000 NAPLESMLS
- 2026-02-09 Listed $599,900 NAPLESMLS
Property tax history
-2.5%/yrLatest (2025): $150 · +7.8% YoY. Source: county tax records.
Cash-flow waterfall
monthlySold comps — $/sqft
last 12 mo · ≤1 miLoading sold comps…