18628 Morris Ave · Homewood, IL
Flood risk 1/10 · Minimal
- FEMA flood zone
- X (unshaded)
- Chance of flooding over 30 yrs
- 0.0%
- Est. flood insurance / yr
- $507 – $1,088
Fire risk 1/10 · Minimal
- Est. fire insurance / yr
- $804 – $1,492
Heat risk 3/10 · Minor
- Hot days now (above 101°F)
- 7 days/yr
- Hot days in 30 yrs
- 15 days/yr
Wind risk 2/10 · Minimal
- Chance of severe wind over 30 yrs
- —
Air-quality risk 3/10 · Minor
- Unhealthy air days now
- 4 days/yr
- Unhealthy air days in 30 yrs
- 4 days/yr
Risk factors via First Street. Map © Google.
Why this score? — see what drove the C+ grade
The composite is a weighted blend of 9 inputs, each scored 0–100. Each bar is that input's sub-score; the figure is the points it added to the 100-point composite (weight × sub-score).
- Cash flow +20.8/30.0
- ARV discount +15.0/15.0
- 1% rule +7.4/10.0
- DSCR +6.6/10.0
- Livability +4.0/5.0
- Rent growth +2.5/5.0
- Condition / age +2.5/5.0
- Schools +2.4/10.0
- Appreciation +0.0/10.0
$210,000
🖨 Deal sheet 📄 Offer letter ✓ Due diligence
Listing remarks
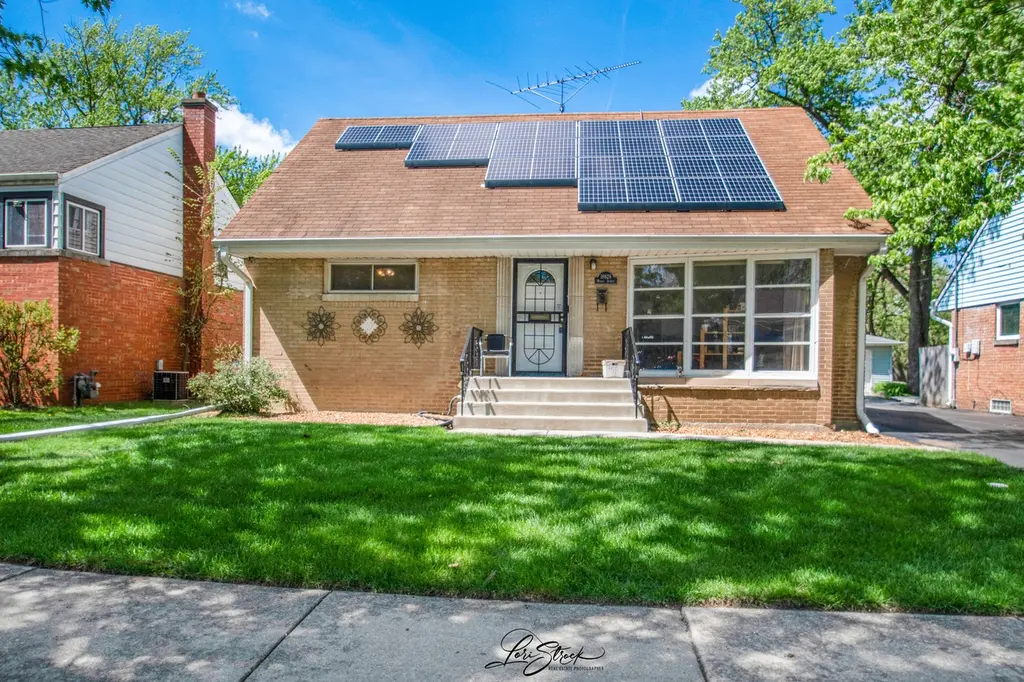
Step into the charm of this adorable Cape Cod nestled in the heart of Homewood. With two cozy bedrooms on the main level and two more larger ones on second level, this home offers a warm and inviting layout perfect for growing into or spreading out. Enjoy quiet mornings or breezy evenings on the lovely enclosed porch just off the main level. Home has a full unfinished basement, great for storage and making it entirely your own. Nice size living room, family room, dining room and eat in kitchen room. This home is full of character and potential, just waiting for the right touch . It does a bit of TLC, but with your ideas and creativity it will truly shine. Solar panels do give savings on ene
Key facts
- Enclosed porch
- Solar panels
- 6125 acre lot
Tags
Property features AI
Finance
- Other: Property not currently leased; Not rebuilt or recently rehabbed
- HOA & community: No master association fee required
Exterior
- Parking: Detached garage (owned) with 2 garage spaces; 2 total parking spaces
- Utilities: Public water; Public sewer
- Home design: Detached single-family home; 1.5-story design; Fee simple ownership; Built before 1978 (age ~71–80 years)
- Construction: Brick construction
- Exterior features: Lot approximately 49 x 125; Less than 0.25-acre lot
Interior
- Kitchen: Range; Microwave; Refrigerator
- Bedrooms: 4 bedrooms (Master Bedroom on main level; two bedrooms on second level; additional bedrooms on main level)
- Flooring: Carpet in multiple rooms (living areas and some bedrooms); Vinyl flooring in kitchen, eating area, and one upstairs bedroom
- Bathrooms: 2 full bathrooms
- Heating & cooling: Forced air heating; Natural gas heating; Solar heating; Central air conditioning
- Interior features: First-floor bedroom; First-floor full bathroom; Unfinished full basement; 9 total rooms
- Laundry & utility: In-unit laundry (washer and dryer); Laundry room in basement
Neighborhood map
What this means for you Summary
Snapshot
- This is a 4-bed/2.0-bath single-family listed at $210k.
Deal economics
- At list price, monthly cash flow is $287 ($3k/yr) — positive.
- The deal already cash-flows at list — no discount required.
- Meets the 1% rule at list price ($3k rent vs $210k).
- Cap rate 7.9% vs local median 6.1% in Homewood — meaningfully above typical; check what's discounted (condition, days-on-market, listing class) to confirm the premium yield is real.
Location & tenants
- Location reads 81/100 on livability (#81 in IL, #1,314 nationally) — a professional / high-income tenant draw. Strengths: commute A+, employment A+, cost of living A+; Watch: amenities F.
- Homewood Flossmoor Chsd 233 (suburban): math 21% / reading 27% proficiency, ranked #272 of 620 in IL (top 44%) — low school quality limits family demand, transient renter base, plan for 1-2y turnover.
- Zoned schools: Homewood-Flossmoor High School (math 21% / reading 27%, grade F, #304 of 693 statewide, top 44%, 2,798 students, 0% FRL).
- Market conditions: 101 active listings in the ZIP; 8 comparable units currently listed for rent nearby; rentals at typical pace (median 23d on market — plan ~3-4 weeks tenant-placement turnaround); 6,272 units permitted in Cook County in 2024 (4,658 in 5+ unit buildings).
Forward outlook
- Local home prices are declining (-3.0%/yr); year-one equity from $1k of loan paydown is wiped out by about $6k of value loss. Plan a longer hold.
Negotiation context
- Only 5 days on market — expect competitive offers; lowballing is unlikely to land.
- Current owner paid $59k; list at $210k implies a 256% gain — meaningful room to come down on a strong offer.
Risks & watch-outs
- Watch-outs: property tax is 3.4% of price; built in 1951 — expect roof / HVAC / electrical / plumbing capex.
Questions for the listing agent
- Built in 1951 — when were the roof, HVAC, electrical panel, plumbing, and water heater last replaced?
- Property tax is high relative to price — has the assessment been appealed recently, and will the sale trigger a re-assessment?
- Is there a deadline driving the sale (1031 exchange, divorce, estate, relocation)? That informs how much negotiation room exists.
- Schools are D-rated, which usually means shorter tenancies and higher turnover. Who's the typical renter profile here, and what's been the actual vacancy rate?
- What's the average days-on-market for RENTAL listings here right now (not sales)? A rising rental-DOM trend means longer vacancies and softer asking-rent achievability than the comps imply.
- What's the recent tenant-quality profile in this submarket — average credit score on applications, eviction rate, late-payment / NSF rate, and stable-employment percentage? A property-management company in the area should have these aggregated.
- How much new for-sale + rental construction is in the pipeline within 1–3 miles? Heavy new supply typically softens prices + rents 12–24 months out; constrained supply supports both.
Investment metrics
- 1% rule
- 1.24% ✓
- Cap rate
- 7.94%
- Cash-on-cash
- 5.87%
- DSCR
- 1.26
- GRM
- 6.7
CMA / ARV
- ARV (on-the-fly)
- $281,175
- Comps found
- 12
Show comp detail 12 sales within ~0.75 mi
| Address | Dist | Beds/Ba | Sqft | Sold | Price | $/sf | Match |
|---|---|---|---|---|---|---|---|
| 18628 Morris Ave | 0.00mi | 4/2.0 | 1,725 (0%) | 0mo | $209,000 | $121 | 100 |
| 18513 Martin Ave | 0.14mi | 4/1.0 | 1,600 (-7%) | 3mo | $225,000 | $141 | 75 |
| 625 Perth Ave | 0.48mi | 3/1.5 (-1) | 1,768 (+2%) | 3mo | $305,000 | $173 | 64 |
| 18241 Gottschalk Ave | 0.53mi | 3/2.0 (-1) | 1,671 (-3%) | 2mo | $329,000 | $197 | 64 |
| 18436 Dixie Hwy | 0.25mi | 3/2.5 (-1) | 1,916 (+11%) | 0mo | $279,000 | $146 | 63 |
| 1826 Sycamore Rd | 0.69mi | 4/2.0 | 1,839 (+7%) | 3mo | $300,000 | $163 | 54 |
| 18441 Marshfield Ave | 0.63mi | 3/1.5 (-1) | 1,855 (+8%) | 1mo | $345,000 | $186 | 51 |
| 18630 Highland Ave | 0.39mi | 3/1.5 (-1) | 1,485 (-14%) | 2mo | $270,000 | $182 | 50 |
| 1631 187th St | 0.62mi | 3/1.5 (-1) | 1,878 (+9%) | 0mo | $260,000 | $138 | 49 |
| 18210 Perth Ave | 0.69mi | 4/2.0 | 1,950 (+13%) | 3mo | $232,500 | $119 | 43 |
| 18511 Argyle Ave | 0.60mi | 3/1.5 (-1) | 1,509 (-12%) | 2mo | $230,000 | $152 | 42 |
| 18530 Stedhall Rd | 0.69mi | 3/2.0 (-1) | 1,497 (-13%) | 2mo | $293,814 | $196 | 39 |
Match score weights: distance 35% · size 25% · config 20% · recency 20%. Top-matched comps best support the ARV.
Projected returns pro-forma
-3.0% appreciation · 3.0% rent growth · sell at horizon
- IRR
- -7.1%
- Equity multiple
- 0.74×
- Total profit
- $-15,484
- Equity at exit
- $31,312
- IRR
- 2.6%
- Equity multiple
- 1.19×
- Total profit
- $11,059
- Equity at exit
- $18,157
Cash invested: $58,800 (down + closing). Projections, not guarantees.
Landlord ↔ Tenant lean methodology
- Overall (STATE)
- 43 Moderately Tenant-Leaning
- State Illinois
- 43 Moderately Tenant-Leaning · D+7
- County
- — inherits STATE
- City
- — inherits STATE
ZIP-level market 60430
- Home prices YoY
- -32.1%
- Active inventory
- 101
- Price-to-rent
- 6.7×
Monthly cashflow live
- Estimated rent
- $2,611 high interval (Pro) →
- Mortgage (P&I)
- −$1,101
- Tax from tax record
- −$587 /mo · $7,039/yr
- Insurance
- −$88
- HOA
- −$0
- Vacancy / Maint / Mgmt
- −$548
- Net cashflow
- $287
Break-even live
UW: 25.0% down · 7.5% · 30yr · 1.5% tax · 5.0% vac · 8.0% maint · 8.0% mgmt
Financing live
Cash to close
- Down payment
- $52,500
- Closing costs
- $6,300
- Reserves months
- —
- Total cash needed
- —
Loan-product check · same deal, 3 products live
Conventional
25% down · 7.5% · 30yr
- Down + closing
- —
- Monthly P&I
- —
- Monthly cashflow
- —
- DSCR
- —
- Eligible?
- —
Personal DTI + credit; lowest rate.
DSCR
20% down · 8.5% · 30yr
- Down + closing
- —
- Monthly P&I
- —
- Monthly cashflow
- —
- DSCR
- —
- Eligible?
- —
No personal income docs; deal must DSCR.
Hard money
10% down · 12.0% · 12mo
- Down + closing
- —
- Monthly P&I
- —
- Monthly cashflow
- —
- DSCR
- —
- Eligible?
- —
Short-term bridge; refi at stabilization.
Rent comps 8 comps
| Address | Beds | Baths | Sqft | Rent | $/sqft | DOM | Units | Dist |
|---|---|---|---|---|---|---|---|---|
| 1802 Evergreen Rd Homewood, IL | 4.0 | 2.0 | 1716 | $2,836 | $1.65 | 6d | 1 | 0.54mi |
| 1601 183rd St Unit 1237861P Homewood, IL | 3.0 | 1.5 | 1528 | $8,665 | $5.67 | 22d | 1 | 0.76mi |
| 1332 Jamie Ln Homewood, IL | 4.0 | 2.5 | 1576 | $3,171 | $2.01 | 24d | 1 | 1.02mi |
| 2817 Sunset Ave Flossmoor, IL | 3.0 | 1.5 | 1648 | $1,900 | $1.15 | 25d | 1 | 1.10mi |
| 18117 Loomis Ave Homewood, IL | 4.0 | 2.0 | 1500 | $2,800 | $1.87 | 4d | 1 | 1.12mi |
| 2223 Hawthorne Rd Homewood, IL | 3.0 | 2.0 | 1552 | $2,300 | $1.48 | 25d | 1 | 1.21mi |
| 17561 Hillside Ave Homewood, IL | 3.0 | 1.0 | 1174 | $2,500 | $2.13 | 17d | 1 | 1.33mi |
| 17561 Hillside Ave Homewood, IL | 3.0 | 1.0 | 1174 | $2,300 | $1.96 | 1d | 1 | 1.33mi |
Listing history 3 events
-
2026-04-29status Pending
-
2026-04-24$210,000 Active
-
1978-06-19soldstatus $59,000
ⓘ Source: listings_history table (triggers on properties + properties_extension) + one-shot
backfill from property_details.listing_events for pre-trigger history.
Tax reassessment forecast IL · Partial reset (capped growth)
- Current annual tax
- $7,039 · $587/mo
- Projected year-2 tax
- $7,039 · $587/mo
- Expected delta
- $0/yr ($0/mo · 0.0%)
ⓘ Screening estimate from a state-policy table — verify with the county assessor before closing.
Climate risk First Street
- Flood 1/10 Low FEMA zone X (unshaded) · 0% chance over 30 yrs
- Wildfire 1/10 Low
- Heat 3/10 Moderate 7 d/yr ≥101°F today · 15 d/yr by 30 yrs out
- Wind 2/10 Low
- Air quality 3/10 Moderate 4 unhealthy d/yr today · 4 by 30 yrs out
Nearby sold comps map
Loading sold comps map…
Walkable amenities ~0.75 mi
Loading nearby amenities…
Taxation est. · year 1
- Rental income
- $31,334
- − Mortgage interest
- −$11,763
- − Property taxes
- −$7,039
- − Insurance
- −$1,050
- − Repairs & maintenance
- −$2,507
- − Management
- −$2,507
- − Depreciation
- −$6,109
- Taxable income
- $359
- Est. tax owed @ 24.0%
- −$86
- After-tax cash flow
- $3,363/yr
For passive investors: Depreciation is non-cash, so a rental often shows a tax loss while cash-flowing — sheltering income. Rental losses are passive: they offset passive income freely, and up to $25,000/yr can offset ordinary (W-2) income if you actively participate and your MAGI is under $100k (phasing out to $0 by $150k); unused losses carry forward. On sale, claimed depreciation is recaptured at up to 25%, and gains may owe capital-gains tax (a 1031 exchange can defer both). Figures are a year-1 estimate at your 24.0% rate — not tax advice; consult a CPA.
Schools (NCES district)
- District
- Homewood Flossmoor Chsd 233
- NCES district ID
- 1719560
- Math proficiency
- 21% ▼ -15.00%
- Reading proficiency
- 27% ▼ -13.00%
- Median HH income
- $83,564
- Composite
- 24.42/100
- National rank
- #7681
- State rank
- #272 of 620 in IL
Livability — Homewood
- Score
- 81/100
- State rank
- #81
- US rank
- #1314
Category grades
Schools grade is shown separately in the Schools card above.
Census & demographics
- Census place
- Homewood, IL
- City population
- 19,993
- Population (ZIP)
- 19,993
Population outlook (Cook County) Hauer SSP2
- Today (2025)
- 5,347,519 people
- By 2030
- 5,357,703 · +0.2%
- By 2040
- 5,324,924 · -0.4%
- By 2050
- 5,230,762 · -2.2%
- By 2075
- 4,785,735 · -10.5%
- By 2100
- 4,188,836 · -21.7%
Race, ethnicity, and origin ACS 2023
- Neighborhood character
- Diverse neighborhood (Simpson 0.62)
- Race & ethnicity
- Black 44% White 42% Hispanic / Latino 9% Two or more races 6% Asian 1%
- Hispanic origin (detail)
- Mexican 7%
- Common ancestry
- Romanian 5% Iranian 2% Italian 2%
- Foreign-born
- 6% · Canada, Dominican Republic
- Languages at home
- 91% English-only · Spanish 5% Russian/Polish/Slavic 1% German/W. Germanic 1%
Political lean MEDSL · Cook
- 2024 margin
- Solid D (+42.0) · D 70.4% · R 28.4% · Other 1.2%
- 2008→2024 swing
- -11.4pp toward R · 2008: 53.4pp · 2024: 42.0pp
- All cycles
- 2024: D+42.0 2020: D+50.3 2016: D+53.0 2012: D+49.4 2008: D+53.4
Not yet ingested
- Civics
- —
Market trends
- HPI YoY
- ▼ -105.00%
- Current HPI
- 222.2923
- Rent YoY
- —
- Metro
- —
- State GDP YoY
- ▲ 1.59%
- F500 in state
- 60
Industry mix (Fortune 500 HQ in IL)
| Industry | F500 HQs | Revenue |
|---|---|---|
| Insurance | 4 | $201B |
|
||
| Consumer Goods | 4 | $87B |
|
||
| Industrial Machinery | 3 | $64B |
|
||
| Healthcare | 2 | $55B |
|
||
| Retail / Pharmacy | 1 | $148B |
|
||
| Agriculture / Food | 1 | $86B |
|
||
Price history
+255.9% since first listed3 events — show timeline
- 2026-04-29 Pending — MRED as Distributed by MLS Grid
- 2026-04-24 Listed $210,000 MRED as Distributed by MLS Grid
- 1978-06-19 Sold (Public Records) $59,000 Public Records
Property tax history
+2.5%/yrLatest (2023): $7,039 · +36.4% YoY. Source: county tax records.
Cash-flow waterfall
monthlySold comps — $/sqft
last 12 mo · ≤1 miLoading sold comps…