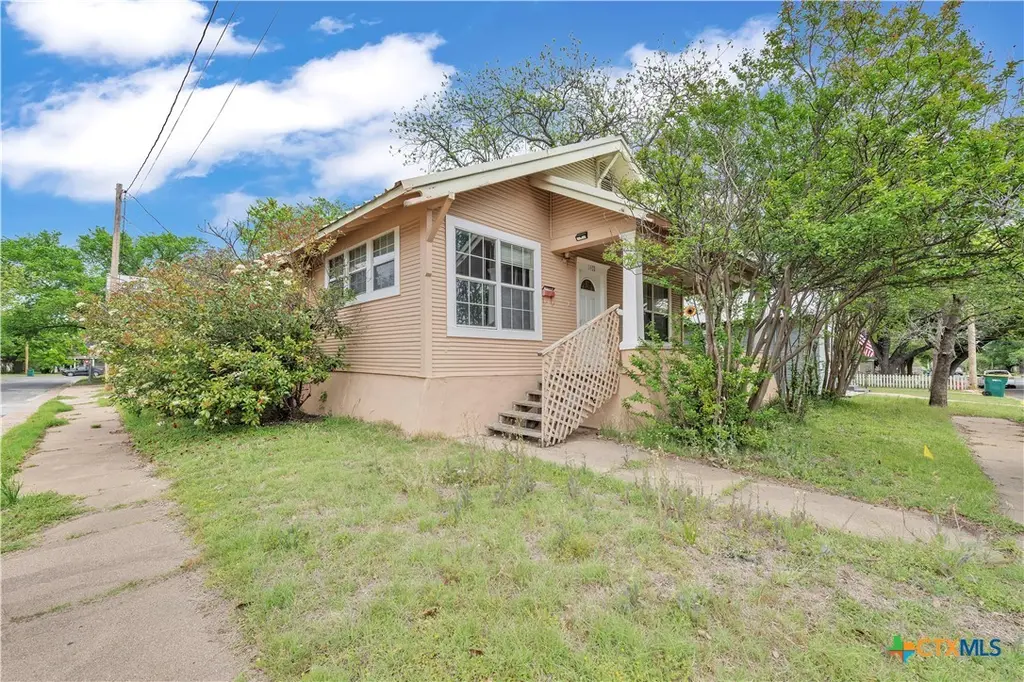
1401 Bridge St · Gatesville, TX
Flood risk 1/10 · Minimal
- FEMA flood zone
- X (unshaded)
- Chance of flooding over 30 yrs
- 0.0%
- Est. flood insurance / yr
- $507 – $1,088
Fire risk 6/10 · Moderate
- Est. fire insurance / yr
- $1,222 – $2,270
Heat risk 7/10 · Major
- Hot days now (above 108°F)
- 7 days/yr
- Hot days in 30 yrs
- 23 days/yr
Wind risk 6/10 · Moderate
- Chance of severe wind over 30 yrs
- 46.0%
Air-quality risk 1/10 · Minimal
- Unhealthy air days now
- 0 days/yr
- Unhealthy air days in 30 yrs
- 0 days/yr
Risk factors via First Street. Map © Google.
Why this score? — see what drove the C grade
The composite is a weighted blend of 9 inputs, each scored 0–100. Each bar is that input's sub-score; the figure is the points it added to the 100-point composite (weight × sub-score).
- Cash flow +22.3/30.0
- ARV discount +11.6/15.0
- DSCR +7.1/10.0
- 1% rule +5.7/10.0
- Schools +3.4/10.0
- Livability +3.2/5.0
- Rent growth +2.5/5.0
- Condition / age +2.5/5.0
- Appreciation +0.0/10.0
$145,000
🖨 Deal sheet 📄 Offer letter ✓ Due diligence
Listing remarks
Welcome To Old World Charm In Gatesville! 1401 Bridge Street Is Reminiscent of Earlier Times With A Front Wrap Around Porch, Large Pecan Trees, And An Rear Driveway. The Layout Consists of 3 Bed Rooms / 2 Full Baths/ 1 Living / & 1 Dining Area. The Front Entry Located Directly Off the Welcoming Porch Is Very Inviting With A Faux Fireplace for Holiday Decorating & Warmth. Bridge Street Also Boasts Of A Larger Dining Room {13.5 x 16.75} with Immediate Access To The Kitchen. The Flooring Is a combination of Ceramic Tile in the Wet Areas and Vinyl Floors in the remainder. The house itself is a basic floor Plan but is an ideal location and with some updating the Beauty could be re
Key facts
- Large pecan trees
- Larger dining room
- Metal roof
Tags
Property features AI
Finance
- HOA & community: Curbs
Exterior
- Parking: No garage
- Security: Smoke detectors
- Utilities: Cable available; Electricity available; Phone available; Public water; Public sewer
- Home design: Single-story residence; Faces south; Resale property; Pillar/post/pier foundation
- Construction: Metal roof; Lap siding and redwood siding; Year built per assessor
- Exterior features: Covered patio; Covered patio/porch; Chain link fencing; Corner city lot with mature trees; Level site, less than quarter acre; City street frontage
Interior
- Kitchen: Dishwasher; Electric range / range; Range hood
- Bedrooms: Bedroom 3 on main level (11.25 x 14.0); Bedroom 2 on main level (10.5 x 11.5); Additional bedroom on main level (11.5 x 13.75)
- Flooring: Ceramic tile; Vinyl
- Bathrooms: 2 full bathrooms
- Heating & cooling: Central heating (electric); Central air conditioning (one unit, electric)
- Interior features: Ceiling fans; Laminate counters; Tub/shower; Vanity; Window treatments; Kitchen/dining combo; Decorative living room fireplace
- Laundry & utility: Laundry room / utility room; Washer hookup; Electric dryer hookup; Electric water heater
Neighborhood map
What this means for you Summary
Snapshot
- This is a 3-bed/1.0-bath single-family listed at $145k.
Deal economics
- At list price, monthly cash flow is $239 ($3k/yr) — positive.
- The deal already cash-flows at list — no discount required.
- Meets the 1% rule at list price ($2k rent vs $145k).
- Recommended offer: $141k (3.0% below list) — sets the bar for market timing.
- Cap rate 8.3% vs local median 3.9% in Gatesville — top-decile yield for the area; either an underpriced asset or a hidden risk that comps aren't pricing in. Stress-test before assuming the spread holds.
Location & tenants
- Location reads 65/100 on livability (#702 in TX) — a middle-class / working-renter tenant base. Strengths: cost of living A+, housing A+, crime A; Watch: employment C-, schools F, amenities F.
- Gatesville ISD (town): math 38% / reading 42% proficiency, ranked #409 of 826 in TX (top 50%) — families likely to look elsewhere, expect single-tenant / working-renter base with shorter leases.
- Market conditions: 222 active listings in the ZIP; 3 comparable units currently listed for rent nearby; rentals leasing fast (median 14d on market — plan ~1-2 weeks tenant-placement turnaround); 386 units permitted in Coryell County in 2024 (0 in 5+ unit buildings).
Forward outlook
- Local home prices are declining (-3.0%/yr); year-one equity from $1k of loan paydown is wiped out by about $4k of value loss. Plan a longer hold.
Negotiation context
- It's been on market 49 days — a 3% lower offer ($141k) is reasonable based on typical stale-listing flexibility.
- 2 sale attempts since 13y ago with the ask held roughly flat each time — persistent listings suggest the price (not the market) is what's stuck; bring a comps-based counter.
Risks & watch-outs
- Watch-outs: built in 1945 — expect roof / HVAC / electrical / plumbing capex.
- Climate carrying-cost: major wind risk, 46% chance of damaging wind over 30y; major wildfire risk; extreme-heat days projected 7→23/yr by 2055 (HVAC capex compounding) — expect insurance premiums to compound above CPI over the hold.
Questions for the listing agent
- It's been on market 49 days. Have you received any prior offers? Is the seller open to a 3% concession, seller financing, or rate buy-down credit?
- Built in 1945 — when were the roof, HVAC, electrical panel, plumbing, and water heater last replaced?
- Is there a deadline driving the sale (1031 exchange, divorce, estate, relocation)? That informs how much negotiation room exists.
- Schools are F-rated, which usually means shorter tenancies and higher turnover. Who's the typical renter profile here, and what's been the actual vacancy rate?
- What's the average days-on-market for RENTAL listings here right now (not sales)? A rising rental-DOM trend means longer vacancies and softer asking-rent achievability than the comps imply.
- What's the recent tenant-quality profile in this submarket — average credit score on applications, eviction rate, late-payment / NSF rate, and stable-employment percentage? A property-management company in the area should have these aggregated.
- How much new for-sale + rental construction is in the pipeline within 1–3 miles? Heavy new supply typically softens prices + rents 12–24 months out; constrained supply supports both.
Investment metrics
- 1% rule
- 1.07% ✓
- Cap rate
- 8.27%
- Cash-on-cash
- 7.07%
- DSCR
- 1.31
- GRM
- 7.8
CMA / ARV
- ARV (median comp)
- $159,357
- List price
- $145,000
- Delta
- -9.01%
- Verdict
- FAIR
- Comps
- 20 within 1.0 mi
Show comp detail 12 sales within ~0.75 mi
| Address | Dist | Beds/Ba | Sqft | Sold | Price | $/sf | Match |
|---|---|---|---|---|---|---|---|
| 608 Live Oak St | 0.29mi | 3/1.0 | 1,230 (-2%) | 10mo | $175,000 | $142 | 74 |
| 1417 Pleasant St | 0.08mi | 2/1.0 (-1) | 1,176 (-7%) | 12mo | $100,000 | $85 | 70 |
| 1208 Mills St | 0.44mi | 3/2.0 | 1,314 (+4%) | 1mo | $230,000 | $175 | 68 |
| 1210 Mills St | 0.44mi | 3/2.0 | 1,314 (+4%) | 1mo | $230,000 | $175 | 67 |
| 1407 Mill St | 0.43mi | 3/2.0 | 1,226 (-3%) | 5mo | $235,000 | $192 | 67 |
| 1500 E Main St | 0.10mi | 2/1.0 (-1) | 1,083 (-14%) | 4mo | $138,500 | $128 | 64 |
| 217 Spindletop St | 0.38mi | 3/2.0 | 1,347 (+7%) | 5mo | $208,000 | $154 | 62 |
| 1908 Waco St | 0.41mi | 2/2.0 (-1) | 1,148 (-9%) | 6mo | $130,000 | $113 | 52 |
| 502 S 5th St | 0.56mi | 2/1.0 (-1) | 1,138 (-10%) | 1mo | $153,000 | $134 | 52 |
| 609 S 7th St | 0.49mi | 3/2.0 | 1,104 (-12%) | 15mo | $176,640 | $160 | 40 |
| 114 Hillcrest Dr | 0.71mi | 3/1.5 | 1,120 (-11%) | 9mo | $140,000 | $125 | 39 |
| 2004 Saunders St | 0.42mi | 4/2.0 (+1) | 1,416 (+12%) | 20mo | $100,000 | $71 | 34 |
Match score weights: distance 35% · size 25% · config 20% · recency 20%. Top-matched comps best support the ARV.
Projected returns pro-forma
-3.0% appreciation · 3.0% rent growth · sell at horizon
- IRR
- -5.5%
- Equity multiple
- 0.80×
- Total profit
- $-8,243
- Equity at exit
- $21,620
- IRR
- 4.2%
- Equity multiple
- 1.31×
- Total profit
- $12,495
- Equity at exit
- $12,537
Cash invested: $40,600 (down + closing). Projections, not guarantees.
Landlord ↔ Tenant lean methodology
- Overall (STATE)
- 87 Strongly Landlord-Friendly
- State Texas
- 87 Strongly Landlord-Friendly · R+5
- County
- — inherits STATE
- City
- — inherits STATE
ZIP-level market 76528
- Home prices YoY
- -24.2%
- Active inventory
- 222
- Price-to-rent
- 7.8×
Monthly cashflow live
- Estimated rent
- $1,547 medium interval (Pro) →
- Mortgage (P&I)
- −$760
- Tax from tax record
- −$162 /mo · $1,942/yr
- Insurance
- −$60
- HOA
- −$0
- Vacancy / Maint / Mgmt
- −$325
- Net cashflow
- $239
Break-even live
UW: 25.0% down · 7.5% · 30yr · 1.5% tax · 5.0% vac · 8.0% maint · 8.0% mgmt
Financing live
Cash to close
- Down payment
- $36,250
- Closing costs
- $4,350
- Reserves months
- —
- Total cash needed
- —
Loan-product check · same deal, 3 products live
Conventional
25% down · 7.5% · 30yr
- Down + closing
- —
- Monthly P&I
- —
- Monthly cashflow
- —
- DSCR
- —
- Eligible?
- —
Personal DTI + credit; lowest rate.
DSCR
20% down · 8.5% · 30yr
- Down + closing
- —
- Monthly P&I
- —
- Monthly cashflow
- —
- DSCR
- —
- Eligible?
- —
No personal income docs; deal must DSCR.
Hard money
10% down · 12.0% · 12mo
- Down + closing
- —
- Monthly P&I
- —
- Monthly cashflow
- —
- DSCR
- —
- Eligible?
- —
Short-term bridge; refi at stabilization.
Rent comps 3 comps
| Address | Beds | Baths | Sqft | Rent | $/sqft | DOM | Units | Dist |
|---|---|---|---|---|---|---|---|---|
| 114 Oak Lane Dr Gatesville, TX | 3.0 | 2.0 | 1170 | $1,550 | $1.32 | 13d | 1 | 0.75mi |
| 213 Stillhouse Rd Gatesville, TX | 3.0 | 2.0 | 1750 | $1,380 | $0.79 | 13d | 1 | 1.19mi |
| 1315 Greens Private Dr Gatesville, TX | 3.0 | 2.0 | 1600 | $1,350 | $0.84 | 13d | 1 | 1.31mi |
Listing history 20 events
-
2026-06-18days on market $145,000 Active 49 DOM
-
2026-06-17days on market $145,000 Active 48 DOM
-
2026-06-16days on market $145,000 Active 47 DOM
-
2026-06-15days on market $145,000 Active 46 DOM
-
2026-06-14days on market $145,000 Active 44 DOM
-
2026-06-13days on market $145,000 Active 43 DOM
-
2026-06-10days on market $145,000 Active 41 DOM
-
2026-06-09days on market $145,000 Active 40 DOM
-
2026-06-08days on market $145,000 Active 39 DOM
-
2026-06-07days on market $145,000 Active 38 DOM
-
2026-06-05days on market $145,000 Active 35 DOM
-
2026-06-03days on market $145,000 Active 34 DOM
-
2026-06-02days on market $145,000 Active 33 DOM
-
2026-06-01days on market $145,000 Active 32 DOM
-
2026-05-31days on market $145,000 Active 31 DOM
-
2026-05-30days on market $145,000 Active 30 DOM
-
2026-04-30$145,000 Active 972-char remark
-
2014-01-29historical
-
2013-09-26$67,000
-
2006-04-26soldstatus
ⓘ Source: listings_history table (triggers on properties + properties_extension) + one-shot
backfill from property_details.listing_events for pre-trigger history.
Tax reassessment forecast TX · Resets to sale price
- Current annual tax
- $1,942 · $162/mo
- Projected year-2 tax
- $2,654 · $221/mo
- Expected delta
- +$712/yr (+$59/mo · 36.7%)
ⓘ Screening estimate from a state-policy table — verify with the county assessor before closing.
Climate risk First Street
- Flood 1/10 Low FEMA zone X (unshaded) · 0% chance over 30 yrs
- Wildfire 6/10 Major
- Heat 7/10 Severe 7 d/yr ≥108°F today · 23 d/yr by 30 yrs out
- Wind 6/10 Major 46% chance of damaging wind over 30 yrs
- Air quality 1/10 Low 0 unhealthy d/yr today · 0 by 30 yrs out
Nearby sold comps map
Loading sold comps map…
Walkable amenities ~0.75 mi
Loading nearby amenities…
Taxation est. · year 1
- Rental income
- $18,561
- − Mortgage interest
- −$8,122
- − Property taxes
- −$1,942
- − Insurance
- −$725
- − Repairs & maintenance
- −$1,485
- − Management
- −$1,485
- − Depreciation
- −$4,218
- Taxable income
- $584
- Est. tax owed @ 24.0%
- −$140
- After-tax cash flow
- $2,732/yr
For passive investors: Depreciation is non-cash, so a rental often shows a tax loss while cash-flowing — sheltering income. Rental losses are passive: they offset passive income freely, and up to $25,000/yr can offset ordinary (W-2) income if you actively participate and your MAGI is under $100k (phasing out to $0 by $150k); unused losses carry forward. On sale, claimed depreciation is recaptured at up to 25%, and gains may owe capital-gains tax (a 1031 exchange can defer both). Figures are a year-1 estimate at your 24.0% rate — not tax advice; consult a CPA.
Schools (NCES district)
- District
- Gatesville ISD
- NCES district ID
- 4820500
- Math proficiency
- 38% ▼ -3.00%
- Reading proficiency
- 42% ▬ 0.00%
- Median HH income
- $47,114
- Composite
- 34.21/100
- National rank
- #5264
- State rank
- #409 of 826 in TX
Livability — Gatesville
- Score
- 65/100
- State rank
- #702
- US rank
- #13121
Category grades
Schools grade is shown separately in the Schools card above.
Census & demographics
- Census place
- Gatesville, TX
- County
- Coryell County · 61,053 people
- City population
- 18,935
- Metro
- Killeen-Temple, TX
- Population (ZIP)
- 18,935
- Household income
- $70,558
- Rent vs Own
- Severe rent burden
- 243.0
Population outlook (Coryell County) Hauer SSP2
- Today (2025)
- 75,485 people
- By 2030
- 75,627 · +0.2%
- By 2040
- 74,898 · -0.8%
- By 2050
- 74,221 · -1.7%
- By 2075
- 72,688 · -3.7%
- By 2100
- 66,862 · -11.4%
Race, ethnicity, and origin ACS 2023
- Neighborhood character
- Predominantly White (71%)
- Race & ethnicity
- White 71% Hispanic / Latino 16% Two or more races 15% Black 4% Asian 1%
- Hispanic origin (detail)
- Mexican 13%
- Common ancestry
- Slovak 2% Lithuanian 2% Serbian 1%
- Foreign-born
- 5% · Canada, South Korea
- Languages at home
- 87% English-only · Spanish 10% German/W. Germanic 1% Other Indo-European 1%
Political lean MEDSL · Coryell
- 2024 margin
- Solid R (+40.7) · D 29.1% · R 69.8% · Other 1.1%
- 2008→2024 swing
- -13.8pp toward R · 2008: -26.9pp · 2024: -40.7pp
- All cycles
- 2024: R+40.7 2020: R+33.5 2016: R+39.5 2012: R+36.6 2008: R+26.9
Not yet ingested
- Civics
- —
Market trends
- HPI YoY
- ▼ -66.18%
- Current HPI
- 206.6876
- Rent YoY
- —
- Metro
- Killeen-Temple, TX
- State GDP YoY
- ▲ 3.95%
- F500 in state
- 110
Industry mix (Fortune 500 HQ in TX)
| Industry | F500 HQs | Revenue |
|---|---|---|
| Energy | 16 | $1,198B |
|
||
| Technology | 5 | $198B |
|
||
| Engineering / Construction | 4 | $72B |
|
||
| Energy Services | 3 | $60B |
|
||
| Utilities | 3 | $41B |
|
||
| Healthcare | 2 | $330B |
|
||
Price history
+116.4% since first listed4 events — show timeline
- 2026-04-30 Listed $145,000 CTXMLS
- 2014-01-29 Listing Removed — CTXMLS
- 2013-09-26 Listed $67,000 CTXMLS
- 2006-04-26 Sold (Public Records) — Public Records
Property tax history
+7.7%/yrLatest (2025): $1,942 · +2.5% YoY. Source: county tax records.
Cash-flow waterfall
monthlySold comps — $/sqft
last 12 mo · ≤1 miLoading sold comps…