31 Lissner Ave · Savannah, GA
Flood risk 1/10 · Minimal
- FEMA flood zone
- X (unshaded)
- Chance of flooding over 30 yrs
- 0.0%
- Est. flood insurance / yr
- $507 – $1,088
Fire risk 2/10 · Minimal
- Est. fire insurance / yr
- $963 – $1,789
Heat risk 9/10 · Severe
- Hot days now (above 109°F)
- 7 days/yr
- Hot days in 30 yrs
- 18 days/yr
Wind risk 8/10 · Major
- Chance of severe wind over 30 yrs
- 99.0%
Air-quality risk 5/10 · Moderate
- Unhealthy air days now
- 7 days/yr
- Unhealthy air days in 30 yrs
- 8 days/yr
Risk factors via First Street. Map © Google.
Why this score? — see what drove the D grade
The composite is a weighted blend of 9 inputs, each scored 0–100. Each bar is that input's sub-score; the figure is the points it added to the 100-point composite (weight × sub-score).
- Cash flow +14.7/30.0
- ARV discount +7.5/15.0
- DSCR +4.5/10.0
- Livability +4.3/5.0
- 1% rule +3.0/10.0
- Rent growth +2.5/5.0
- Condition / age +2.5/5.0
- Schools +2.0/10.0
- Appreciation +0.0/10.0
$183,900
🖨 Deal sheet (PDF) 📄 Offer letter ✓ Due diligence
Listing remarks MLS
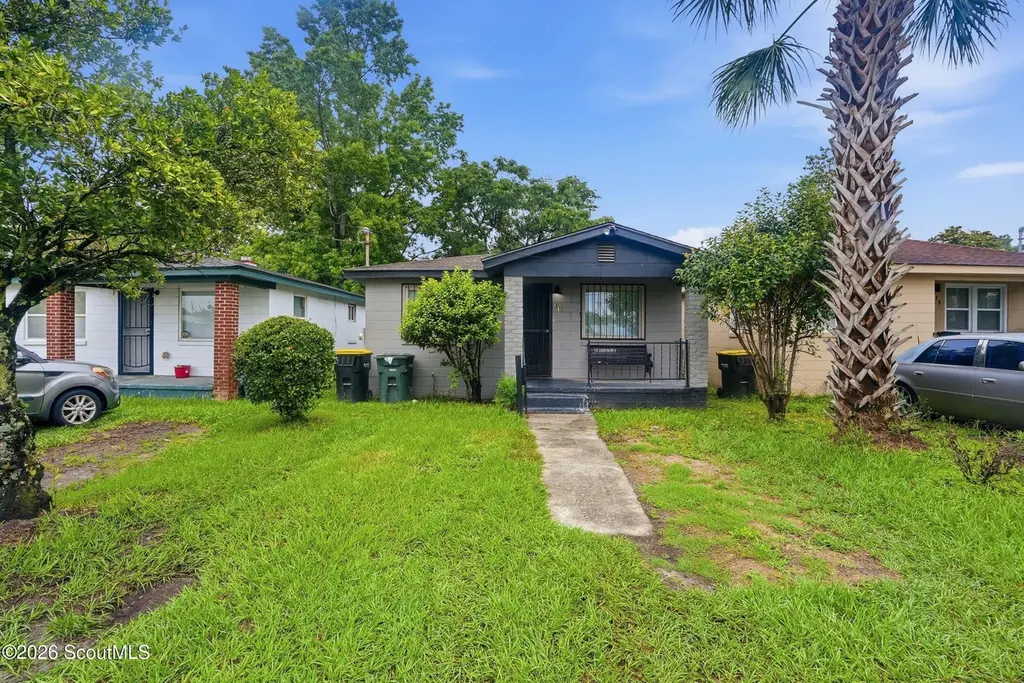
This well-maintained 3-bedroom, 1-bath block home offers comfortable living with a practical floor plan and durable construction. The solid block exterior provides long-lasting value and low-maintenance ownership, making it an excellent option for families, first-time buyers, or investors. Inside, the home features a bright and inviting living area that flows seamlessly into the kitchen. The kitchen offers ample cabinet space and includes a washer and dryer for added convenience, maximizing functionality while keeping household tasks within easy reach. The three bedrooms are comfortably sized and provide flexibility for family living, guests, or a home office. The full bathroom is equipped with a tub and shower combination, offering both relaxation and everyday practicality. Neutral finishes throughout the home create a welcoming atmosphere and provide a blank canvas for personal decorating touches. A small front porch adds charm and curb appeal while providing the perfect spot to enjoy a morning cup of coffee or relax in the evening. The yard offers space for outdoor activities, gardening, or entertaining family and friends. Combining affordability, comfort, and convenience, this 3-bedroom block home is move-in ready and presents a wonderful opportunity for anyone seeking a cozy and functional place to call home. * Tenant occupied, lease is up April 27'.
Key facts
- Solid block exterior
- Bright living area
- Small front porch
Tags
Property features AI
Exterior
- Utilities: Shared well water; Public sewer; Underground utilities
- Home design: Single-family residence; 1 story
- Construction: Block construction
- Exterior features: Property has a view
Interior
- Bathrooms: 1 full bathroom
- Heating & cooling: Central electric heating; Central electric cooling
- Interior features: Electric water heater
- Laundry & utility: Laundry located in the kitchen
Neighborhood map
What this means for you Summary
Snapshot
- This is a 3-bed/1.0-bath single-family listed at $184k.
Deal economics
- At list price, monthly cash flow is $46 ($556/yr) — positive.
- The deal already cash-flows at list — no discount required.
- To meet the 1% rule (rent ≥ 1% of price), the offer needs to be $147k (20.0% below list).
- Recommended offer: $147k (20.0% below list) — sets the bar for 1% rule.
- Cap rate 6.6% vs local median 4.0% in Savannah — top-decile yield for the area; either an underpriced asset or a hidden risk that comps aren't pricing in. Stress-test before assuming the spread holds.
Location & tenants
- Location reads 86/100 on livability (#1 in GA, #397 nationally) — a professional / high-income tenant draw. Strengths: crime A+, amenities A+, commute A+; Watch: employment D, schools F.
- Savannah-Chatham County (urban): math 20% / reading 26% proficiency, ranked #134 of 174 in GA (top 77%) — low school quality limits family demand, transient renter base, plan for 1-2y turnover.
- Market conditions: 36 active listings in the ZIP; 17 comparable units currently listed for rent nearby; rentals lingering (median 45d on market — plan ~5-8 weeks vacancy on turnover, expect pricing pressure); 59% of comp listings sitting > 30 days — soft ceiling on asking rent; 2,694 units permitted in Chatham County in 2024 (973 in 5+ unit buildings).
Forward outlook
- Local home prices are declining (-3.0%/yr); year-one equity from $1k of loan paydown is wiped out by about $6k of value loss. Plan a longer hold.
- Chatham County population projected at +33% by 2050 — long-run rental-demand tailwind backs the buy-and-hold thesis.
Negotiation context
- It's been on market 18 days — a 2% lower offer ($181k) is reasonable based on typical stale-listing flexibility.
- 4 sale attempts with the ask held roughly flat each time — persistent listings suggest the price (not the market) is what's stuck; bring a comps-based counter.
- Current owner paid $85k; list at $184k implies a 116% gain — meaningful room to come down on a strong offer.
Risks & watch-outs
- Climate carrying-cost: severe wind risk, 99% chance of damaging wind over 30y; extreme-heat days projected 7→18/yr by 2055 (HVAC capex compounding) — expect insurance premiums to compound above CPI over the hold.
Questions for the listing agent
- Built in 1962 — when were the roof, HVAC, electrical panel, plumbing, and water heater last replaced?
- Is there a deadline driving the sale (1031 exchange, divorce, estate, relocation)? That informs how much negotiation room exists.
- Schools are F-rated, which usually means shorter tenancies and higher turnover. Who's the typical renter profile here, and what's been the actual vacancy rate?
- The area grade is low — what's the realistic commute time and amenity access for the typical tenant pool here? Any planned neighborhood developments (good or bad) we should know about?
- What's the average days-on-market for RENTAL listings here right now (not sales)? A rising rental-DOM trend means longer vacancies and softer asking-rent achievability than the comps imply.
- What's the recent tenant-quality profile in this submarket — average credit score on applications, eviction rate, late-payment / NSF rate, and stable-employment percentage? A property-management company in the area should have these aggregated.
- How much new for-sale + rental construction is in the pipeline within 1–3 miles? Heavy new supply typically softens prices + rents 12–24 months out; constrained supply supports both.
Investment metrics
- 1% rule
- 0.80% ✗
- Cap rate
- 6.60%
- Cash-on-cash
- 1.08%
- DSCR
- 1.05
- GRM
- 10.4
CMA / ARV
- ARV (on-the-fly)
- $118,289
- Comps found
- 7
Show comp detail 7 sales within ~0.75 mi
| Address | Dist | Beds/Ba | Sqft | Sold | Price | $/sf | Match |
|---|---|---|---|---|---|---|---|
| 110 Wright St | 0.25mi | 3/1.0 | 868 (+2%) | 8mo | $195,000 | $225 | 78 |
| 109 Kingman Ave | 0.11mi | 2/1.0 (-1) | 936 (+10%) | 5mo | $165,000 | $176 | 69 |
| 29 Way St | 0.55mi | 2/1.0 (-1) | 816 (-4%) | 10mo | $90,000 | $110 | 54 |
| 259 Brittany St | 0.57mi | 2/1.0 (-1) | 934 (+10%) | 3mo | $69,500 | $74 | 50 |
| 2102 Patch St | 0.56mi | 3/1.0 | 960 (+13%) | 4mo | $115,000 | $120 | 50 |
| 2011 Gugel St | 0.67mi | 2/1.0 (-1) | 960 (+13%) | 4mo | $220,000 | $229 | 40 |
| 2106 Mell St | 0.65mi | 2/1.0 (-1) | 755 (-11%) | 17mo | $105,000 | $139 | 32 |
Match score weights: distance 35% · size 25% · config 20% · recency 20%. Top-matched comps best support the ARV.
Projected returns pro-forma
-3.0% appreciation · 3.0% rent growth · sell at horizon
- IRR
- -14.6%
- Equity multiple
- 0.48×
- Total profit
- $-26,921
- Equity at exit
- $27,420
- IRR
- -6.0%
- Equity multiple
- 0.61×
- Total profit
- $-19,938
- Equity at exit
- $15,900
Cash invested: $51,492 (down + closing). Projections, not guarantees.
Landlord ↔ Tenant lean methodology
- Overall (STATE)
- 90 Strongly Landlord-Friendly
- State Georgia
- 90 Strongly Landlord-Friendly · R+3
- County
- — inherits STATE
- City
- — inherits STATE
ZIP-level market 31408
- Home prices YoY
- -10.4%
- Active inventory
- 36
- Price-to-rent
- 10.4×
Monthly cashflow live
- Estimated rent
- $1,472 high interval (Pro) →
- Mortgage (P&I)
- −$964
- Tax from tax record
- −$76 /mo · $907/yr
- Insurance
- −$77
- HOA
- −$0
- Vacancy / Maint / Mgmt
- −$309
- Net cashflow
- $46
Break-even live
Sensitivity live
| Price | -10% $150 | -5% $98 | +0% $46 | +5% $-6 | +10% $-58 |
|---|---|---|---|---|---|
| Rent | -10% $-70 | -5% $-12 | +0% $46 | +5% $104 | +10% $163 |
| Rate | -1.0pp $139 | -0.5pp $93 | base $46 | +0.5pp $-1 | +1.0pp $-50 |
UW: 25.0% down · 7.5% · 30yr · 1.5% tax · 5.0% vac · 8.0% maint · 8.0% mgmt
Financing live
Cash to close
- Down payment
- $45,975
- Closing costs
- $5,517
- Reserves months
- —
- Total cash needed
- —
Loan-product check · same deal, 3 products live
Conventional
25% down · 7.5% · 30yr
- Down + closing
- —
- Monthly P&I
- —
- Monthly cashflow
- —
- DSCR
- —
- Eligible?
- —
Personal DTI + credit; lowest rate.
DSCR
20% down · 8.5% · 30yr
- Down + closing
- —
- Monthly P&I
- —
- Monthly cashflow
- —
- DSCR
- —
- Eligible?
- —
No personal income docs; deal must DSCR.
Hard money
10% down · 12.0% · 12mo
- Down + closing
- —
- Monthly P&I
- —
- Monthly cashflow
- —
- DSCR
- —
- Eligible?
- —
Short-term bridge; refi at stabilization.
Rent comps 17 comps
| Address | Beds | Baths | Sqft | Rent | $/sqft | DOM | Units | Dist |
|---|---|---|---|---|---|---|---|---|
| 2100 Patch St Savannah, GA | 2.0 | 1.0 | 672 | $1,525 | $2.27 | 44d | 1 | 0.57mi |
| 3508 Haslam Ave Savannah, GA | 2.0 | 1.0 | 988 | $1,395 | $1.41 | 24d | 1 | 0.58mi |
| 2023 Gugel St Savannah, GA | 3.0 | 2.0 | 1008 | $1,900 | $1.88 | 44d | 1 | 0.64mi |
| 120 Jenks St Savannah, GA | 3.0 | 1.0 | 1042 | $1,600 | $1.54 | 44d | 1 | 0.72mi |
| 226 Fell St Savannah, GA | 3.0 | 1.0 | 1025 | $1,695 | $1.65 | 22d | 1 | 0.80mi |
| 1416 Chester St Savannah, GA | 3.0 | 1.0 | 960 | $1,600 | $1.67 | 24d | 1 | 0.94mi |
| 1402 New Castle St Savannah, GA | 2.0 | 1.0 | 928 | $1,500 | $1.62 | 44d | 1 | 0.99mi |
| 1423 Richards St Savannah, GA | 2.0 | 1.0 | 672 | $1,275 | $1.90 | 44d | 1 | 0.99mi |
| 1421 Richards St Savannah, GA | 2.0 | 1.0 | 672 | $1,275 | $1.90 | 44d | 1 | 1.00mi |
| 1419 Richards St Savannah, GA | 2.0 | 1.0 | 672 | $1,200 | $1.79 | 44d | 1 | 1.00mi |
| 1402 Comer St Savannah, GA | 2.0 | 1.0 | 690 | $1,200 | $1.74 | 44d | 1 | 1.00mi |
| 1415 Richards St Savannah, GA | 2.0 | 1.0 | 672 | $1,200 | $1.79 | 44d | 1 | 1.01mi |
| 40 Eagle St Savannah, GA | 1.0–2.0 | 1.0 | 841 | $1,331 | $1.58 | 24d | 6 | 1.15mi |
| 1325 Exley St Savannah, GA | 2.0–3.0 | 1.0–2.5 | 1193 | $1,432 | $1.20 | 22d | 6 | 1.16mi |
| 206 Ferrill St Savannah, GA | 3.0 | 1.0 | 936 | $1,450 | $1.55 | 14d | 1 | 1.25mi |
| 17 Dutton St Savannah, GA | 3.0 | 1.0 | 990 | $1,650 | $1.67 | 14d | 1 | 1.34mi |
| 1013 Carroll St Savannah, GA | 2.0 | 1.5 | 768 | $1,400 | $1.82 | 44d | 1 | 1.47mi |
Listing history 13 events
-
2026-06-21days on market $183,900 Active 18 DOM
-
2026-06-18days on market $183,900 Active 15 DOM
-
2026-06-17days on market $183,900 Active 14 DOM
-
2026-06-16days on market $183,900 Active 13 DOM
-
2026-06-15days on market $183,900 Active 12 DOM
-
2026-06-14days on market $183,900 Active 10 DOM
-
2026-06-13days on market $183,900 Active 9 DOM
-
2026-06-10days on market $183,900 Active 7 DOM
-
2026-06-09days on market $183,900 Active 6 DOM
-
2026-06-08days on market $183,900 Active 5 DOM
-
2026-06-07days on market $183,900 Active 4 DOM
-
2026-06-05remarks 699-char remark
-
2026-06-05$183,900 Active 1 DOM
ⓘ Source: listings_history table (triggers on properties + properties_extension) + one-shot
backfill from property_details.listing_events for pre-trigger history.
Tax reassessment forecast GA · Resets to sale price
- Current annual tax
- $907 · $76/mo
- Projected year-2 tax
- $1,692 · $141/mo
- Expected delta
- +$785/yr (+$65/mo · 86.5%)
ⓘ Screening estimate from a state-policy table — verify with the county assessor before closing.
Climate risk First Street
- Flood 1/10 Low FEMA zone X (unshaded) · 0% chance over 30 yrs
- Wildfire 2/10 Low
- Heat 9/10 Extreme 7 d/yr ≥109°F today · 18 d/yr by 30 yrs out
- Wind 8/10 Severe 99% chance of damaging wind over 30 yrs
- Air quality 5/10 Major 7 unhealthy d/yr today · 8 by 30 yrs out
Nearby sold comps map
Loading sold comps map…
Walkable amenities ~0.75 mi
Loading nearby amenities…
Taxation est. · year 1
- Rental income
- $17,665
- − Mortgage interest
- −$10,301
- − Property taxes
- −$907
- − Insurance
- −$920
- − Repairs & maintenance
- −$1,413
- − Management
- −$1,413
- − Depreciation
- −$5,350
- Taxable loss
- −$2,639
- Est. tax savings @ 24.0%
- +$633
- After-tax cash flow
- $1,189/yr
For passive investors: Depreciation is non-cash, so a rental often shows a tax loss while cash-flowing — sheltering income. Rental losses are passive: they offset passive income freely, and up to $25,000/yr can offset ordinary (W-2) income if you actively participate and your MAGI is under $100k (phasing out to $0 by $150k); unused losses carry forward. On sale, claimed depreciation is recaptured at up to 25%, and gains may owe capital-gains tax (a 1031 exchange can defer both). Figures are a year-1 estimate at your 24.0% rate — not tax advice; consult a CPA.
Schools (NCES district)
- District
- Savannah-Chatham County
- NCES district ID
- 1301020
- Math proficiency
- 20% ▼ -11.00%
- Reading proficiency
- 26% ▼ -5.00%
- Median HH income
- $47,443
- Composite
- 20.14/100
- National rank
- #8639
- State rank
- #134 of 174 in GA
Livability — Savannah
- Score
- 86/100
- State rank
- #1
- US rank
- #397
Category grades
Schools grade is shown separately in the Schools card above.
Census & demographics
- Census place
- Savannah, GA
- City population
- 216,564
- Population (ZIP)
- 11,791
Population outlook (Chatham County) Hauer SSP2
- Today (2025)
- 332,584 people
- By 2030
- 355,508 · +6.9%
- By 2040
- 400,030 · +20.3%
- By 2050
- 443,019 · +33.2%
- By 2075
- 534,579 · +60.7%
- By 2100
- 583,863 · +75.6%
Race, ethnicity, and origin ACS 2023
- Neighborhood character
- Diverse neighborhood (Simpson 0.66)
- Race & ethnicity
- Black 47% White 29% Hispanic / Latino 19% Two or more races 7% Asian 2%
- Hispanic origin (detail)
- Mexican 11%
- Common ancestry
- Iranian 1% Serbian 1% Slovak 1%
- Foreign-born
- 12% · Canada
- Languages at home
- 83% English-only · Spanish 15% Other Asian/Pacific 1% Arabic 1%
Political lean MEDSL · Chatham
- 2024 margin
- D (+18.0) · D 58.6% · R 40.6%
- 2008→2024 swing
- +3.6pp toward D · 2008: 14.4pp · 2024: 18.0pp
- All cycles
- 2024: D+18.0 2020: D+18.8 2016: D+14.5 2012: D+12.0 2008: D+14.4
Not yet ingested
- Civics
- —
Market trends
- HPI YoY
- ▼ -35.98%
- Current HPI
- 309.1601
- Rent YoY
- —
- Metro
- —
- State GDP YoY
- ▲ 2.66%
- F500 in state
- 28
Industry mix (Fortune 500 HQ in GA)
| Industry | F500 HQs | Revenue |
|---|---|---|
| Paper / Packaging | 2 | $29B |
|
||
| Retail | 1 | $160B |
|
||
| Transportation / Logistics | 1 | $91B |
|
||
| Airlines | 1 | $62B |
|
||
| Consumer Goods | 1 | $47B |
|
||
| Utilities | 1 | $25B |
|
||
Price history
+83.9% since first listed8 events — show timeline
- 2026-06-02 Listed $183,900 Hive MLS
- 2026-06-02 Listed $183,900 GIAR
- 2025-09-18 Sold (Public Records) $85,000 Public Records
- 2025-08-29 Sold (MLS) $86,000 Hive MLS
- 2025-08-13 Listing Removed — Hive MLS
- 2025-08-13 Listing Removed — Hive MLS
- 2025-05-01 Listed $100,000 Hive MLS
- 2025-05-01 Listed $100,000 Hive MLS
Property tax history
+4.7%/yrLatest (2025): $907 · +43.2% YoY. Source: county tax records.
Cash-flow waterfall
monthlySold comps — $/sqft
last 12 mo · ≤1 miLoading sold comps…