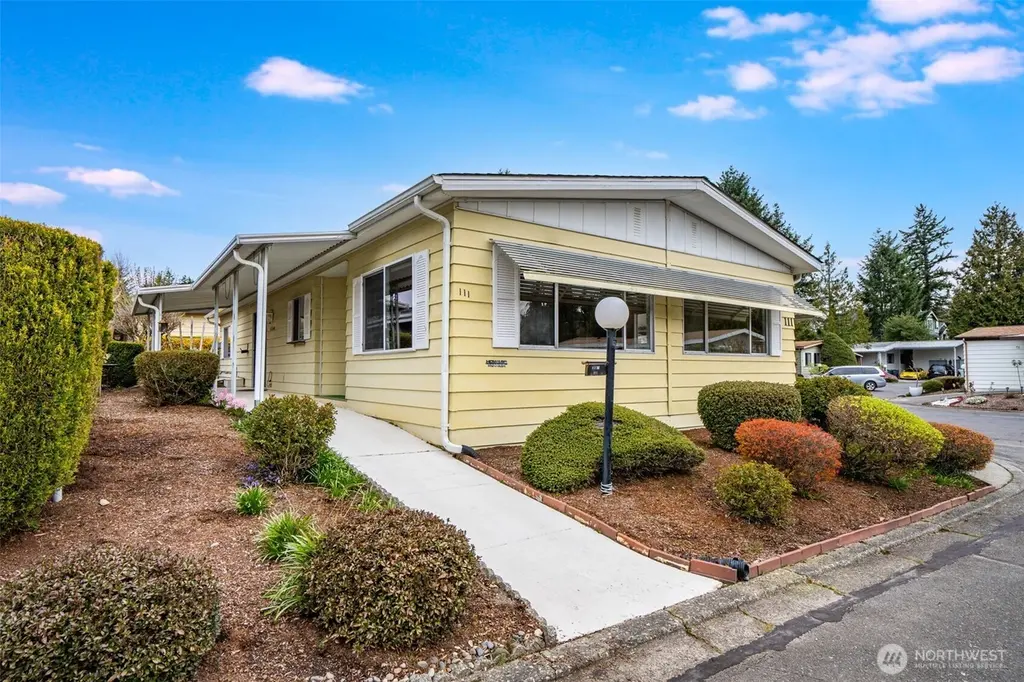
201 Union Ave SE #111 · Renton, WA
Flood risk 1/10 · Minimal
- FEMA flood zone
- X (unshaded)
- Chance of flooding over 30 yrs
- 0.0%
- Est. flood insurance / yr
- $507 – $1,088
Fire risk 1/10 · Minimal
- Est. fire insurance / yr
- $604 – $1,122
Heat risk 3/10 · Minor
- Hot days now (above 86°F)
- 7 days/yr
- Hot days in 30 yrs
- 15 days/yr
Wind risk 1/10 · Minimal
- Chance of severe wind over 30 yrs
- —
Air-quality risk 7/10 · Major
- Unhealthy air days now
- 10 days/yr
- Unhealthy air days in 30 yrs
- 11 days/yr
Risk factors via First Street. Map © Google.
Why this score? — see what drove the B+ grade
The composite is a weighted blend of 9 inputs, each scored 0–100. Each bar is that input's sub-score; the figure is the points it added to the 100-point composite (weight × sub-score).
- Cash flow +30.0/30.0
- ARV discount +14.2/15.0
- 1% rule +10.0/10.0
- DSCR +10.0/10.0
- Schools +4.7/10.0
- Livability +4.2/5.0
- Condition / age +3.8/5.0
- Rent growth +2.6/5.0
- Appreciation +0.0/10.0
$114,900
🖨 Deal sheet (PDF) 📄 Offer letter ✓ Due diligence
Listing remarks
Welcome home to the fabulous 55+ community of Leisure Estates located in the desirable Renton Highlands! Enjoy this beautifully maintained, 1344 square foot home located on a large corner lot! Recent updates include a new roof in 2024, several updated appliances, and luxury vinyl plank flooring! Great floorplan offers both a formal living room with dining area as well as a family room adjacent to the large kitchen. In the kitchen, find ample counter space and cabinets ready for a cooking endeavors or entertaining! The kitchen also provides a large breakfast bar, perfect for an informal meal! From the family room, a large, light-filled sliding door exits to an immaculate covered patio ready
Key facts
- Updated appliances
- Large corner lot
- Family room
Tags
Neighborhood map
What this means for you Summary
Snapshot
- This is a 2-bed/2.0-bath manufactured listed at $115k. Condition is rated good.
Deal economics
- At list price, monthly cash flow is $1k ($14k/yr) — positive.
- The deal already cash-flows at list — no discount required.
- Meets the 1% rule at list price ($3k rent vs $115k).
- Recommended offer: $108k (6.0% below list) — sets the bar for market timing.
- Cap rate 18.8% vs local median 2.3% in Renton — top-decile yield for the area; either an underpriced asset or a hidden risk that comps aren't pricing in. Stress-test before assuming the spread holds.
Location & tenants
- Location reads 83/100 on livability (#52 in WA, #949 nationally) — a professional / high-income tenant draw. Strengths: amenities A+, commute A+, employment A+; Watch: crime D-, cost of living F.
- Renton School District (urban): math 47% / reading 55% proficiency, ranked #119 of 291 in WA (top 41%) — acceptable for families but not a draw, mixed tenant base, ~2y average lease.
- Market conditions: Rents flat; 255 active listings in the ZIP; 33 comparable units currently listed for rent nearby; rentals leasing fast (median 4d on market — plan ~1-2 weeks tenant-placement turnaround); high-income renter base; 10,555 units permitted in King County in 2024 (7,119 in 5+ unit buildings).
Forward outlook
- Local home prices are declining (-3.0%/yr); year-one equity from $794 of loan paydown is wiped out by about $3k of value loss. Plan a longer hold.
- King County population projected at +44% by 2050 — long-run rental-demand tailwind backs the buy-and-hold thesis.
- At projected returns (-3.0% appreciation + 0.3% rent growth), your $32k cash investment doubles in ~3 years — after that, you're playing with house money.
Negotiation context
- It's been on market 76 days — a 6% lower offer ($108k) is reasonable based on typical stale-listing flexibility.
- 2 sale attempts since 21y ago with the ask held roughly flat each time — persistent listings suggest the price (not the market) is what's stuck; bring a comps-based counter.
- Current owner paid $60k; list at $115k implies a 92% gain — meaningful room to come down on a strong offer.
Questions for the listing agent
- It's been on market 76 days. Have you received any prior offers? Is the seller open to a 6% concession, seller financing, or rate buy-down credit?
- Built in 1978 — when were the roof, HVAC, electrical panel, plumbing, and water heater last replaced?
- Why hasn't it sold? Are there any deal-killer items the seller is aware of (foundation, flood, title, zoning, code violations)?
- Is there a deadline driving the sale (1031 exchange, divorce, estate, relocation)? That informs how much negotiation room exists.
- Schools are B-rated — typically a magnet for longer-tenancy family renters. What's the average tenant stay here, and is there a school-zone premium baked into asking?
- Crime grade is D in this area — have there been break-ins, vandalism, or insurance claims at this property in the last 3 years? What carrier currently insures it and at what premium?
- What's the average days-on-market for RENTAL listings here right now (not sales)? A rising rental-DOM trend means longer vacancies and softer asking-rent achievability than the comps imply.
- What's the recent tenant-quality profile in this submarket — average credit score on applications, eviction rate, late-payment / NSF rate, and stable-employment percentage? A property-management company in the area should have these aggregated.
- How much new for-sale + rental construction is in the pipeline within 1–3 miles? Heavy new supply typically softens prices + rents 12–24 months out; constrained supply supports both.
Investment metrics
- 1% rule
- 2.19% ✓
- Cap rate
- 18.80%
- Cash-on-cash
- 44.65%
- DSCR
- 2.99
- GRM
- 3.8
CMA / ARV
- ARV (median comp)
- $134,965
- List price
- $114,900
- Delta
- -14.87%
- Verdict
- UNDERPRICED
- Comps
- 20 within 1.0 mi
Show comp detail 12 sales within ~0.75 mi
| Address | Dist | Beds/Ba | Sqft | Sold | Price | $/sf | Match |
|---|---|---|---|---|---|---|---|
| 201 Union Ave SE #249 | 0.00mi | 2/2.0 | 1,344 (0%) | 4mo | $185,500 | $138 | 97 |
| 201 Union Ave SE #155 | 0.00mi | 2/2.0 | 1,248 (-7%) | 1mo | $175,000 | $140 | 87 |
| 201 Union Ave SE #112 | 0.22mi | 2/2.0 | 1,339 (-0%) | 2mo | $86,000 | $64 | 87 |
| 201 Union Ave SE #247 | 0.22mi | 2/2.0 | 1,344 (0%) | 6mo | $175,000 | $130 | 85 |
| 201 Union Ave SE #74 | 0.00mi | 2/2.0 | 1,440 (+7%) | 5mo | $181,500 | $126 | 84 |
| 375 Union Ave SE #136 | 0.25mi | 3/2.0 (+1) | 1,344 (0%) | 0mo | $192,448 | $143 | 83 |
| 201 Union Ave SE #217 | 0.22mi | 2/2.0 | 1,248 (-7%) | 2mo | $110,000 | $88 | 76 |
| 201 Union Ave SE #157 | 0.00mi | 3/2.0 (+1) | 1,440 (+7%) | 8mo | $140,000 | $97 | 76 |
| 375 Union Ave SE #61 | 0.38mi | 2/2.0 | 1,300 (-3%) | 4mo | $180,000 | $138 | 73 |
| 201 Union Ave SE #147 | 0.17mi | 2/2.0 | 1,536 (+14%) | 2mo | $100,000 | $65 | 66 |
| 201 Union Ave SE #128 | 0.18mi | 2/2.0 | 1,536 (+14%) | 8mo | $75,000 | $49 | 61 |
| 201 Union Ave SE #58 | 0.17mi | 3/2.0 (+1) | 1,536 (+14%) | 9mo | $130,000 | $85 | 56 |
Match score weights: distance 35% · size 25% · config 20% · recency 20%. Top-matched comps best support the ARV.
Projected returns pro-forma
-3.0% appreciation · 0.29% rent growth · sell at horizon
- IRR
- 38.6%
- Equity multiple
- 2.58×
- Total profit
- $50,976
- Equity at exit
- $17,132
- IRR
- 43.7%
- Equity multiple
- 4.63×
- Total profit
- $116,715
- Equity at exit
- $9,934
Cash invested: $32,172 (down + closing). Projections, not guarantees.
Landlord ↔ Tenant lean methodology
- Overall (STATE)
- 28 Tenant-Leaning
- State Washington
- 28 Tenant-Leaning · D+8
- County
- — inherits STATE
- City
- — inherits STATE
ZIP-level market 98059
- Rents YoY
- 0.3%
- Active inventory
- 255
- Price-to-rent
- 3.8×
Monthly cashflow live
- Estimated rent
- $2,521 high interval (Pro) →
- Mortgage (P&I)
- −$603
- Tax est. 1.5%
- −$144 /mo · $1,724/yr
- Insurance
- −$48
- HOA
- −$0
- Vacancy / Maint / Mgmt
- −$529
- Net cashflow
- $1,197
Break-even live
Sensitivity live
| Price | -10% $1,277 | -5% $1,237 | +0% $1,197 | +5% $1,157 | +10% $1,118 |
|---|---|---|---|---|---|
| Rent | -10% $998 | -5% $1,098 | +0% $1,197 | +5% $1,297 | +10% $1,396 |
| Rate | -1.0pp $1,255 | -0.5pp $1,226 | base $1,197 | +0.5pp $1,167 | +1.0pp $1,137 |
UW: 25.0% down · 7.5% · 30yr · 1.5% tax · 5.0% vac · 8.0% maint · 8.0% mgmt
Financing live
Cash to close
- Down payment
- $28,725
- Closing costs
- $3,447
- Reserves months
- —
- Total cash needed
- —
Loan-product check · same deal, 3 products live
Conventional
25% down · 7.5% · 30yr
- Down + closing
- —
- Monthly P&I
- —
- Monthly cashflow
- —
- DSCR
- —
- Eligible?
- —
Personal DTI + credit; lowest rate.
DSCR
20% down · 8.5% · 30yr
- Down + closing
- —
- Monthly P&I
- —
- Monthly cashflow
- —
- DSCR
- —
- Eligible?
- —
No personal income docs; deal must DSCR.
Hard money
10% down · 12.0% · 12mo
- Down + closing
- —
- Monthly P&I
- —
- Monthly cashflow
- —
- DSCR
- —
- Eligible?
- —
Short-term bridge; refi at stabilization.
Rent comps 33 comps
| Address | Beds | Baths | Sqft | Rent | $/sqft | DOM | Units | Dist |
|---|---|---|---|---|---|---|---|---|
| 3815 NE 4th St Renton, WA | 2.0 | 1.0 | 666 | $1,999 | $3.00 | 0d | 23 | 0.25mi |
| 4214 SE 1st Pl Renton, WA | 3.0 | 1.0 | 950 | $2,950 | $3.11 | 25d | 1 | 0.26mi |
| 4231 NE 5th St Unit D203 Renton, WA | 2.0 | 2.0 | 1025 | $2,200 | $2.15 | 12d | 1 | 0.51mi |
| 4319 NE 5th Ct #106 Renton, WA | 2.0 | 2.0 | 1090 | $2,250 | $2.06 | 0d | 1 | 0.61mi |
| 4310 NE 5th Ct #104 Renton, WA | 1.0 | 1.0 | 920 | $2,150 | $2.34 | 0d | 1 | 0.62mi |
| 4415 NE 5th St Renton, WA | 1.0–3.0 | 1.0–2.0 | 923 | $2,370 | $2.57 | 0d | 10 | 0.63mi |
| 650 Duvall Ave NE Renton, WA | 1.0–3.0 | 1.0–3.0 | 1020 | $2,454 | $2.40 | 0d | 13 | 0.84mi |
| 3507 NE 8th St Renton, WA | 3.0 | 1.0 | 960 | $2,650 | $2.76 | 19d | 1 | 0.86mi |
| 5027 NE 5th Pl Renton, WA | 3.0 | 2.5 | 1287 | $3,300 | $2.56 | 25d | 1 | 0.88mi |
| 2511 NE 4th St Renton, WA | 2.0 | 1.5 | 1008 | $1,900 | $1.88 | 4d | 1 | 0.89mi |
| 2307 NE 4th St Renton, WA | 1.0–2.0 | 1.0–2.0 | 740 | $2,207 | $2.98 | 0d | 11 | 0.94mi |
| 2904 SE 8th St #2128 Renton, WA | 2.0 | 2.0 | 1046 | $2,350 | $2.25 | 0d | 1 | 0.95mi |
| 5415 NE 4th St Renton, WA | 2.0 | 2.0 | 1810 | $2,650 | $1.46 | 45d | 1 | 1.01mi |
| 14051 145th Ave SE Renton, WA | 3.0 | 2.0 | 1548 | $3,050 | $1.97 | 0d | 1 | 1.08mi |
| 950 Harrington Ave NE Renton, WA | 1.0–2.0 | 1.0–2.0 | 882 | $2,854 | $3.24 | 0d | 9 | 1.15mi |
| 270 Bronson Way NE Unit The Hampton H22 Renton, WA | 2.0 | 1.0 | 1000 | $2,250 | $2.25 | 45d | 1 | 1.16mi |
| 15205 140th Way SE Renton, WA | 1.0–3.0 | 1.0–2.0 | 1121 | $2,918 | $2.60 | 0d | 10 | 1.21mi |
| 1064 Kirkland Ave NE Unit 101 Renton, WA | 2.0 | 1.0 | 975 | $1,850 | $1.90 | 0d | 1 | 1.26mi |
| 1064 Kirkland Ave NE Renton, WA | 1.0–2.0 | 1.0 | 827 | $1,850 | $2.24 | 0d | 1 | 1.26mi |
| 2715 Sunset Ln NE Renton, WA | 1.0–2.0 | 1.0–2.0 | 922 | $3,131 | $3.39 | 0d | 7 | 1.27mi |
| 2227 SE 8th Pl Renton, WA | 3.0 | 2.0 | 1560 | $3,650 | $2.34 | 5d | 1 | 1.29mi |
| 3109 NE 11th Pl Unit 3109D Renton, WA | 2.0 | 1.5 | 1186 | $2,525 | $2.13 | 5d | 1 | 1.32mi |
| 2100 NE 6th Pl Renton, WA | 3.0 | 1.0 | 1000 | $2,650 | $2.65 | 45d | 1 | 1.34mi |
| 2950 NE 11th St Renton, WA | 1.0–2.0 | 1.0–2.5 | 1050 | $3,937 | $3.75 | 0d | 16 | 1.35mi |
| 1201 Anacortes Ave NE Renton, WA | 2.0 | 1.0 | 908 | $2,095 | $2.31 | 4d | 2 | 1.36mi |
| 1930 NE 7th Ct Renton, WA | 3.0 | 2.5 | 1742 | $3,450 | $1.98 | 0d | 1 | 1.44mi |
| 825 Sunset Blvd NE Unit B-1 Renton, WA | 2.0 | 2.5 | 1150 | $2,650 | $2.30 | 14d | 1 | 1.47mi |
| 4400 NE Sunset Blvd Renton, WA | 2.0 | 1.0 | 950 | $2,275 | $2.39 | 0d | 3 | 1.48mi |
| 1150 Sunset Blvd NE Renton, WA | 1.0–2.0 | 1.0 | 762 | $1,795 | $2.36 | 4d | 2 | 1.49mi |
| 1150 Sunset Blvd NE Renton, WA | 2.0 | 1.0 | 891 | $1,858 | $2.08 | 21d | 2 | 1.49mi |
| 1150 Sunset Blvd NE Renton, WA | 1.0–2.0 | 1.0 | 762 | $1,920 | $2.52 | 11d | 4 | 1.49mi |
| 1177 Harrington Ave NE Renton, WA | 2.0 | 1.5 | 950 | $1,975 | $2.08 | 6d | 1 | 1.49mi |
| 1177 Harrington Ave NE Unit 305 Renton, WA | 2.0 | 1.5 | 950 | $1,975 | $2.08 | 21d | 1 | 1.49mi |
Listing history 18 events
-
2026-06-21days on market $114,900 Active 76 DOM
-
2026-06-18days on market $114,900 Active 73 DOM
-
2026-06-17days on market $114,900 Active 72 DOM
-
2026-06-16days on market $114,900 Active 71 DOM
-
2026-06-15days on market $114,900 Active 70 DOM
-
2026-06-13days on market $114,900 Active 68 DOM
-
2026-06-13pricedays on market $114,900 Active 67 DOM
-
2026-06-09days on market $119,900 Active 64 DOM
-
2026-06-08days on market $119,900 Active 63 DOM
-
2026-06-07days on market $119,900 Active 62 DOM
-
2026-06-04days on market $119,900 Active 59 DOM
-
2026-06-03days on market $119,900 Active 58 DOM
-
2026-06-02days on market $119,900 Active 57 DOM
-
2026-06-01days on market $119,900 Active 56 DOM
-
2026-05-31days on market $119,900 Active 55 DOM
-
2026-04-06$119,900 Active
-
2005-11-10soldstatus $60,000
-
2005-09-26$62,990
ⓘ Source: listings_history table (triggers on properties + properties_extension) + one-shot
backfill from property_details.listing_events for pre-trigger history.
Climate risk First Street
- Flood 1/10 Low FEMA zone X (unshaded) · 0% chance over 30 yrs
- Wildfire 1/10 Low
- Heat 3/10 Moderate 7 d/yr ≥86°F today · 15 d/yr by 30 yrs out
- Wind 1/10 Low
- Air quality 7/10 Severe 10 unhealthy d/yr today · 11 by 30 yrs out
Nearby sold comps map
Loading sold comps map…
Walkable amenities ~0.75 mi
Loading nearby amenities…
Taxation est. · year 1
- Rental income
- $30,246
- − Mortgage interest
- −$6,436
- − Property taxes
- −$1,724
- − Insurance
- −$574
- − Repairs & maintenance
- −$2,420
- − Management
- −$2,420
- − Depreciation
- −$3,343
- Taxable income
- $13,330
- Est. tax owed @ 24.0%
- −$3,199
- After-tax cash flow
- $11,167/yr
For passive investors: Depreciation is non-cash, so a rental often shows a tax loss while cash-flowing — sheltering income. Rental losses are passive: they offset passive income freely, and up to $25,000/yr can offset ordinary (W-2) income if you actively participate and your MAGI is under $100k (phasing out to $0 by $150k); unused losses carry forward. On sale, claimed depreciation is recaptured at up to 25%, and gains may owe capital-gains tax (a 1031 exchange can defer both). Figures are a year-1 estimate at your 24.0% rate — not tax advice; consult a CPA.
Condition & rehab AI · 12 photos
This well-maintained, 1344 square foot manufactured home in Leisure Estates offers a good condition with recent updates and a good curb appeal.
Value-add opportunities
- Both paint exterior — enhances curb appeal and resale value
- Both replace sliding glass doors — improves functionality and resale value
Renovation cost estimate screening
Value-add ROI direction
- Both paint exterior — enhances curb appeal and resale value ↑
- Both replace sliding glass doors — improves functionality and resale value ↑
ⓘ Cost ranges are severity-bucket heuristics (US national rule-of-thumb). Get contractor quotes + a written scope before underwriting a rehab budget.
Schools (NCES district)
- District
- Renton School District
- NCES district ID
- 5307230
- Math proficiency
- 47% ▼ -1.00%
- Reading proficiency
- 55% ▼ -1.00%
- Median HH income
- $66,354
- Composite
- 47.13/100
- National rank
- #5108
- State rank
- #119 of 291 in WA
Livability — Renton
- Score
- 83/100
- State rank
- #52
- US rank
- #949
Category grades
Schools grade is shown separately in the Schools card above.
Census & demographics
- Census place
- Renton, WA
- County
- King County · 2,251,916 people
- City population
- 158,600
- Metro
- Seattle-Tacoma-Bellevue, WA
- Population (ZIP)
- 42,406
- Household income
- $138,654
- Rent vs Own
- Severe rent burden
- 908.0
Population outlook (King County) Hauer SSP2
- Today (2025)
- 2,576,485 people
- By 2030
- 2,803,316 · +8.8%
- By 2040
- 3,255,921 · +26.4%
- By 2050
- 3,706,444 · +43.9%
- By 2075
- 4,746,063 · +84.2%
- By 2100
- 5,407,730 · +109.9%
Race, ethnicity, and origin ACS 2023
- Neighborhood character
- Diverse neighborhood (Simpson 0.68)
- Race & ethnicity
- White 48% Asian 29% Two or more races 15% Hispanic / Latino 9% Black 2%
- Hispanic origin (detail)
- Mexican 5%
- Common ancestry
- Portuguese 3% Italian 3% Slovak 2%
- Foreign-born
- 23% · China, Vietnam, Canada
- Languages at home
- 67% English-only · Chinese 9% Vietnamese 6% Spanish 5%
Political lean MEDSL · King
- 2024 margin
- Solid D (+51.7) · D 74.2% · R 22.5% · Other 3.4%
- 2008→2024 swing
- +9.6pp toward D · 2008: 42.1pp · 2024: 51.7pp
- All cycles
- 2024: D+51.7 2020: D+52.7 2016: D+50.4 2012: D+39.9 2008: D+42.1
Not yet ingested
- Civics
- —
Market trends
- HPI YoY
- ▼ -920.66%
- Current HPI
- 338.4495
- Rent YoY
- ▲ 0.29%
- Metro
- Seattle-Tacoma-Bellevue, WA
- State GDP YoY
- ▲ 4.65%
- F500 in state
- 22
Industry mix (Fortune 500 HQ in WA)
| Industry | F500 HQs | Revenue |
|---|---|---|
| Retail | 2 | $269B |
|
||
| Technology / Retail | 1 | $638B |
|
||
| Technology | 1 | $245B |
|
||
| Telecommunications | 1 | $38B |
|
||
| Food / Beverage | 1 | $36B |
|
||
| Automotive / Trucks | 1 | $34B |
|
||
Price history
+90.3% since first listed3 events — show timeline
- 2026-04-06 Listed $119,900 NWMLS as Distributed by MLS Grid
- 2005-11-10 Sold (MLS) $60,000 NWMLS as Distributed by MLS Grid
- 2005-09-26 Listed $62,990 NWMLS as Distributed by MLS Grid
Cash-flow waterfall
monthlySold comps — $/sqft
last 12 mo · ≤1 miLoading sold comps…