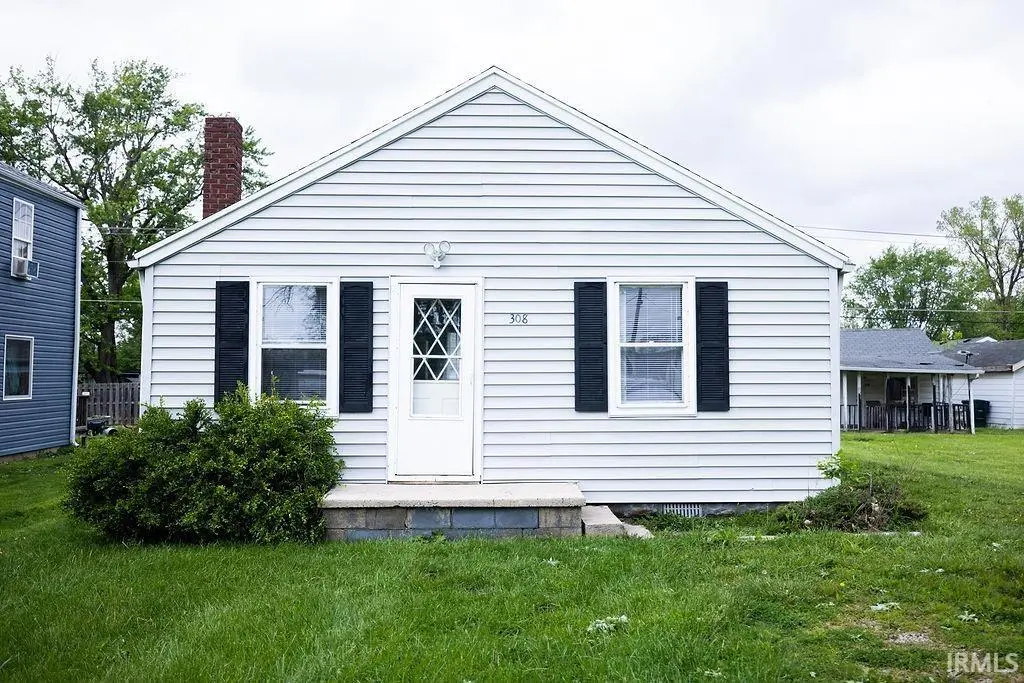
308 E Berkley Ave · Muncie, IN
Flood risk 1/10 · Minimal
- FEMA flood zone
- X (unshaded)
- Chance of flooding over 30 yrs
- 0.0%
- Est. flood insurance / yr
- $507 – $1,088
Fire risk 1/10 · Minimal
- Est. fire insurance / yr
- $717 – $1,331
Heat risk 3/10 · Minor
- Hot days now (above 100°F)
- 7 days/yr
- Hot days in 30 yrs
- 18 days/yr
Wind risk 2/10 · Minimal
- Chance of severe wind over 30 yrs
- 0.0%
Air-quality risk 3/10 · Minor
- Unhealthy air days now
- 2 days/yr
- Unhealthy air days in 30 yrs
- 3 days/yr
Risk factors via First Street. Map © Google.
Why this score? — see what drove the C- grade
The composite is a weighted blend of 9 inputs, each scored 0–100. Each bar is that input's sub-score; the figure is the points it added to the 100-point composite (weight × sub-score).
- Cash flow +23.6/30.0
- DSCR +7.6/10.0
- 1% rule +5.5/10.0
- Rent growth +4.5/5.0
- Livability +4.0/5.0
- Condition / age +2.5/5.0
- Schools +1.7/10.0
- ARV discount +1.4/15.0
- Appreciation +0.0/10.0
$89,900
🖨 Deal sheet (PDF) 📄 Offer letter ✓ Due diligence
Listing remarks MLS
CUTE 2 BEDROOM HOME WITH DETACHED GARAGE. NEEDS FURNACE & WATER HEATER. AS IS. PRE-APPROVAL OR PROOF OF CASH FUNDS W/ALL OFFERS.
Key facts
- New water heater
- Gas heat
- Refrigerator
Tags
Property features AI
Finance
- Other: Directions: turn off of McGalliard onto Jefferson St, then onto Berkley until arrival
- HOA & community: No association amenities; Subdivision: Fairfax
Exterior
- Parking: Detached off-street garage with 2 spaces
- Utilities: Public water; Public sewer
- Home design: Single-family residence (site-built); One story; Vinyl siding
- Construction: Asphalt roof
- Exterior features: Level lot; Publicly maintained road; No fencing
Interior
- Kitchen: Refrigerator; Gas range
- Bathrooms: 1 full bathroom (main level)
- Heating & cooling: Natural gas heating; Central air conditioning
- Interior features: 6 total rooms; Crawl space basement; 1 fireplace
- Laundry & utility: Laundry on main level
Neighborhood map
What this means for you Summary
Snapshot
- This is a 2-bed/1.0-bath single-family listed at $90k.
Deal economics
- At list price, monthly cash flow is $170 ($2k/yr) — positive.
- The deal already cash-flows at list — no discount required.
- Meets the 1% rule at list price ($941 rent vs $90k).
- Recommended offer: $87k (3.0% below list) — sets the bar for market timing.
- Cap rate 8.6% vs local median 6.0% in Muncie — top-decile yield for the area; either an underpriced asset or a hidden risk that comps aren't pricing in. Stress-test before assuming the spread holds.
Location & tenants
- Location reads 80/100 on livability (#18 in IN, #1,654 nationally) — a professional / high-income tenant draw. Strengths: amenities A+, commute A+, cost of living A+; Watch: crime F, employment F.
- Muncie Community Schools (urban): math 18% / reading 25% proficiency, ranked #275 of 301 in IN (top 91%) — low school quality limits family demand, transient renter base, plan for 1-2y turnover; 68% free/reduced lunch — lower-income household profile, screen leases tightly.
- Zoned schools: Longfellow Elementary School (math 17% / reading 12%, grade F, #862 of 994 statewide, top 88%, 324 students, 86% FRL); Northside Middle School (math 17% / reading 36%, grade F, #236 of 330 statewide, top 72%, 583 students, 70% FRL).
- Market conditions: Rents rising fast (+7.8%/yr); 112 active listings in the ZIP; 10 comparable units currently listed for rent nearby; rentals lingering (median 44d on market — plan ~5-8 weeks vacancy on turnover, expect pricing pressure); 100% of comp listings sitting > 30 days — soft ceiling on asking rent; 171 units permitted in Delaware County in 2024 (57 in 5+ unit buildings).
Forward outlook
- Local home prices are declining (-3.0%/yr); year-one equity from $622 of loan paydown is wiped out by about $3k of value loss. Plan a longer hold.
- Delaware County population projected at -11% by 2050 — secular population decline; favor cash flow + early exit over multi-decade hold.
- At projected returns (-3.0% appreciation + 7.8% rent growth), your $25k cash investment doubles in ~8 years — after that, you're playing with house money.
Negotiation context
- It's been on market 39 days — a 3% lower offer ($87k) is reasonable based on typical stale-listing flexibility.
- 3 sale attempts since 19y ago; this cycle's ask has dropped $5k (5%) from the opening price — seller is motivated, your offer sets the floor, not the list.
- Current owner paid $30k; list at $90k implies a 200% gain — meaningful room to come down on a strong offer.
Risks & watch-outs
- Watch-outs: built in 1938 — expect roof / HVAC / electrical / plumbing capex.
Questions for the listing agent
- It's been on market 39 days. Have you received any prior offers? Is the seller open to a 3% concession, seller financing, or rate buy-down credit?
- Built in 1938 — when were the roof, HVAC, electrical panel, plumbing, and water heater last replaced?
- Is there a deadline driving the sale (1031 exchange, divorce, estate, relocation)? That informs how much negotiation room exists.
- Schools are D-rated, which usually means shorter tenancies and higher turnover. Who's the typical renter profile here, and what's been the actual vacancy rate?
- Crime grade is F in this area — have there been break-ins, vandalism, or insurance claims at this property in the last 3 years? What carrier currently insures it and at what premium?
- What's the average days-on-market for RENTAL listings here right now (not sales)? A rising rental-DOM trend means longer vacancies and softer asking-rent achievability than the comps imply.
- What's the recent tenant-quality profile in this submarket — average credit score on applications, eviction rate, late-payment / NSF rate, and stable-employment percentage? A property-management company in the area should have these aggregated.
- How much new for-sale + rental construction is in the pipeline within 1–3 miles? Heavy new supply typically softens prices + rents 12–24 months out; constrained supply supports both.
Investment metrics
- 1% rule
- 1.05% ✓
- Cap rate
- 8.56%
- Cash-on-cash
- 8.10%
- DSCR
- 1.36
- GRM
- 8.0
CMA / ARV
- ARV (median comp)
- $79,220
- List price
- $89,900
- Delta
- 13.48%
- Verdict
- OVERPRICED
- Comps
- 20 within 1.0 mi
Show comp detail 1 sale within ~0.75 mi
| Address | Dist | Beds/Ba | Sqft | Sold | Price | $/sf | Match |
|---|---|---|---|---|---|---|---|
| 116 E Andover Ave | 0.12mi | 2/1.0 | 624 (0%) | 2mo | $85,000 | $136 | 93 |
Match score weights: distance 35% · size 25% · config 20% · recency 20%. Top-matched comps best support the ARV.
Projected returns pro-forma
-3.0% appreciation · 7.8% rent growth · sell at horizon
- IRR
- 1.0%
- Equity multiple
- 1.04×
- Total profit
- $1,001
- Equity at exit
- $13,404
- IRR
- 14.7%
- Equity multiple
- 2.44×
- Total profit
- $36,344
- Equity at exit
- $7,773
Cash invested: $25,172 (down + closing). Projections, not guarantees.
Landlord ↔ Tenant lean methodology
- Overall (STATE)
- 90 Strongly Landlord-Friendly
- State Indiana
- 90 Strongly Landlord-Friendly · R+11
- County
- — inherits STATE
- City
- — inherits STATE
ZIP-level market 47303
- Home prices YoY
- -18.0%
- Rents YoY
- 7.8%
- Active inventory
- 112
- Price-to-rent
- 8.0×
Monthly cashflow live
- Estimated rent
- $941 high interval (Pro) →
- Mortgage (P&I)
- −$471
- Tax from tax record
- −$65 /mo · $780/yr
- Insurance
- −$37
- HOA
- −$0
- Vacancy / Maint / Mgmt
- −$198
- Net cashflow
- $170
Break-even live
Sensitivity live
| Price | -10% $221 | -5% $195 | +0% $170 | +5% $144 | +10% $119 |
|---|---|---|---|---|---|
| Rent | -10% $95 | -5% $133 | +0% $170 | +5% $207 | +10% $244 |
| Rate | -1.0pp $215 | -0.5pp $193 | base $170 | +0.5pp $147 | +1.0pp $123 |
UW: 25.0% down · 7.5% · 30yr · 1.5% tax · 5.0% vac · 8.0% maint · 8.0% mgmt
Financing live
Cash to close
- Down payment
- $22,475
- Closing costs
- $2,697
- Reserves months
- —
- Total cash needed
- —
Loan-product check · same deal, 3 products live
Conventional
25% down · 7.5% · 30yr
- Down + closing
- —
- Monthly P&I
- —
- Monthly cashflow
- —
- DSCR
- —
- Eligible?
- —
Personal DTI + credit; lowest rate.
DSCR
20% down · 8.5% · 30yr
- Down + closing
- —
- Monthly P&I
- —
- Monthly cashflow
- —
- DSCR
- —
- Eligible?
- —
No personal income docs; deal must DSCR.
Hard money
10% down · 12.0% · 12mo
- Down + closing
- —
- Monthly P&I
- —
- Monthly cashflow
- —
- DSCR
- —
- Eligible?
- —
Short-term bridge; refi at stabilization.
Rent comps 10 comps
| Address | Beds | Baths | Sqft | Rent | $/sqft | DOM | Units | Dist |
|---|---|---|---|---|---|---|---|---|
| 125 E Oldfield Ln Muncie, IN | 1.0–3.0 | 1.0–2.0 | 886 | $1,112 | $1.26 | 44d | 7 | 0.18mi |
| 4000 N Walnut St Muncie, IN | 1.0–3.0 | 1.0 | 880 | $964 | $1.10 | 44d | 5 | 0.36mi |
| 111 E Streeter Ave Muncie, IN | 2.0–3.0 | 1.0 | 816 | $799 | $0.98 | 44d | 3 | 0.51mi |
| 151 E Streeter Ave Unit 2 Bedroom Apartment Muncie, IN | 2.0 | 1.0 | 750 | $692 | $0.92 | 44d | 1 | 0.56mi |
| 1010 W Bethel Ave Muncie, IN | 1.0 | 1.0 | 700 | $874 | $1.25 | 44d | 13 | 1.16mi |
| 1204 W Bethel Ave Muncie, IN | 1.0 | 1.0 | 504 | $795 | $1.58 | 44d | 14 | 1.20mi |
| 1000 W Rex St Unit 1000 Muncie, IN | 1.0 | 1.0 | 480 | $790 | $1.65 | 44d | 1 | 1.26mi |
| 1701 N Rosewood Ave Muncie, IN | 2.0 | 1.0 | 750 | $1,405 | $1.87 | 44d | 1 | 1.40mi |
| 824 W Wayne St Muncie, IN | 1.0 | 1.0 | 710 | $795 | $1.12 | 44d | 1 | 1.42mi |
| 920 N Linden St Muncie, IN | 2.0 | 1.0 | 745 | $925 | $1.24 | 44d | 1 | 1.46mi |
Listing history 17 events
-
2026-06-10status $89,900 Pending 39 DOM
-
2026-06-09days on market $89,900 Active 39 DOM
-
2026-06-08days on market $89,900 Active 38 DOM
-
2026-06-07days on market $89,900 Active 37 DOM
-
2026-06-05days on market $89,900 Active 34 DOM
-
2026-06-03days on market $89,900 Active 33 DOM
-
2026-06-02days on market $89,900 Active 32 DOM
-
2026-06-01days on market $89,900 Active 31 DOM
-
2026-05-31days on market $89,900 Active 30 DOM
-
2026-05-30days on market $89,900 Active 29 DOM
-
2026-05-01$94,900 Active 398-char remark
-
2024-09-17soldstatus $30,000
-
2024-02-05historical $780
-
2023-12-15price $780
-
2023-11-02$800
-
2007-08-30soldstatus $25,000 132-char remark
Show marketing remark (132 chars)
CUTE 2 BEDROOM HOME WITH DETACHED GARAGE. NEEDS FURNACE & WATER HEATER. AS IS. PRE-APPROVAL OR PROOF OF CASH FUNDS W/ALL OFFERS.
-
2007-07-02$34,900 132-char remark
Show marketing remark (132 chars)
CUTE 2 BEDROOM HOME WITH DETACHED GARAGE. NEEDS FURNACE & WATER HEATER. AS IS. PRE-APPROVAL OR PROOF OF CASH FUNDS W/ALL OFFERS.
ⓘ Source: listings_history table (triggers on properties + properties_extension) + one-shot
backfill from property_details.listing_events for pre-trigger history.
Tax reassessment forecast IN · Partial reset (capped growth)
- Current annual tax
- $780 · $65/mo
- Projected year-2 tax
- $780 · $65/mo
- Expected delta
- $0/yr ($0/mo · 0.0%)
ⓘ Screening estimate from a state-policy table — verify with the county assessor before closing.
Climate risk First Street
- Flood 1/10 Low FEMA zone X (unshaded) · 0% chance over 30 yrs
- Wildfire 1/10 Low
- Heat 3/10 Moderate 7 d/yr ≥100°F today · 18 d/yr by 30 yrs out
- Wind 2/10 Low 0% chance of damaging wind over 30 yrs
- Air quality 3/10 Moderate 2 unhealthy d/yr today · 3 by 30 yrs out
Nearby sold comps map
Loading sold comps map…
Walkable amenities ~0.75 mi
Loading nearby amenities…
Taxation est. · year 1
- Rental income
- $11,297
- − Mortgage interest
- −$5,036
- − Property taxes
- −$780
- − Insurance
- −$450
- − Repairs & maintenance
- −$904
- − Management
- −$904
- − Depreciation
- −$2,615
- Taxable income
- $609
- Est. tax owed @ 24.0%
- −$146
- After-tax cash flow
- $1,892/yr
For passive investors: Depreciation is non-cash, so a rental often shows a tax loss while cash-flowing — sheltering income. Rental losses are passive: they offset passive income freely, and up to $25,000/yr can offset ordinary (W-2) income if you actively participate and your MAGI is under $100k (phasing out to $0 by $150k); unused losses carry forward. On sale, claimed depreciation is recaptured at up to 25%, and gains may owe capital-gains tax (a 1031 exchange can defer both). Figures are a year-1 estimate at your 24.0% rate — not tax advice; consult a CPA.
Schools (NCES district)
- District
- Muncie Community Schools
- NCES district ID
- 1807320
- Math proficiency
- 18% ▼ -9.00%
- Reading proficiency
- 25% ▼ -4.00%
- Median HH income
- $30,052
- Composite
- 17.22/100
- National rank
- #9099
- State rank
- #275 of 301 in IN
Livability — Muncie
- Score
- 80/100
- State rank
- #18
- US rank
- #1654
Category grades
Schools grade is shown separately in the Schools card above.
Census & demographics
- Census place
- Muncie, IN
- County
- Delaware County · 84,658 people
- City population
- 84,658
- Metro
- Muncie, IN
- Population (ZIP)
- 24,392
- Household income
- $47,674
- Rent vs Own
- Severe rent burden
- 1434.0
Population outlook (Delaware County) Hauer SSP2
- Today (2025)
- 113,036 people
- By 2030
- 111,313 · -1.5%
- By 2040
- 106,432 · -5.8%
- By 2050
- 100,747 · -10.9%
- By 2075
- 91,000 · -19.5%
- By 2100
- 80,687 · -28.6%
Race, ethnicity, and origin ACS 2023
- Neighborhood character
- Predominantly White (82%)
- Race & ethnicity
- White 82% Black 9% Two or more races 5% Hispanic / Latino 3%
- Common ancestry
- Italian 4% Slovak 3% Lithuanian 2%
- Foreign-born
- 2% · Canada
- Languages at home
- 97% English-only · Spanish 1%
Political lean MEDSL · Delaware
- 2024 margin
- R (+15.8) · D 41.2% · R 57.0% · Other 1.8%
- 2008→2024 swing
- -30.8pp toward R · 2008: 15.0pp · 2024: -15.8pp
- All cycles
- 2024: R+15.8 2020: R+13.2 2016: R+13.7 2012: D+3.1 2008: D+15.0
Not yet ingested
- Civics
- —
Market trends
- HPI YoY
- ▼ -50.45%
- Current HPI
- 229.8654
- Rent YoY
- ▲ 7.80%
- Metro
- Muncie, IN
- State GDP YoY
- ▲ 2.90%
- F500 in state
- 18
Industry mix (Fortune 500 HQ in IN)
| Industry | F500 HQs | Revenue |
|---|---|---|
| Industrial Machinery | 2 | $37B |
|
||
| Healthcare | 1 | $177B |
|
||
| Pharmaceuticals | 1 | $45B |
|
||
| Metals / Steel | 1 | $18B |
|
||
| Agriculture | 1 | $17B |
|
||
| Packaging | 1 | $12B |
|
||
Price history
+157.6% since first listed9 events — show timeline
- 2026-06-09 Pending — IRMLS
- 2026-05-21 Price Changed $89,900 IRMLS
- 2026-05-01 Listed $94,900 IRMLS
- 2024-09-17 Sold (Public Records) $30,000 Public Records
- 2024-02-05 Rental Removed $780 APPFOLIO
- 2023-12-15 Price Changed $780 APPFOLIO
- 2023-11-02 Listed for Rent $800 APPFOLIO
- 2007-08-30 Sold (MLS) $25,000 MIBOR as Distributed by MLS Grid
- 2007-07-02 Listed $34,900 MIBOR as Distributed by MLS Grid
Property tax history
-6.5%/yrLatest (2024): $780 · -0.0% YoY. Source: county tax records.
Cash-flow waterfall
monthlySold comps — $/sqft
last 12 mo · ≤1 miLoading sold comps…