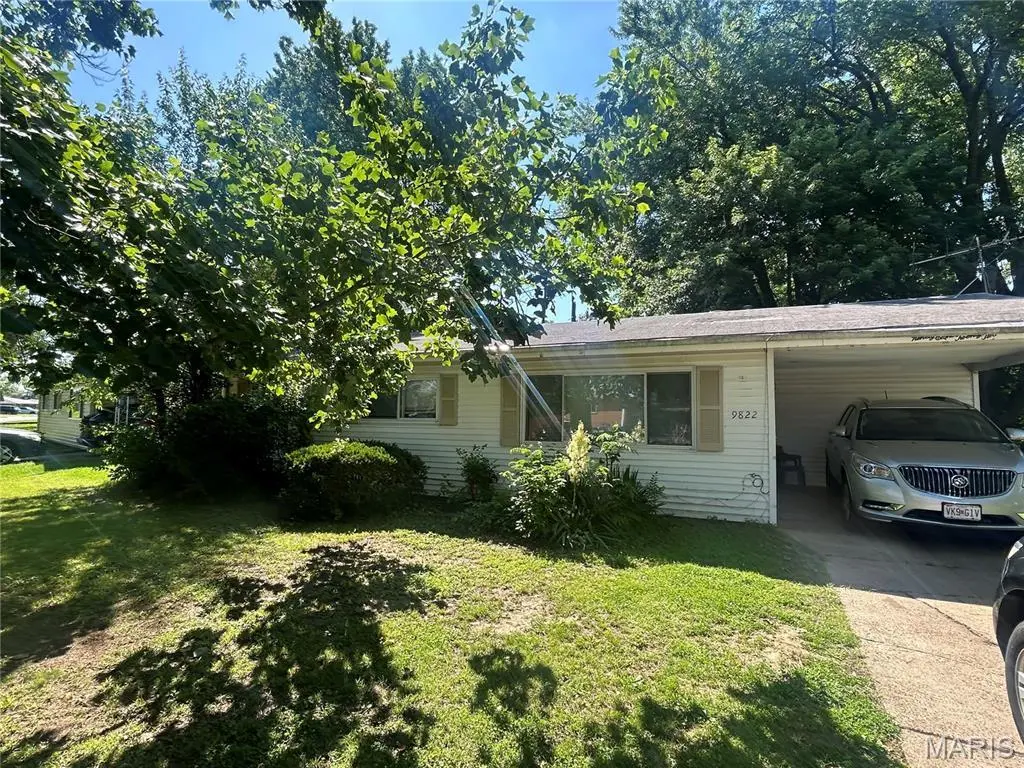
9822 Treadway Ln · Edmundson, MO
Flood risk 1/10 · Minimal
- FEMA flood zone
- X (unshaded)
- Chance of flooding over 30 yrs
- 0.0%
- Est. flood insurance / yr
- $507 – $1,088
Fire risk 1/10 · Minimal
- Est. fire insurance / yr
- $1,054 – $1,958
Heat risk 4/10 · Minor
- Hot days now (above 105°F)
- 7 days/yr
- Hot days in 30 yrs
- 21 days/yr
Wind risk 2/10 · Minimal
- Chance of severe wind over 30 yrs
- 1.0%
Air-quality risk 2/10 · Minimal
- Unhealthy air days now
- 1 days/yr
- Unhealthy air days in 30 yrs
- 3 days/yr
Risk factors via First Street. Map © Google.
Why this score? — see what drove the C+ grade
The composite is a weighted blend of 9 inputs, each scored 0–100. Each bar is that input's sub-score; the figure is the points it added to the 100-point composite (weight × sub-score).
- Cash flow +24.3/30.0
- ARV discount +14.6/15.0
- DSCR +7.8/10.0
- 1% rule +5.6/10.0
- Livability +3.2/5.0
- Rent growth +2.9/5.0
- Condition / age +2.5/5.0
- Schools +1.7/10.0
- Appreciation +0.0/10.0
$130,000
🖨 Deal sheet (PDF) 📄 Offer letter ✓ Due diligence
Listing remarks
Turnkey investment opportunity at 9822 Treadway Lane in St. Louis! This well-maintained 3-bedroom, 1-bath single-family home offers 1,008 sq ft of living space and is currently tenant occupied at $1,260/month, providing immediate cash flow for investors. Built in 1960, the property features central cooling, covered carport parking, and sits on a 6,272 sq ft lot. The functional floor plan, low-maintenance layout, and strong rental demand in the area make this an excellent addition to any investment portfolio. Conveniently located near major highways, shopping, schools, and everyday amenities, this property offers easy access for tenants and long-term rental appeal. Whether you're a seasoned
Key facts
- Strong rental demand
- Easy access
- Central cooling
Tags
Property features AI
Exterior
- Parking: Carport (1 space)
- Utilities: Public water; Public sewer; Electric service (other)
- Home design: Single-family residence; One story; Residential property
- Construction: Aluminum siding; Vinyl siding; Built around public records year (assessor source)
- Exterior features: Level lot; Patio
Interior
- Kitchen: Gas range; Refrigerator; Dishwasher
- Bedrooms: 3 bedrooms (all on the main level)
- Flooring: Ceramic tile; Vinyl
- Bathrooms: 1 full bathroom
- Heating & cooling: Natural gas heating; Central air conditioning
- Interior features: Full basement; Patio
- Laundry & utility: Washer; Dryer; Natural gas heating
Neighborhood map
What this means for you Summary
Snapshot
- This is a 3-bed/1.0-bath single-family listed at $130k.
Deal economics
- At list price, monthly cash flow is $262 ($3k/yr) — positive.
- The deal already cash-flows at list — no discount required.
- Meets the 1% rule at list price ($1k rent vs $130k).
- Recommended offer: $128k (1.5% below list) — sets the bar for market timing.
Location & tenants
- Location reads 63/100 on livability (#353 in MO) — a middle-class / working-renter tenant base. Strengths: cost of living A+, commute A-, housing B+; Watch: employment C-, crime F, amenities F.
- Ritenour (suburban): math 13% / reading 27% proficiency, ranked #304 of 324 in MO (top 94%) — low school quality limits family demand, transient renter base, plan for 1-2y turnover; 66% free/reduced lunch — lower-income household profile, screen leases tightly.
- Zoned schools: Kratz Elem. (math 9% / reading 25%, grade F, #967 of 1,115 statewide, top 88%, 538 students, 99% FRL); Ritenour Sr. High (math 9% / reading 36%, grade F, #455 of 521 statewide, top 88%, 1,873 students, 100% FRL) — zoned schools average 100% FRL vs 66% district-wide (34 pts higher); higher-poverty schools than district average — tighter screening recommended.
- Market conditions: Rents rising (+1.6%/yr); 71 active listings in the ZIP; 28 comparable units currently listed for rent nearby; rentals lingering (median 45d on market — plan ~5-8 weeks vacancy on turnover, expect pricing pressure); 50% of comp listings sitting > 30 days — soft ceiling on asking rent; lower-income renter base — watch delinquency; 920 units permitted in St. Louis County in 2024 (250 in 5+ unit buildings).
- This rent runs 37% of the median local income ($45k/yr) — at the standard rent-burdened threshold; future hikes will face affordability resistance.
Forward outlook
- Local home prices are declining (-3.0%/yr); year-one equity from $899 of loan paydown is wiped out by about $4k of value loss. Plan a longer hold.
Negotiation context
- It's been on market 18 days — a 2% lower offer ($128k) is reasonable based on typical stale-listing flexibility.
- Current owner paid $37k; list at $130k implies a 253% gain — meaningful room to come down on a strong offer.
Questions for the listing agent
- Built in 1960 — when were the roof, HVAC, electrical panel, plumbing, and water heater last replaced?
- Is there a deadline driving the sale (1031 exchange, divorce, estate, relocation)? That informs how much negotiation room exists.
- Schools are F-rated, which usually means shorter tenancies and higher turnover. Who's the typical renter profile here, and what's been the actual vacancy rate?
- Crime grade is F in this area — have there been break-ins, vandalism, or insurance claims at this property in the last 3 years? What carrier currently insures it and at what premium?
- What's the average days-on-market for RENTAL listings here right now (not sales)? A rising rental-DOM trend means longer vacancies and softer asking-rent achievability than the comps imply.
- What's the recent tenant-quality profile in this submarket — average credit score on applications, eviction rate, late-payment / NSF rate, and stable-employment percentage? A property-management company in the area should have these aggregated.
- How much new for-sale + rental construction is in the pipeline within 1–3 miles? Heavy new supply typically softens prices + rents 12–24 months out; constrained supply supports both.
Investment metrics
- 1% rule
- 1.06% ✓
- Cap rate
- 8.71%
- Cash-on-cash
- 8.64%
- DSCR
- 1.38
- GRM
- 7.8
CMA / ARV
- ARV (on-the-fly)
- $154,224
- Comps found
- 12
Show comp detail 12 sales within ~0.75 mi
| Address | Dist | Beds/Ba | Sqft | Sold | Price | $/sf | Match |
|---|---|---|---|---|---|---|---|
| 4426 Treadway Ln | 0.07mi | 3/1.0 | 1,008 (0%) | 1mo | $114,900 | $114 | 96 |
| 4411 Edmundson Rd | 0.20mi | 3/1.0 | 1,104 (+10%) | 1mo | $130,000 | $118 | 74 |
| 9513 Margo Ann Ln | 0.49mi | 3/1.0 | 1,008 (0%) | 7mo | $165,000 | $164 | 71 |
| 4423 Dabney Dr | 0.10mi | 3/1.0 | 1,152 (+14%) | 4mo | $109,900 | $95 | 68 |
| 9716 Margo Ann Ln | 0.28mi | 3/1.5 | 1,111 (+10%) | 1mo | $135,000 | $122 | 67 |
| 3959 Sims Ave | 0.42mi | 3/1.0 | 1,040 (+3%) | 11mo | $159,000 | $153 | 66 |
| 9832 Guthrie Ave | 0.45mi | 3/2.0 | 1,050 (+4%) | 7mo | $119,900 | $114 | 62 |
| 4332 Saint Leo Ln | 0.57mi | 3/1.0 | 1,068 (+6%) | 2mo | $170,000 | $159 | 62 |
| 3937 Wright Ave | 0.50mi | 3/1.0 | 1,082 (+7%) | 6mo | $195,000 | $180 | 60 |
| 9406 Bataan Dr | 0.75mi | 3/1.0 | 1,037 (+3%) | 3mo | $175,000 | $169 | 58 |
| 4224 Ashby Rd | 0.72mi | 2/1.5 (-1) | 900 (-11%) | 1mo | $172,500 | $192 | 41 |
| 9448 Harold Dr | 0.73mi | 2/1.0 (-1) | 864 (-14%) | 2mo | $120,000 | $139 | 36 |
Match score weights: distance 35% · size 25% · config 20% · recency 20%. Top-matched comps best support the ARV.
Projected returns pro-forma
-3.0% appreciation · 1.61% rent growth · sell at horizon
- IRR
- -4.7%
- Equity multiple
- 0.83×
- Total profit
- $-6,300
- Equity at exit
- $19,383
- IRR
- 3.4%
- Equity multiple
- 1.23×
- Total profit
- $8,314
- Equity at exit
- $11,240
Cash invested: $36,400 (down + closing). Projections, not guarantees.
Landlord ↔ Tenant lean methodology
- Overall (STATE)
- 81 Strongly Landlord-Friendly
- State Missouri
- 81 Strongly Landlord-Friendly · R+10
- County
- — inherits STATE
- City
- — inherits STATE
ZIP-level market 63134
- Rents YoY
- 1.6%
- Active inventory
- 71
- Price-to-rent
- 7.8×
Monthly cashflow live
- Estimated rent
- $1,383 high interval (Pro) →
- Mortgage (P&I)
- −$682
- Tax from tax record
- −$94 /mo · $1,130/yr
- Insurance
- −$54
- HOA
- −$0
- Vacancy / Maint / Mgmt
- −$290
- Net cashflow
- $262
Break-even live
Sensitivity live
| Price | -10% $336 | -5% $299 | +0% $262 | +5% $225 | +10% $189 |
|---|---|---|---|---|---|
| Rent | -10% $153 | -5% $208 | +0% $262 | +5% $317 | +10% $371 |
| Rate | -1.0pp $328 | -0.5pp $295 | base $262 | +0.5pp $228 | +1.0pp $194 |
UW: 25.0% down · 7.5% · 30yr · 1.5% tax · 5.0% vac · 8.0% maint · 8.0% mgmt
Financing live
Cash to close
- Down payment
- $32,500
- Closing costs
- $3,900
- Reserves months
- —
- Total cash needed
- —
Loan-product check · same deal, 3 products live
Conventional
25% down · 7.5% · 30yr
- Down + closing
- —
- Monthly P&I
- —
- Monthly cashflow
- —
- DSCR
- —
- Eligible?
- —
Personal DTI + credit; lowest rate.
DSCR
20% down · 8.5% · 30yr
- Down + closing
- —
- Monthly P&I
- —
- Monthly cashflow
- —
- DSCR
- —
- Eligible?
- —
No personal income docs; deal must DSCR.
Hard money
10% down · 12.0% · 12mo
- Down + closing
- —
- Monthly P&I
- —
- Monthly cashflow
- —
- DSCR
- —
- Eligible?
- —
Short-term bridge; refi at stabilization.
Rent comps 28 comps
| Address | Beds | Baths | Sqft | Rent | $/sqft | DOM | Units | Dist |
|---|---|---|---|---|---|---|---|---|
| 4120 Geraldine Ave St Ann, MO | 2.0 | 1.5 | 922 | $1,200 | $1.30 | 18d | 1 | 0.14mi |
| 3961 Jane Ave Unit 3963 St Ann, MO | 2.0 | 1.0 | 750 | $1,195 | $1.59 | 15d | 1 | 0.40mi |
| 10145 Cabana Club Dr St Ann, MO | 1.0–2.0 | 1.0–2.0 | 776 | $1,060 | $1.37 | 44d | 8 | 0.43mi |
| 4616 Country Ln St Ann, MO | 2.0 | 1.0–2.0 | 758 | $1,505 | $1.99 | 3d | 9 | 0.46mi |
| 9807 Guthrie Ave Saint Louis, MO | 3.0 | 2.0 | 1068 | $1,700 | $1.59 | 24d | 1 | 0.46mi |
| 4204 Beauty Ln Saint Louis, MO | 4.0 | 1.5 | 1299 | $1,690 | $1.30 | 44d | 1 | 0.48mi |
| 10069 Livingston Ave St Ann, MO | 2.0 | 1.0 | 875 | $1,100 | $1.26 | 24d | 1 | 0.54mi |
| 9457 Harold Dr Saint Louis, MO | 3.0 | 1.0 | 1472 | $1,530 | $1.04 | 22d | 1 | 0.73mi |
| 9675 Muriel Ave Unit 9627 Overland, MO | 2.0 | 1.5 | 830 | $1,200 | $1.45 | 44d | 1 | 0.76mi |
| 9675 Muriel Ave Unit 9733 Overland, MO | 2.0 | 1.5 | 830 | $1,200 | $1.45 | 4d | 1 | 0.76mi |
| 9448 Harold Dr Saint Louis, MO | 2.0 | 1.0 | 864 | $1,495 | $1.73 | 44d | 1 | 0.77mi |
| 4400 Gordon Ave Saint Louis, MO | 3.0 | 2.0 | 1500 | $1,800 | $1.20 | 5d | 1 | 0.79mi |
| 10742 Tropic Dr Unit VACANT St Ann, MO | 2.0 | 1.0 | 800 | $1,200 | $1.50 | 44d | 1 | 0.93mi |
| 3648 Edmundson Rd Unit 1 St. Louis, MO | 2.0 | 1.0 | 900 | $995 | $1.11 | 44d | 1 | 0.93mi |
| 9969 Sloane Sq Unit 9969C St. Louis, MO | 2.0 | 1.0 | 761 | $895 | $1.18 | 5d | 1 | 0.98mi |
| 11276 Liana Ln Saint Ann, MO | 2.0 | 1.0 | 780 | $1,189 | $1.52 | 5d | 1 | 1.00mi |
| 10788 Tropic Dr Saint Ann, MO | 2.0 | 1.0 | 828 | $1,260 | $1.52 | 44d | 1 | 1.04mi |
| 3529 Saint Joachim Ln Unit NA St Ann, MO | 2.0 | 1.0 | 900 | $1,450 | $1.61 | 21d | 1 | 1.05mi |
| 3529 Saint Joachim Ln Saint Ann, MO | 2.0 | 1.0 | 900 | $1,450 | $1.61 | 24d | 1 | 1.05mi |
| 9183 Harold Dr Saint Louis, MO | 3.0 | 1.0 | 912 | $1,200 | $1.32 | 44d | 1 | 1.07mi |
| 3434 Sims Ave Saint Ann, MO | 3.0 | 1.5 | 988 | $1,545 | $1.56 | 44d | 1 | 1.13mi |
| 10214 Saint Anthony Ln Saint Ann, MO | 2.0 | 1.0 | 734 | $1,200 | $1.63 | 44d | 1 | 1.23mi |
| 10116 Saint Katherine Ln Saint Ann, MO | 3.0 | 1.0 | 984 | $1,865 | $1.90 | 18d | 1 | 1.24mi |
| 9310 Shirley Gardens Dr Apt C St. Louis, MO | 2.0 | 1.0 | 800 | $1,200 | $1.50 | 44d | 1 | 1.28mi |
| 9310 Shirley Gardens Dr Apt B St. Louis, MO | 2.0 | 1.0 | 800 | $1,100 | $1.38 | 44d | 1 | 1.28mi |
| 3219 Royalton Ave Saint Louis, MO | 2.0 | 1.0 | 792 | $1,095 | $1.38 | 22d | 1 | 1.41mi |
| 3213 Airway Ave Saint Louis, MO | 3.0 | 1.0 | 1215 | $1,550 | $1.28 | 44d | 1 | 1.43mi |
| 3209 Royalton Ave Saint Louis, MO | 2.0 | 1.0 | 805 | $1,150 | $1.43 | 44d | 1 | 1.44mi |
Listing history 11 events
-
2026-06-21days on market $130,000 Active 18 DOM
-
2026-06-18days on market $130,000 Active 15 DOM
-
2026-06-17days on market $130,000 Active 14 DOM
-
2026-06-16days on market $130,000 Active 13 DOM
-
2026-06-15days on market $130,000 Active 12 DOM
-
2026-06-13days on market $130,000 Active 10 DOM
-
2026-06-09days on market $130,000 Active 6 DOM
-
2026-06-08days on market $130,000 Active 5 DOM
-
2026-06-07days on market $130,000 Active 4 DOM
-
2026-06-03remarks 699-char remark
-
2026-06-03$130,000 Active 1 DOM
ⓘ Source: listings_history table (triggers on properties + properties_extension) + one-shot
backfill from property_details.listing_events for pre-trigger history.
Tax reassessment forecast MO · Resets to sale price
- Current annual tax
- $1,130 · $94/mo
- Projected year-2 tax
- $1,261 · $105/mo
- Expected delta
- +$131/yr (+$11/mo · 11.6%)
ⓘ Screening estimate from a state-policy table — verify with the county assessor before closing.
Climate risk First Street
- Flood 1/10 Low FEMA zone X (unshaded) · 0% chance over 30 yrs
- Wildfire 1/10 Low
- Heat 4/10 Moderate 7 d/yr ≥105°F today · 21 d/yr by 30 yrs out
- Wind 2/10 Low 100% chance of damaging wind over 30 yrs
- Air quality 2/10 Low 1 unhealthy d/yr today · 3 by 30 yrs out
Nearby sold comps map
Loading sold comps map…
Walkable amenities ~0.75 mi
Loading nearby amenities…
Taxation est. · year 1
- Rental income
- $16,591
- − Mortgage interest
- −$7,282
- − Property taxes
- −$1,130
- − Insurance
- −$650
- − Repairs & maintenance
- −$1,327
- − Management
- −$1,327
- − Depreciation
- −$3,782
- Taxable income
- $1,092
- Est. tax owed @ 24.0%
- −$262
- After-tax cash flow
- $2,883/yr
For passive investors: Depreciation is non-cash, so a rental often shows a tax loss while cash-flowing — sheltering income. Rental losses are passive: they offset passive income freely, and up to $25,000/yr can offset ordinary (W-2) income if you actively participate and your MAGI is under $100k (phasing out to $0 by $150k); unused losses carry forward. On sale, claimed depreciation is recaptured at up to 25%, and gains may owe capital-gains tax (a 1031 exchange can defer both). Figures are a year-1 estimate at your 24.0% rate — not tax advice; consult a CPA.
Schools (NCES district)
- District
- Ritenour
- NCES district ID
- 2926640
- Math proficiency
- 13% ▼ -14.00%
- Reading proficiency
- 27% ▼ -7.00%
- Median HH income
- $41,410
- Composite
- 17.04/100
- National rank
- #9125
- State rank
- #304 of 324 in MO
Livability — Edmundson
- Score
- 63/100
- State rank
- #353
- US rank
- #15711
Category grades
Schools grade is shown separately in the Schools card above.
Census & demographics
- Census place
- Edmundson, MO
- County
- Saint Louis County · 888,823 people
- Metro
- St. Louis, MO-IL
- Population (ZIP)
- 13,059
- Household income
- $44,680
- Rent vs Own
- Severe rent burden
- 655.0
Population outlook (St. Louis County) Hauer SSP2
- Today (2025)
- 1,025,227 people
- By 2030
- 1,028,023 · +0.3%
- By 2040
- 1,020,940 · -0.4%
- By 2050
- 1,007,280 · -1.8%
- By 2075
- 987,277 · -3.7%
- By 2100
- 921,984 · -10.1%
Race, ethnicity, and origin ACS 2023
- Neighborhood character
- Predominantly Black (66%)
- Race & ethnicity
- Black 66% White 17% Hispanic / Latino 13% Two or more races 7%
- Hispanic origin (detail)
- Mexican 8%
- Common ancestry
- Lithuanian 1%
- Foreign-born
- 6% · Canada
- Languages at home
- 86% English-only · Spanish 11%
Political lean MEDSL · St. Louis
- 2024 margin
- Strong D (+23.4) · D 60.8% · R 37.4% · Other 1.7%
- 2008→2024 swing
- +3.5pp toward D · 2008: 19.9pp · 2024: 23.4pp
- All cycles
- 2024: D+23.4 2020: D+24.0 2016: D+16.2 2012: D+13.7 2008: D+19.9
Not yet ingested
- Civics
- —
Market trends
- HPI YoY
- ▼ -164.02%
- Current HPI
- 226.9524
- Rent YoY
- ▲ 1.61%
- Metro
- St. Louis, MO-IL
- State GDP YoY
- ▲ 1.84%
- F500 in state
- 20
Industry mix (Fortune 500 HQ in MO)
| Industry | F500 HQs | Revenue |
|---|---|---|
| Healthcare | 1 | $163B |
|
||
| Insurance | 1 | $21B |
|
||
| Industrial Technology | 1 | $17B |
|
||
| Retail | 1 | $16B |
|
||
| Industrial Distribution | 1 | $10B |
|
||
| Utilities | 1 | $9B |
|
||
Price history
+251.4% since first listed5 events — show timeline
- 2026-06-03 Listed $130,000 MARIS as Distributed by MLS Grid
- 2012-08-02 Sold (Public Records) $36,842 Public Records
- 2002-05-15 Sold (Public Records) $49,000 Public Records
- 1999-04-23 Sold (Public Records) — Public Records
- 1994-04-21 Sold (Public Records) $37,000 Public Records
Property tax history
+3.8%/yrLatest (2022): $1,130 · +0.1% YoY. Source: county tax records.
Cash-flow waterfall
monthlySold comps — $/sqft
last 12 mo · ≤1 miLoading sold comps…