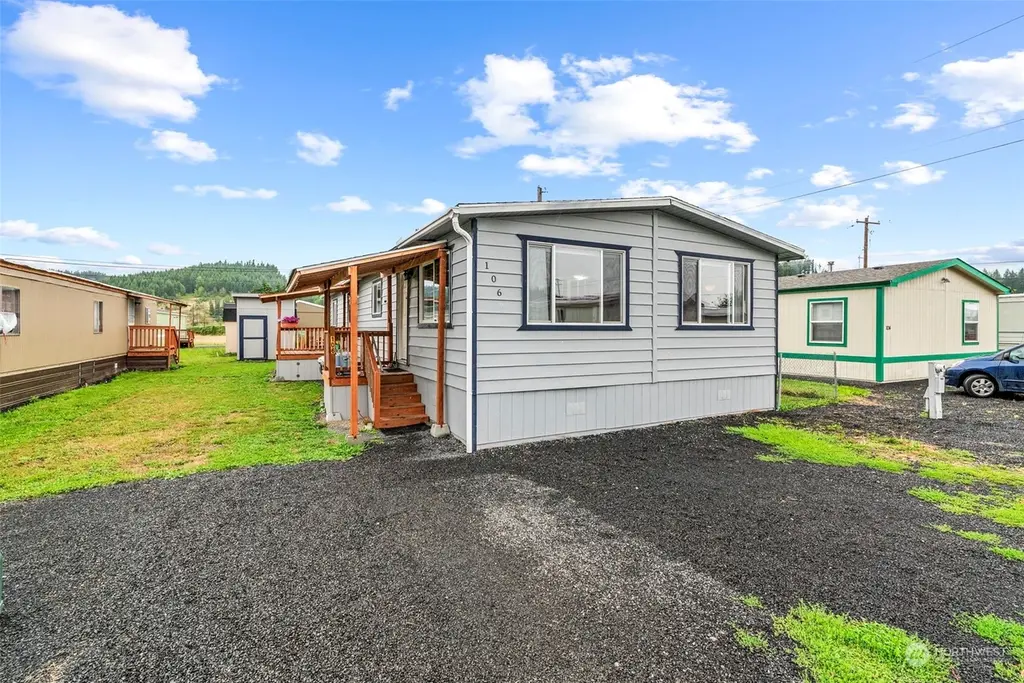
106 Francis Ln · Centralia, WA
Flood risk 5/10 · Moderate
- FEMA flood zone
- X
- Chance of flooding over 30 yrs
- 0.24%
- Est. flood insurance / yr
- $507 – $1,088
Fire risk 3/10 · Minor
- Est. fire insurance / yr
- $604 – $1,122
Heat risk 3/10 · Minor
- Hot days now (above 89°F)
- 8 days/yr
- Hot days in 30 yrs
- 15 days/yr
Wind risk 1/10 · Minimal
- Chance of severe wind over 30 yrs
- —
Air-quality risk 6/10 · Moderate
- Unhealthy air days now
- 8 days/yr
- Unhealthy air days in 30 yrs
- 8 days/yr
Risk factors via First Street. Map © Google.
Why this score? — see what drove the C+ grade
The composite is a weighted blend of 9 inputs, each scored 0–100. Each bar is that input's sub-score; the figure is the points it added to the 100-point composite (weight × sub-score).
- Cash flow +30.0/30.0
- DSCR +10.0/10.0
- 1% rule +7.8/10.0
- Schools +4.0/10.0
- Livability +4.0/5.0
- Condition / age +4.0/5.0
- Rent growth +3.2/5.0
- ARV discount +0.0/15.0
- Appreciation +0.0/10.0
$149,000
🖨 Deal sheet 📄 Offer letter ✓ Due diligence
Listing remarks
Beautifully Refreshed 3 Bedroom 2 Bath Home in Peaceful Country Mobile Park. Step into this outstanding, refreshed home, updated from top to bottom, both inside and out. Including a heat pump. Every detail has been tastefully done, creating a warm and inviting atmosphere in this country mobile park setting. Enjoy the best of both worlds—country living with the convenience of being close to all amenities. The home features brand-new porches and decks, perfect for relaxing. With reasonable space rent, this property offers exceptional value. Whether you're looking for a cozy home with modern touches, this move-in-ready gem has it all. All appliances are included. Don't miss out on this f
Key facts
- Brand-new porches
- Refreshed home
- Built 1978
Tags
Neighborhood map
What this means for you Summary
Snapshot
- This is a 3-bed/2.0-bath other listed at $149k. Condition is rated good.
Deal economics
- At list price, monthly cash flow is $608 ($7k/yr) — positive.
- The deal already cash-flows at list — no discount required.
- Meets the 1% rule at list price ($2k rent vs $149k).
- Recommended offer: $131k (12.0% below list) — sets the bar for market timing.
- Cap rate 11.2% vs local median 3.0% in Centralia — top-decile yield for the area; either an underpriced asset or a hidden risk that comps aren't pricing in. Stress-test before assuming the spread holds.
Location & tenants
- Location reads 81/100 on livability (#81 in WA, #1,497 nationally) — a professional / high-income tenant draw. Strengths: commute A+, health & safety A+, cost of living A; Watch: schools C-, crime C-, employment F.
- Centralia School District (town): math 39% / reading 52% proficiency, ranked #187 of 291 in WA (top 64%) — families likely to look elsewhere, expect single-tenant / working-renter base with shorter leases; 65% free/reduced lunch — lower-income household profile, screen leases tightly.
- Market conditions: Rents rising (+3.0%/yr); 258 active listings in the ZIP; 1 comparable units currently listed for rent nearby; 265 units permitted in Lewis County in 2024 (44 in 5+ unit buildings).
- This rent runs 36% of the median local income ($63k/yr) — at the standard rent-burdened threshold; future hikes will face affordability resistance.
Forward outlook
- Local home prices are declining (-3.0%/yr); year-one equity from $1k of loan paydown is wiped out by about $4k of value loss. Plan a longer hold.
- Lewis County population projected at -11% by 2050 — secular population decline; favor cash flow + early exit over multi-decade hold.
- At projected returns (-3.0% appreciation + 3.0% rent growth), your $42k cash investment doubles in ~7 years — after that, you're playing with house money.
Negotiation context
- It's been on market 652 days — a 12% lower offer ($131k) is reasonable based on typical stale-listing flexibility.
- 2 sale attempts since 2y ago; this cycle's ask has dropped $20k (12%) from the opening price — seller is motivated, your offer sets the floor, not the list.
Risks & watch-outs
- Climate carrying-cost: moderate flood risk — expect insurance premiums to compound above CPI over the hold.
Questions for the listing agent
- It's been on market 652 days. Have you received any prior offers? Is the seller open to a 12% concession, seller financing, or rate buy-down credit?
- Built in 1978 — when were the roof, HVAC, electrical panel, plumbing, and water heater last replaced?
- Why hasn't it sold? Are there any deal-killer items the seller is aware of (foundation, flood, title, zoning, code violations)?
- Is there a deadline driving the sale (1031 exchange, divorce, estate, relocation)? That informs how much negotiation room exists.
- What's the average days-on-market for RENTAL listings here right now (not sales)? A rising rental-DOM trend means longer vacancies and softer asking-rent achievability than the comps imply.
- What's the recent tenant-quality profile in this submarket — average credit score on applications, eviction rate, late-payment / NSF rate, and stable-employment percentage? A property-management company in the area should have these aggregated.
- How much new for-sale + rental construction is in the pipeline within 1–3 miles? Heavy new supply typically softens prices + rents 12–24 months out; constrained supply supports both.
Investment metrics
- 1% rule
- 1.28% ✓
- Cap rate
- 11.19%
- Cash-on-cash
- 17.49%
- DSCR
- 1.78
- GRM
- 6.5
CMA / ARV
- ARV (median comp)
- $115,000
- List price
- $149,000
- Delta
- 29.57%
- Verdict
- OVERPRICED
- Comps
- 5 within 1.0 mi
Projected returns pro-forma
-3.0% appreciation · 3.0% rent growth · sell at horizon
- IRR
- 8.9%
- Equity multiple
- 1.35×
- Total profit
- $14,538
- Equity at exit
- $22,216
- IRR
- 18.0%
- Equity multiple
- 2.49×
- Total profit
- $62,327
- Equity at exit
- $12,883
Cash invested: $41,720 (down + closing). Projections, not guarantees.
Landlord ↔ Tenant lean methodology
- Overall (STATE)
- 28 Tenant-Leaning
- State Washington
- 28 Tenant-Leaning · D+8
- County
- — inherits STATE
- City
- — inherits STATE
ZIP-level market 98531
- Rents YoY
- 3.0%
- Active inventory
- 258
- Price-to-rent
- 6.5×
Monthly cashflow live
- Estimated rent
- $1,908 medium interval (Pro) →
- Mortgage (P&I)
- −$781
- Tax from tax record
- −$56 /mo · $668/yr
- Insurance
- −$62
- HOA
- −$0
- Vacancy / Maint / Mgmt
- −$401
- Net cashflow
- $608
Break-even live
UW: 25.0% down · 7.5% · 30yr · 1.5% tax · 5.0% vac · 8.0% maint · 8.0% mgmt
Financing live
Cash to close
- Down payment
- $37,250
- Closing costs
- $4,470
- Reserves months
- —
- Total cash needed
- —
Loan-product check · same deal, 3 products live
Conventional
25% down · 7.5% · 30yr
- Down + closing
- —
- Monthly P&I
- —
- Monthly cashflow
- —
- DSCR
- —
- Eligible?
- —
Personal DTI + credit; lowest rate.
DSCR
20% down · 8.5% · 30yr
- Down + closing
- —
- Monthly P&I
- —
- Monthly cashflow
- —
- DSCR
- —
- Eligible?
- —
No personal income docs; deal must DSCR.
Hard money
10% down · 12.0% · 12mo
- Down + closing
- —
- Monthly P&I
- —
- Monthly cashflow
- —
- DSCR
- —
- Eligible?
- —
Short-term bridge; refi at stabilization.
Rent comps 1 comps
| Address | Beds | Baths | Sqft | Rent | $/sqft | DOM | Units | Dist |
|---|---|---|---|---|---|---|---|---|
| 1111 Grand Ave Unit B Centralia, WA | 2.0 | 1.0 | 1050 | $1,495 | $1.42 | 43d | 1 | 1.28mi |
Listing history 21 events
-
2026-06-19days on market $149,000 Active 652 DOM
-
2026-06-18days on market $149,000 Active 651 DOM
-
2026-06-17days on market $149,000 Active 650 DOM
-
2026-06-16days on market $149,000 Active 649 DOM
-
2026-06-15days on market $149,000 Active 648 DOM
-
2026-06-14days on market $149,000 Active 646 DOM
-
2026-06-12days on market $149,000 Active 645 DOM
-
2026-06-09days on market $149,000 Active 642 DOM
-
2026-06-08days on market $149,000 Active 641 DOM
-
2026-06-07days on market $149,000 Active 640 DOM
-
2026-06-07days on market $149,000 Active 639 DOM
-
2026-06-03days on market $149,000 Active 636 DOM
-
2026-06-02days on market $149,000 Active 635 DOM
-
2026-06-01days on market $149,000 Active 634 DOM
-
2026-05-31days on market $149,000 Active 633 DOM
-
2026-05-30days on market $149,000 Active 632 DOM
-
2025-09-03status Active
-
2025-08-12price $149,000
-
2024-10-05price $169,000
-
2024-09-02price $175,000
-
2024-09-01$169,000 Active
ⓘ Source: listings_history table (triggers on properties + properties_extension) + one-shot
backfill from property_details.listing_events for pre-trigger history.
Tax reassessment forecast WA · Resets to sale price
- Current annual tax
- $668 · $56/mo
- Projected year-2 tax
- $1,460 · $122/mo
- Expected delta
- +$792/yr (+$66/mo · 118.7%)
ⓘ Screening estimate from a state-policy table — verify with the county assessor before closing.
Climate risk First Street
- Flood 5/10 Major FEMA zone X · 24% chance over 30 yrs
- Wildfire 3/10 Moderate
- Heat 3/10 Moderate 8 d/yr ≥89°F today · 15 d/yr by 30 yrs out
- Wind 1/10 Low
- Air quality 6/10 Major 8 unhealthy d/yr today · 8 by 30 yrs out
Nearby sold comps map
Loading sold comps map…
Walkable amenities ~0.75 mi
Loading nearby amenities…
Taxation est. · year 1
- Rental income
- $22,895
- − Mortgage interest
- −$8,346
- − Property taxes
- −$668
- − Insurance
- −$745
- − Repairs & maintenance
- −$1,832
- − Management
- −$1,832
- − Depreciation
- −$4,335
- Taxable income
- $5,138
- Est. tax owed @ 24.0%
- −$1,233
- After-tax cash flow
- $6,065/yr
For passive investors: Depreciation is non-cash, so a rental often shows a tax loss while cash-flowing — sheltering income. Rental losses are passive: they offset passive income freely, and up to $25,000/yr can offset ordinary (W-2) income if you actively participate and your MAGI is under $100k (phasing out to $0 by $150k); unused losses carry forward. On sale, claimed depreciation is recaptured at up to 25%, and gains may owe capital-gains tax (a 1031 exchange can defer both). Figures are a year-1 estimate at your 24.0% rate — not tax advice; consult a CPA.
Condition & rehab AI · 12 photos
This move-in-ready home in a peaceful country mobile park setting has been refreshed from top to bottom, offering a warm and inviting atmosphere with modern touches.
Value-add opportunities
- Resale Paint exterior walls — Enhances curb appeal and value
- Rental Clean gutters — Keeps property in good condition and prevents water damage
Renovation cost estimate screening
Value-add ROI direction
- Resale Paint exterior walls — Enhances curb appeal and value ↑
- Rental Clean gutters — Keeps property in good condition and prevents water damage ↑
ⓘ Cost ranges are severity-bucket heuristics (US national rule-of-thumb). Get contractor quotes + a written scope before underwriting a rehab budget.
Schools (NCES district)
- District
- Centralia School District
- NCES district ID
- 5301140
- Math proficiency
- 39% ▼ -2.00%
- Reading proficiency
- 52% ▼ -2.00%
- Median HH income
- $38,851
- Composite
- 40.17/100
- National rank
- #7832
- State rank
- #187 of 291 in WA
Livability — Centralia
- Score
- 81/100
- State rank
- #81
- US rank
- #1497
Category grades
Schools grade is shown separately in the Schools card above.
Census & demographics
- County
- Lewis County · 27,337 people
- City population
- 27,337
- Metro
- Centralia, WA
- Population (ZIP)
- 27,337
- Household income
- $63,406
- Rent vs Own
- Severe rent burden
- 1000.0
Population outlook (Lewis County) Hauer SSP2
- Today (2025)
- 75,749 people
- By 2030
- 74,647 · -1.5%
- By 2040
- 71,310 · -5.9%
- By 2050
- 67,748 · -10.6%
- By 2075
- 59,829 · -21.0%
- By 2100
- 52,293 · -31.0%
Race, ethnicity, and origin ACS 2023
- Neighborhood character
- Predominantly White (74%)
- Race & ethnicity
- White 74% Hispanic / Latino 19% Two or more races 10% Asian 1%
- Hispanic origin (detail)
- Mexican 15% Puerto Rican 1%
- Common ancestry
- Portuguese 3% Slovak 3% Lithuanian 2%
- Foreign-born
- 9% · Canada, Vietnam
- Languages at home
- 83% English-only · Spanish 16% Tagalog/Filipino 1%
Political lean MEDSL · Lewis
- 2024 margin
- Solid R (+33.0) · D 32.0% · R 65.0% · Other 3.0%
- 2008→2024 swing
- -13.8pp toward R · 2008: -19.2pp · 2024: -33.0pp
- All cycles
- 2024: R+33.0 2020: R+32.8 2016: R+36.2 2012: R+23.5 2008: R+19.2
Not yet ingested
- Civics
- —
Market trends
- HPI YoY
- ▼ -249.98%
- Current HPI
- 378.6936
- Rent YoY
- ▲ 3.00%
- Metro
- Centralia, WA
- State GDP YoY
- ▲ 4.65%
- F500 in state
- 22
Industry mix (Fortune 500 HQ in WA)
| Industry | F500 HQs | Revenue |
|---|---|---|
| Retail | 2 | $269B |
|
||
| Technology / Retail | 1 | $638B |
|
||
| Technology | 1 | $245B |
|
||
| Telecommunications | 1 | $38B |
|
||
| Food / Beverage | 1 | $36B |
|
||
| Automotive / Trucks | 1 | $34B |
|
||
Price history
-11.8% since first listed5 events — show timeline
- 2025-09-03 Relisted — NWMLS as Distributed by MLS Grid
- 2025-08-12 Price Changed $149,000 NWMLS as Distributed by MLS Grid
- 2024-10-05 Price Changed $169,000 NWMLS as Distributed by MLS Grid
- 2024-09-02 Price Changed $175,000 NWMLS as Distributed by MLS Grid
- 2024-09-01 Listed $169,000 NWMLS as Distributed by MLS Grid
Property tax history
+9.3%/yrLatest (2026): $668 · +9.3% YoY. Source: county tax records.
Cash-flow waterfall
monthlySold comps — $/sqft
last 12 mo · ≤1 miLoading sold comps…