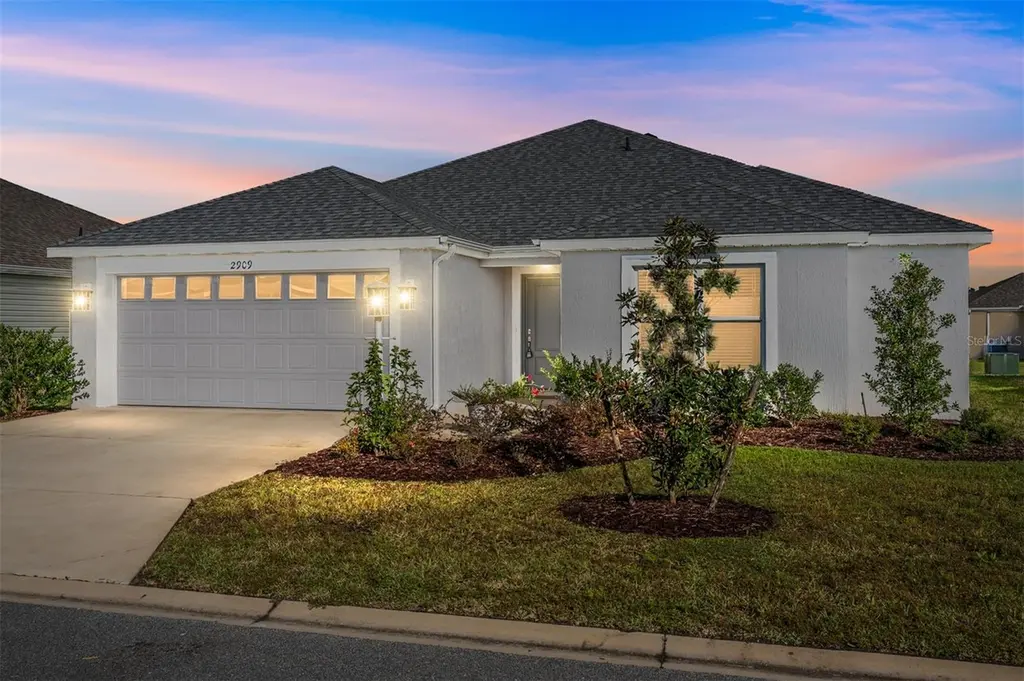
2909 Chimborazo Way · Wildwood, FL
Flood risk 1/10 · Minimal
- FEMA flood zone
- X (unshaded)
- Chance of flooding over 30 yrs
- 0.0%
- Est. flood insurance / yr
- $507 – $1,088
Fire risk 4/10 · Minor
- Est. fire insurance / yr
- $947 – $1,759
Heat risk 8/10 · Major
- Hot days now (above 108°F)
- 7 days/yr
- Hot days in 30 yrs
- 22 days/yr
Wind risk 9/10 · Severe
- Chance of severe wind over 30 yrs
- 99.0%
Air-quality risk 2/10 · Minimal
- Unhealthy air days now
- 1 days/yr
- Unhealthy air days in 30 yrs
- 2 days/yr
Risk factors via First Street. Map © Google.
Why this score? — see what drove the F grade
The composite is a weighted blend of 9 inputs, each scored 0–100. Each bar is that input's sub-score; the figure is the points it added to the 100-point composite (weight × sub-score).
- Appreciation +10.0/10.0
- Cash flow +6.9/30.0
- Schools +5.2/10.0
- Livability +3.5/5.0
- Rent growth +2.5/5.0
- Condition / age +2.5/5.0
- 1% rule +1.9/10.0
- DSCR +1.1/10.0
- ARV discount +0.2/15.0
$400,000
🖨 Deal sheet (PDF) 📄 Offer letter ✓ Due diligence
Listing remarks
Under contract-accepting backup offers. * * TURNKEY * * LOCATION, LOCATION, LOCATION! * * Nestled in the highly desirable VILLAGE OF RICHMOND, this nearly new 3-bedroom, 2-bath “Sequoia” (Loblolly) model (built in 2022) is just ½ mile from Brownwood Paddock Square — close to shopping, dining, and the New in ‘25 Harry & The Natives Restaurant! This lovely home features classic block-and-stucco construction, a spacious 2-car garage, and a bright, open-concept floor plan connecting the kitchen, dining, and living areas — perfect for entertaining. PROFESSIONALLY DECORATED with modern & stunning furnishings and decor are sure to please and are
Key facts
- 5,755 sq ft lot
- 2 garage spots
- Community pool
Property features AI
Finance
- Other: Lot size approximately 0.13 acres; Paved road access
- Financial info: Lease restrictions apply
- HOA & community: Community pool; Tennis courts; Dog park; Golf; Golf carts allowed; Irrigation with reclaimed water; Deed restrictions; Association fees include pool; Senior community
Exterior
- Parking: Attached garage with space for 2 cars
- Utilities: Public water; Public sewer; Electricity connected; Natural gas connected; Cable connected; Underground utilities; Sprinkler recycled
- Home design: Single-family residence; One story; Faces south; Residential zoning; Homestead exempt; Located in a CDD
- Construction: Block and stucco construction; Shingle roof; Slab foundation; Built as SEQUOIA model
- Exterior features: Sliding doors; Sprinkler system (metered)
Interior
- Kitchen: Dishwasher; Disposal; Microwave; Range; Refrigerator
- Bedrooms: 3 bedrooms
- Flooring: Carpet
- Bathrooms: 2 full bathrooms
- Heating & cooling: Natural gas heating; Central air conditioning
- Interior features: Ceiling fans; Eat-in kitchen; High ceilings; Kitchen/family room combo; Open floorplan; Split bedroom layout; Thermostat; Walk-in closet(s); Window treatments
- Laundry & utility: Washer and dryer included; Laundry inside
Neighborhood map
What this means for you Summary
Snapshot
- This is a 3-bed/2.0-bath single-family listed at $400k.
Deal economics
- At list price, monthly cash flow is $-613 ($-7k/yr) — negative.
- To cash-flow at today's rent, offer at most $292k (27.1% below list).
- To meet the 1% rule (rent ≥ 1% of price), the offer needs to be $275k (31.2% below list).
- Recommended offer: $275k (31.2% below list) — sets the bar for 1% rule.
Location & tenants
- Location reads 69/100 on livability (#471 in FL) — a middle-class / working-renter tenant base. Strengths: health & safety A+, cost of living A, crime A-; Watch: amenities F, commute F, employment D-.
- Sumter (rural): math 61% / reading 61% proficiency, ranked #11 of 73 in FL (top 15%) — acceptable for families but not a draw, mixed tenant base, ~2y average lease.
- Zoned schools: Wildwood Elementary School (math 49% / reading 52%, grade D+, #1,055 of 2,144 statewide, top 50%, 940 students, 76% FRL); South Sumter Middle School (math 55% / reading 54%, grade B-, #183 of 571 statewide, top 34%, 897 students, 61% FRL) — zoned schools average 68% FRL vs 51% district-wide (18 pts higher); higher-poverty schools than district average — tighter screening recommended.
- Market conditions: 269 active listings in the ZIP; 6 comparable units currently listed for rent nearby; rentals at typical pace (median 23d on market — plan ~3-4 weeks tenant-placement turnaround); solid renter incomes; 3,961 units permitted in Sumter County in 2024 (248 in 5+ unit buildings).
- This rent runs 34% of the median local income ($97k/yr) — at the standard rent-burdened threshold; future hikes will face affordability resistance.
Forward outlook
- In year one you build about $43k of equity ($3k loan paydown + $40k appreciation (10.0% local appreciation)).
- Sumter County population projected at +45% by 2050 — long-run rental-demand tailwind backs the buy-and-hold thesis.
- By year 2, paydown + projected appreciation supports a ~$69k cash-out refi (75% LTV) — recoverable capital for the next deal without selling this one.
Negotiation context
- It's been on market 19 days — a 2% lower offer ($394k) is reasonable based on typical stale-listing flexibility.
- 2 sale attempts with the ask held roughly flat each time — persistent listings suggest the price (not the market) is what's stuck; bring a comps-based counter.
Risks & watch-outs
- Climate carrying-cost: severe wind risk, 99% chance of damaging wind over 30y; extreme-heat days projected 7→22/yr by 2055 (HVAC capex compounding) — expect insurance premiums to compound above CPI over the hold.
Questions for the listing agent
- What do current leases actually rent for vs. the listed asking? Can we see a recent rent roll and the last 12 months of T-12 income?
- Is there a deadline driving the sale (1031 exchange, divorce, estate, relocation)? That informs how much negotiation room exists.
- The area grade is low — what's the realistic commute time and amenity access for the typical tenant pool here? Any planned neighborhood developments (good or bad) we should know about?
- What's the average days-on-market for RENTAL listings here right now (not sales)? A rising rental-DOM trend means longer vacancies and softer asking-rent achievability than the comps imply.
- What's the recent tenant-quality profile in this submarket — average credit score on applications, eviction rate, late-payment / NSF rate, and stable-employment percentage? A property-management company in the area should have these aggregated.
- How much new for-sale + rental construction is in the pipeline within 1–3 miles? Heavy new supply typically softens prices + rents 12–24 months out; constrained supply supports both.
Investment metrics
- 1% rule
- 0.69% ✗
- Cap rate
- 4.45%
- Cash-on-cash
- -6.57%
- DSCR
- 0.71
- GRM
- 12.1
CMA / ARV
- ARV (on-the-fly)
- $343,840
- Comps found
- 12
Show comp detail 12 sales within ~0.75 mi
| Address | Dist | Beds/Ba | Sqft | Sold | Price | $/sf | Match |
|---|---|---|---|---|---|---|---|
| 2909 Chimborazo Way | 0.00mi | 3/2.0 | 1,535 (0%) | 0mo | $400,000 | $261 | 100 |
| 4280 Canova Draney Loop | 0.57mi | 3/2.0 | 1,519 (-1%) | 2mo | $340,000 | $224 | 70 |
| 2775 Navy Hill Cir | 0.28mi | 3/2.0 | 1,476 (-4%) | 13mo | $420,000 | $285 | 70 |
| 4371 Shannon Loop | 0.48mi | 3/2.0 | 1,557 (+1%) | 7mo | $390,000 | $250 | 69 |
| 4414 Cameo Cir | 0.46mi | 3/2.0 | 1,547 (+1%) | 12mo | $339,000 | $219 | 67 |
| 4280 Gale Ln | 0.53mi | 3/2.0 | 1,440 (-6%) | 1mo | $322,000 | $224 | 64 |
| 5585 Hancock Dr | 0.56mi | 3/2.0 | 1,494 (-3%) | 16mo | $200,000 | $134 | 56 |
| 5212 Oxford Ct | 0.59mi | 3/2.0 | 1,501 (-2%) | 17mo | $255,000 | $170 | 55 |
| 3233 Rayma Pl | 0.62mi | 3/2.0 | 1,496 (-2%) | 17mo | $387,000 | $259 | 53 |
| 5514 Columbus Cir | 0.50mi | 2/2.0 (-1) | 1,440 (-6%) | 22mo | $135,000 | $94 | 43 |
| 3234 Miller Stachler St | 0.64mi | 3/2.0 | 1,392 (-9%) | 21mo | $380,000 | $273 | 37 |
| 5598 Hancock Dr | 0.54mi | 2/2.0 (-1) | 1,344 (-12%) | 21mo | $152,000 | $113 | 32 |
Match score weights: distance 35% · size 25% · config 20% · recency 20%. Top-matched comps best support the ARV.
Projected returns pro-forma
10.0% appreciation · 3.0% rent growth · sell at horizon
- IRR
- 19.6%
- Equity multiple
- 2.60×
- Total profit
- $178,854
- Equity at exit
- $360,352
- IRR
- 18.0%
- Equity multiple
- 5.98×
- Total profit
- $557,516
- Equity at exit
- $777,112
Cash invested: $112,000 (down + closing). Projections, not guarantees.
Landlord ↔ Tenant lean methodology
- Overall (STATE)
- 87 Strongly Landlord-Friendly
- State Florida
- 87 Strongly Landlord-Friendly · R+3
- County
- — inherits STATE
- City
- — inherits STATE
ZIP-level market 32163
- Home prices YoY
- 9.8%
- Active inventory
- 269
- Price-to-rent
- 12.1×
Monthly cashflow live
- Estimated rent
- $2,752 high interval (Pro) →
- Mortgage (P&I)
- −$2,098
- Tax from tax record
- −$523 /mo · $6,277/yr
- Insurance
- −$167
- HOA
- −$0
- Vacancy / Maint / Mgmt
- −$578
- Net cashflow
- $-613
Break-even live
Sensitivity live
| Price | -10% $-387 | -5% $-500 | +0% $-613 | +5% $-726 | +10% $-840 |
|---|---|---|---|---|---|
| Rent | -10% $-831 | -5% $-722 | +0% $-613 | +5% $-504 | +10% $-396 |
| Rate | -1.0pp $-412 | -0.5pp $-511 | base $-613 | +0.5pp $-717 | +1.0pp $-822 |
UW: 25.0% down · 7.5% · 30yr · 1.5% tax · 5.0% vac · 8.0% maint · 8.0% mgmt
Financing live
Cash to close
- Down payment
- $100,000
- Closing costs
- $12,000
- Reserves months
- —
- Total cash needed
- —
Loan-product check · same deal, 3 products live
Conventional
25% down · 7.5% · 30yr
- Down + closing
- —
- Monthly P&I
- —
- Monthly cashflow
- —
- DSCR
- —
- Eligible?
- —
Personal DTI + credit; lowest rate.
DSCR
20% down · 8.5% · 30yr
- Down + closing
- —
- Monthly P&I
- —
- Monthly cashflow
- —
- DSCR
- —
- Eligible?
- —
No personal income docs; deal must DSCR.
Hard money
10% down · 12.0% · 12mo
- Down + closing
- —
- Monthly P&I
- —
- Monthly cashflow
- —
- DSCR
- —
- Eligible?
- —
Short-term bridge; refi at stabilization.
Rent comps 6 comps
| Address | Beds | Baths | Sqft | Rent | $/sqft | DOM | Units | Dist |
|---|---|---|---|---|---|---|---|---|
| 2910 Monument Way The Villages, FL | 2.0 | 2.0 | 1494 | $2,600 | $1.74 | 23d | 1 | 0.17mi |
| 3359 Brianna Ln The Villages, FL | 3.0 | 2.0 | 1584 | $3,100 | $1.96 | 23d | 1 | 0.80mi |
| 3412 Melissa Ln The Villages, FL | 2.0 | 2.0 | 1148 | $2,200 | $1.92 | 23d | 1 | 0.88mi |
| 3480 Kewadin Ave The Villages, FL | 2.0 | 2.0 | 1758 | $2,500 | $1.42 | 23d | 1 | 1.12mi |
| 2577 Lindewood St The Villages, FL | 2.0 | 2.0 | 1206 | $2,495 | $2.07 | 23d | 1 | 1.21mi |
| 6629 Dan DiCiolla Dr Wildwood, FL | 1.0–3.0 | 1.0–2.5 | 1075 | $2,399 | $2.23 | 23d | 44 | 1.38mi |
Listing history 3 events
-
2026-05-18status Pending
-
2026-04-29$400,000 Active
-
2025-10-13$400,000 Active
ⓘ Source: listings_history table (triggers on properties + properties_extension) + one-shot
backfill from property_details.listing_events for pre-trigger history.
Tax reassessment forecast FL · Resets to sale price
- Current annual tax
- $6,277 · $523/mo
- Projected year-2 tax
- $6,277 · $523/mo
- Expected delta
- $0/yr ($0/mo · 0.0%)
ⓘ Screening estimate from a state-policy table — verify with the county assessor before closing.
Climate risk First Street
- Flood 1/10 Low FEMA zone X (unshaded) · 0% chance over 30 yrs
- Wildfire 4/10 Moderate
- Heat 8/10 Severe 7 d/yr ≥108°F today · 22 d/yr by 30 yrs out
- Wind 9/10 Extreme 99% chance of damaging wind over 30 yrs
- Air quality 2/10 Low 1 unhealthy d/yr today · 2 by 30 yrs out
Nearby sold comps map
Loading sold comps map…
Walkable amenities ~0.75 mi
Loading nearby amenities…
Taxation est. · year 1
- Rental income
- $33,026
- − Mortgage interest
- −$22,406
- − Property taxes
- −$6,277
- − Insurance
- −$2,000
- − Repairs & maintenance
- −$2,642
- − Management
- −$2,642
- − Depreciation
- −$11,636
- Taxable loss
- −$14,577
- Est. tax savings @ 24.0%
- +$3,499
- After-tax cash flow
- $-3,859/yr
For passive investors: Depreciation is non-cash, so a rental often shows a tax loss while cash-flowing — sheltering income. Rental losses are passive: they offset passive income freely, and up to $25,000/yr can offset ordinary (W-2) income if you actively participate and your MAGI is under $100k (phasing out to $0 by $150k); unused losses carry forward. On sale, claimed depreciation is recaptured at up to 25%, and gains may owe capital-gains tax (a 1031 exchange can defer both). Figures are a year-1 estimate at your 24.0% rate — not tax advice; consult a CPA.
Schools (NCES district)
- District
- Sumter
- NCES district ID
- 1201800
- Math proficiency
- 61% ▼ -4.00%
- Reading proficiency
- 61% ▼ -2.00%
- Median HH income
- $48,240
- Composite
- 51.74/100
- National rank
- #1682
- State rank
- #11 of 73 in FL
Livability — Wildwood
- Score
- 69/100
- State rank
- #471
- US rank
- #8500
Category grades
Schools grade is shown separately in the Schools card above.
Census & demographics
- Census place
- Wildwood, FL
- County
- Sumter County · 110,591 people
- City population
- 21,568
- Metro
- The Villages, FL
- Population (ZIP)
- 28,549
- Household income
- $96,775
- Rent vs Own
- Severe rent burden
- 307.0
Population outlook (Sumter County) Hauer SSP2
- Today (2025)
- 161,172 people
- By 2030
- 180,083 · +11.7%
- By 2040
- 209,892 · +30.2%
- By 2050
- 234,186 · +45.3%
- By 2075
- 284,602 · +76.6%
- By 2100
- 317,039 · +96.7%
Race, ethnicity, and origin ACS 2023
- Neighborhood character
- Predominantly White (95%)
- Race & ethnicity
- White 95% Two or more races 2% Hispanic / Latino 2% Asian 1%
- Common ancestry
- Romanian 6% Lithuanian 3% Iranian 3%
- Foreign-born
- 6% · Canada, Vietnam
- Languages at home
- 96% English-only · Spanish 2% Vietnamese 1% Other Indo-European 0%
Political lean MEDSL · Sumter
- 2024 margin
- Solid R (+37.6) · D 30.9% · R 68.6%
- 2008→2024 swing
- -10.6pp toward R · 2008: -27.0pp · 2024: -37.6pp
- All cycles
- 2024: R+37.6 2020: R+36.1 2016: R+39.2 2012: R+34.9 2008: R+27.0
Not yet ingested
- Civics
- —
Market trends
- HPI YoY
- ▲ 20.47%
- Current HPI
- 229.0075
- Rent YoY
- —
- Metro
- The Villages, FL
- State GDP YoY
- ▲ 3.28%
- F500 in state
- 36
Industry mix (Fortune 500 HQ in FL)
| Industry | F500 HQs | Revenue |
|---|---|---|
| Industrial Technology | 2 | $29B |
|
||
| Insurance | 2 | $17B |
|
||
| Retail | 1 | $60B |
|
||
| Technology Distribution | 1 | $58B |
|
||
| Homebuilding | 1 | $35B |
|
||
| Technology Manufacturing | 1 | $35B |
|
||
Price history
+0.0% since first listed3 events — show timeline
- 2026-05-18 Pending — Stellar MLS as Distributed by MLS Grid
- 2026-04-29 Listed $400,000 Stellar MLS as Distributed by MLS Grid
- 2025-10-13 Listed $400,000 Stellar MLS as Distributed by MLS Grid
Property tax history
+173.0%/yrLatest (2025): $6,277 · +1.1% YoY. Source: county tax records.
Cash-flow waterfall
monthlySold comps — $/sqft
last 12 mo · ≤1 miLoading sold comps…