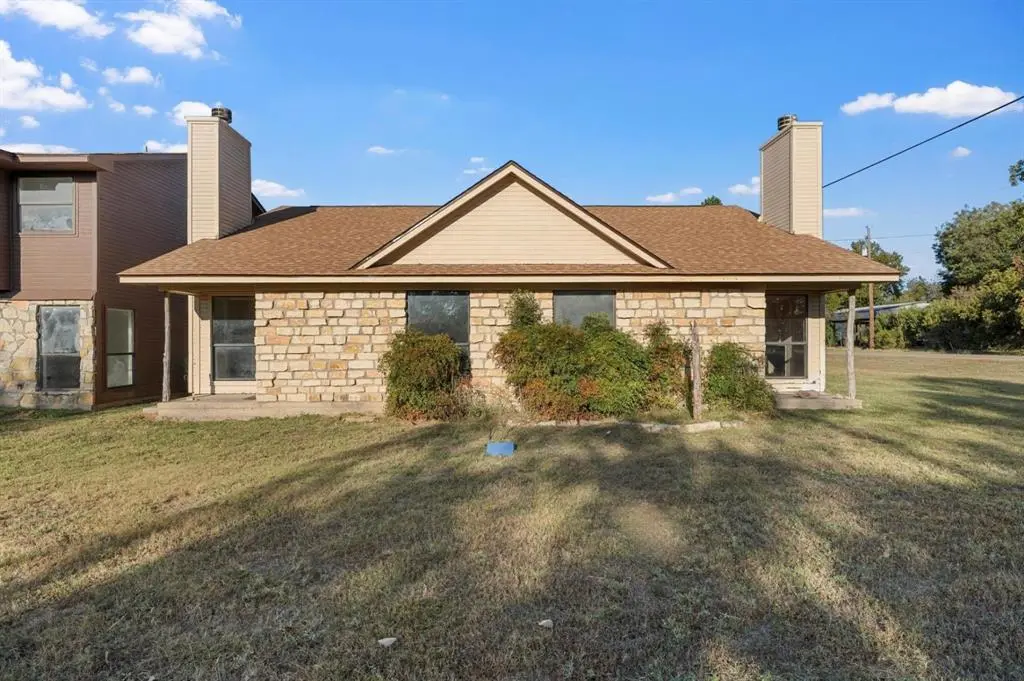
909 Shepherd St · Morgan, TX
Flood risk 1/10 · Minimal
- FEMA flood zone
- X (unshaded)
- Chance of flooding over 30 yrs
- 0.0%
- Est. flood insurance / yr
- $507 – $1,088
Fire risk 7/10 · Major
- Est. fire insurance / yr
- $1,222 – $2,270
Heat risk 7/10 · Major
- Hot days now (above 108°F)
- 7 days/yr
- Hot days in 30 yrs
- 24 days/yr
Wind risk 6/10 · Moderate
- Chance of severe wind over 30 yrs
- 27.0%
Air-quality risk 2/10 · Minimal
- Unhealthy air days now
- 1 days/yr
- Unhealthy air days in 30 yrs
- 1 days/yr
Risk factors via First Street. Map © Google.
Why this score? — see what drove the C+ grade
The composite is a weighted blend of 9 inputs, each scored 0–100. Each bar is that input's sub-score; the figure is the points it added to the 100-point composite (weight × sub-score).
- Cash flow +23.7/30.0
- DSCR +7.6/10.0
- ARV discount +7.5/15.0
- Appreciation +6.6/10.0
- 1% rule +6.2/10.0
- Schools +3.2/10.0
- Livability +2.8/5.0
- Rent growth +2.5/5.0
- Condition / age +2.2/5.0
$130,000
🖨 Deal sheet (PDF) 📄 Offer letter ✓ Due diligence
Listing remarks MLS
This 1,888 sq ft duplex includes 2 bedrooms and 1.5 baths per unit. Both units have value add potential, leaving room for you to come in and be as creative as you want. The property sits alongside two larger duplexes (905 & 907 Shepherd St), making it an ideal addition to an investment bundle or a perfect standalone income property. The adjoining lots and neighboring duplexes (907 & 909 Shepherd St) are also available—purchase one or the full package for an unmatched multi-property investment opportunity.
Key facts
- 6,273 sq ft lot
- 2 parking spots
- Built 2000
Neighborhood map
What this means for you Summary
Snapshot
- This is a 4-bed/3.0-bath single-family listed at $130k. Condition is rated fair.
Deal economics
- At list price, monthly cash flow is $247 ($3k/yr) — positive.
- The deal already cash-flows at list — no discount required.
- Meets the 1% rule at list price ($1k rent vs $130k).
- Recommended offer: $118k (9.0% below list) — sets the bar for market timing.
Location & tenants
- Location reads 56/100 on livability (#1,291 in TX) — a working-class tenant base; expect higher turnover. Strengths: cost of living A+, housing A+; Watch: health & safety D+, schools F, crime F.
- Morgan ISD (rural): math 40% / reading 30% proficiency, ranked #895 of 1,141 in TX (top 78%) — families likely to look elsewhere, expect single-tenant / working-renter base with shorter leases; 74% free/reduced lunch — lower-income household profile, screen leases tightly.
- Market conditions: 46 active listings in the ZIP; 15 units permitted in Bosque County in 2024 (0 in 5+ unit buildings).
Forward outlook
- In year one you build about $5k of equity ($899 loan paydown + $4k appreciation (3.1% local appreciation)).
- Bosque County population projected at -13% by 2050 — secular population decline; favor cash flow + early exit over multi-decade hold.
- At projected returns (3.1% appreciation + 3.0% rent growth), your $36k cash investment doubles in ~5 years — after that, you're playing with house money.
- By year 7, paydown + projected appreciation supports a ~$32k cash-out refi (75% LTV) — recoverable capital for the next deal without selling this one.
Negotiation context
- It's been on market 95 days — a 9% lower offer ($118k) is reasonable based on typical stale-listing flexibility.
- 3 sale attempts since 2y ago with the ask held roughly flat each time — persistent listings suggest the price (not the market) is what's stuck; bring a comps-based counter.
Risks & watch-outs
- Climate carrying-cost: major wind risk, 27% chance of damaging wind over 30y; major wildfire risk; extreme-heat days projected 7→24/yr by 2055 (HVAC capex compounding) — expect insurance premiums to compound above CPI over the hold.
Questions for the listing agent
- It's been on market 95 days. Have you received any prior offers? Is the seller open to a 9% concession, seller financing, or rate buy-down credit?
- Have any recent inspections been done? Can we get a copy of the seller's disclosures and any deferred-maintenance estimates?
- Why hasn't it sold? Are there any deal-killer items the seller is aware of (foundation, flood, title, zoning, code violations)?
- Is there a deadline driving the sale (1031 exchange, divorce, estate, relocation)? That informs how much negotiation room exists.
- Schools are F-rated, which usually means shorter tenancies and higher turnover. Who's the typical renter profile here, and what's been the actual vacancy rate?
- Crime grade is F in this area — have there been break-ins, vandalism, or insurance claims at this property in the last 3 years? What carrier currently insures it and at what premium?
- What's the average days-on-market for RENTAL listings here right now (not sales)? A rising rental-DOM trend means longer vacancies and softer asking-rent achievability than the comps imply.
- What's the recent tenant-quality profile in this submarket — average credit score on applications, eviction rate, late-payment / NSF rate, and stable-employment percentage? A property-management company in the area should have these aggregated.
- How much new for-sale + rental construction is in the pipeline within 1–3 miles? Heavy new supply typically softens prices + rents 12–24 months out; constrained supply supports both.
Investment metrics
- 1% rule
- 1.12% ✓
- Cap rate
- 8.58%
- Cash-on-cash
- 8.16%
- DSCR
- 1.36
- GRM
- 7.5
CMA / ARV
No comps found within radius.
Projected returns pro-forma
3.15% appreciation · 3.0% rent growth · sell at horizon
- IRR
- 15.5%
- Equity multiple
- 1.89×
- Total profit
- $32,503
- Equity at exit
- $59,582
- IRR
- 17.1%
- Equity multiple
- 3.54×
- Total profit
- $92,364
- Equity at exit
- $92,710
Cash invested: $36,400 (down + closing). Projections, not guarantees.
Landlord ↔ Tenant lean methodology
- Overall (STATE)
- 87 Strongly Landlord-Friendly
- State Texas
- 87 Strongly Landlord-Friendly · R+5
- County
- — inherits STATE
- City
- — inherits STATE
ZIP-level market 76690
- Home prices YoY
- 1.8%
- Active inventory
- 46
- Price-to-rent
- 7.5×
Monthly cashflow live
- Estimated rent
- $1,450 medium interval (Pro) →
- Mortgage (P&I)
- −$682
- Tax est. 1.5%
- −$162 /mo · $1,950/yr
- Insurance
- −$54
- HOA
- −$0
- Vacancy / Maint / Mgmt
- −$305
- Net cashflow
- $247
Break-even live
Sensitivity live
| Price | -10% $337 | -5% $292 | +0% $247 | +5% $203 | +10% $158 |
|---|---|---|---|---|---|
| Rent | -10% $133 | -5% $190 | +0% $247 | +5% $305 | +10% $362 |
| Rate | -1.0pp $313 | -0.5pp $281 | base $247 | +0.5pp $214 | +1.0pp $179 |
UW: 25.0% down · 7.5% · 30yr · 1.5% tax · 5.0% vac · 8.0% maint · 8.0% mgmt
Financing live
Cash to close
- Down payment
- $32,500
- Closing costs
- $3,900
- Reserves months
- —
- Total cash needed
- —
Loan-product check · same deal, 3 products live
Conventional
25% down · 7.5% · 30yr
- Down + closing
- —
- Monthly P&I
- —
- Monthly cashflow
- —
- DSCR
- —
- Eligible?
- —
Personal DTI + credit; lowest rate.
DSCR
20% down · 8.5% · 30yr
- Down + closing
- —
- Monthly P&I
- —
- Monthly cashflow
- —
- DSCR
- —
- Eligible?
- —
No personal income docs; deal must DSCR.
Hard money
10% down · 12.0% · 12mo
- Down + closing
- —
- Monthly P&I
- —
- Monthly cashflow
- —
- DSCR
- —
- Eligible?
- —
Short-term bridge; refi at stabilization.
Listing history 22 events
-
2026-06-21days on market $130,000 Active 95 DOM
-
2026-06-18days on market $130,000 Active 93 DOM
-
2026-06-17days on market $130,000 Active 92 DOM
-
2026-06-16days on market $130,000 Active 91 DOM
-
2026-06-15days on market $130,000 Active 90 DOM
-
2026-06-15days on market $130,000 Active 89 DOM
-
2026-06-13days on market $130,000 Active 88 DOM
-
2026-06-12days on market $130,000 Active 87 DOM
-
2026-06-10days on market $130,000 Active 84 DOM
-
2026-06-08days on market $130,000 Active 83 DOM
-
2026-06-08days on market $130,000 Active 82 DOM
-
2026-06-05days on market $130,000 Active 80 DOM
-
2026-06-03days on market $130,000 Active 78 DOM
-
2026-06-02days on market $130,000 Active 77 DOM
-
2026-06-01days on market $130,000 Active 76 DOM
-
2026-05-31days on market $130,000 Active 75 DOM
-
2026-03-17historical
Show marketing remark (527 chars)
This 1,888 sq ft duplex includes 2 bedrooms and 1.5 baths per unit. Both units have value add potential, leaving room for you to come in and be as creative as you want. The property sits alongside two larger duplexes (905 & 907 Shepherd St), making it an ideal addition to an investment bundle or a perfect standalone income property. The adjoining lots and neighboring duplexes (907 & 909 Shepherd St) are also available—purchase one or the full package for an unmatched multi-property investment opportunity.
-
2026-03-17$130,000 Active 527-char remark
Show marketing remark (527 chars)
This 1,888 sq ft duplex includes 2 bedrooms and 1.5 baths per unit. Both units have value add potential, leaving room for you to come in and be as creative as you want. The property sits alongside two larger duplexes (905 & 907 Shepherd St), making it an ideal addition to an investment bundle or a perfect standalone income property. The adjoining lots and neighboring duplexes (907 & 909 Shepherd St) are also available—purchase one or the full package for an unmatched multi-property investment opportunity.
-
2026-02-19price $130,000
-
2025-10-20$155,000 Active
-
2025-05-16historical
-
2024-07-12$675,000 Active
ⓘ Source: listings_history table (triggers on properties + properties_extension) + one-shot
backfill from property_details.listing_events for pre-trigger history.
Climate risk First Street
- Flood 1/10 Low FEMA zone X (unshaded) · 0% chance over 30 yrs
- Wildfire 7/10 Severe
- Heat 7/10 Severe 7 d/yr ≥108°F today · 24 d/yr by 30 yrs out
- Wind 6/10 Major 27% chance of damaging wind over 30 yrs
- Air quality 2/10 Low 1 unhealthy d/yr today · 1 by 30 yrs out
Nearby sold comps map
Loading sold comps map…
Walkable amenities ~0.75 mi
Loading nearby amenities…
Taxation est. · year 1
- Rental income
- $17,405
- − Mortgage interest
- −$7,282
- − Property taxes
- −$1,950
- − Insurance
- −$650
- − Repairs & maintenance
- −$1,392
- − Management
- −$1,392
- − Depreciation
- −$3,782
- Taxable income
- $957
- Est. tax owed @ 24.0%
- −$230
- After-tax cash flow
- $2,740/yr
For passive investors: Depreciation is non-cash, so a rental often shows a tax loss while cash-flowing — sheltering income. Rental losses are passive: they offset passive income freely, and up to $25,000/yr can offset ordinary (W-2) income if you actively participate and your MAGI is under $100k (phasing out to $0 by $150k); unused losses carry forward. On sale, claimed depreciation is recaptured at up to 25%, and gains may owe capital-gains tax (a 1031 exchange can defer both). Figures are a year-1 estimate at your 24.0% rate — not tax advice; consult a CPA.
Condition & rehab AI · 6 photos
The property presents as needing moderate repairs and maintenance, particularly in the exterior and landscaping areas. Addressing these issues can significantly enhance its value for both resale and rental purposes.
Repairs flagged
- Minor Landscaping — Some areas of the landscaping appear overgrown and could benefit from trimming and maintenance.
- Moderate Exterior paint — The exterior paint shows some discoloration and minor wear, indicating a need for touch-up or repainting.
Value-add opportunities
- Both Landscaping — A well-maintained and aesthetically pleasing landscape can enhance both the resale and rental value of the property.
- Both Exterior paint — Fresh paint can improve the curb appeal and overall appearance of the property, attracting more potential buyers or renters.
Renovation cost estimate screening
| Repair item | Severity | Est. cost |
|---|---|---|
| Landscaping · Some areas of the landscaping appear overgrown and could benefit from trimming and maintenance. | Minor | $500–3,000 |
| Exterior paint · The exterior paint shows some discoloration and minor wear, indicating a need for touch-up or repainting. | Moderate | $3,000–15,000 |
| Total estimated repair cost · 2 items | $3,500–18,000 |
Value-add ROI direction
- Both Landscaping — A well-maintained and aesthetically pleasing landscape can enhance both the resale and rental value of the property. ↑
- Both Exterior paint — Fresh paint can improve the curb appeal and overall appearance of the property, attracting more potential buyers or renters. ↑
ⓘ Cost ranges are severity-bucket heuristics (US national rule-of-thumb). Get contractor quotes + a written scope before underwriting a rehab budget.
Schools (NCES district)
- District
- Morgan ISD
- NCES district ID
- 4831380
- Math proficiency
- 40% ▲ 5.00%
- Reading proficiency
- 30% ▬ 0.00%
- Median HH income
- $44,102
- Composite
- 32.43/100
- National rank
- #10864
- State rank
- #895 of 1141 in TX
Livability — Morgan
- Score
- 56/100
- State rank
- #1291
- US rank
- #22455
Category grades
Schools grade is shown separately in the Schools card above.
Census & demographics
- Census place
- Morgan, TX
- Population (ZIP)
- 1,280
Population outlook (Bosque County) Hauer SSP2
- Today (2025)
- 17,405 people
- By 2030
- 16,953 · -2.6%
- By 2040
- 16,014 · -8.0%
- By 2050
- 15,116 · -13.2%
- By 2075
- 13,468 · -22.6%
- By 2100
- 11,147 · -36.0%
Race, ethnicity, and origin ACS 2023
- Neighborhood character
- Predominantly White (71%)
- Race & ethnicity
- White 71% Hispanic / Latino 26% Two or more races 20%
- Hispanic origin (detail)
- Mexican 25%
- Common ancestry
- Italian 2%
- Foreign-born
- 8% · Canada
- Languages at home
- 85% English-only · Spanish 14%
Political lean MEDSL · Bosque
- 2024 margin
- Solid R (+67.3) · D 15.9% · R 83.3%
- 2008→2024 swing
- -15.5pp toward R · 2008: -51.9pp · 2024: -67.3pp
- All cycles
- 2024: R+67.3 2020: R+64.7 2016: R+64.7 2012: R+61.4 2008: R+51.9
Not yet ingested
- Civics
- —
Market trends
- HPI YoY
- ▲ 3.15%
- Current HPI
- 180.4906
- Rent YoY
- —
- Metro
- —
- State GDP YoY
- ▲ 3.95%
- F500 in state
- 110
Industry mix (Fortune 500 HQ in TX)
| Industry | F500 HQs | Revenue |
|---|---|---|
| Energy | 16 | $1,198B |
|
||
| Technology | 5 | $198B |
|
||
| Engineering / Construction | 4 | $72B |
|
||
| Energy Services | 3 | $60B |
|
||
| Utilities | 3 | $41B |
|
||
| Healthcare | 2 | $330B |
|
||
Price history
-80.7% since first listed6 events — show timeline
- 2026-03-17 Listed $130,000 NTREIS
- 2026-03-17 Listing Removed — NTREIS
- 2026-02-19 Price Changed $130,000 NTREIS
- 2025-10-20 Listed $155,000 NTREIS
- 2025-05-16 Listing Removed — NTREIS
- 2024-07-12 Listed $675,000 NTREIS
Cash-flow waterfall
monthlySold comps — $/sqft
last 12 mo · ≤1 miLoading sold comps…