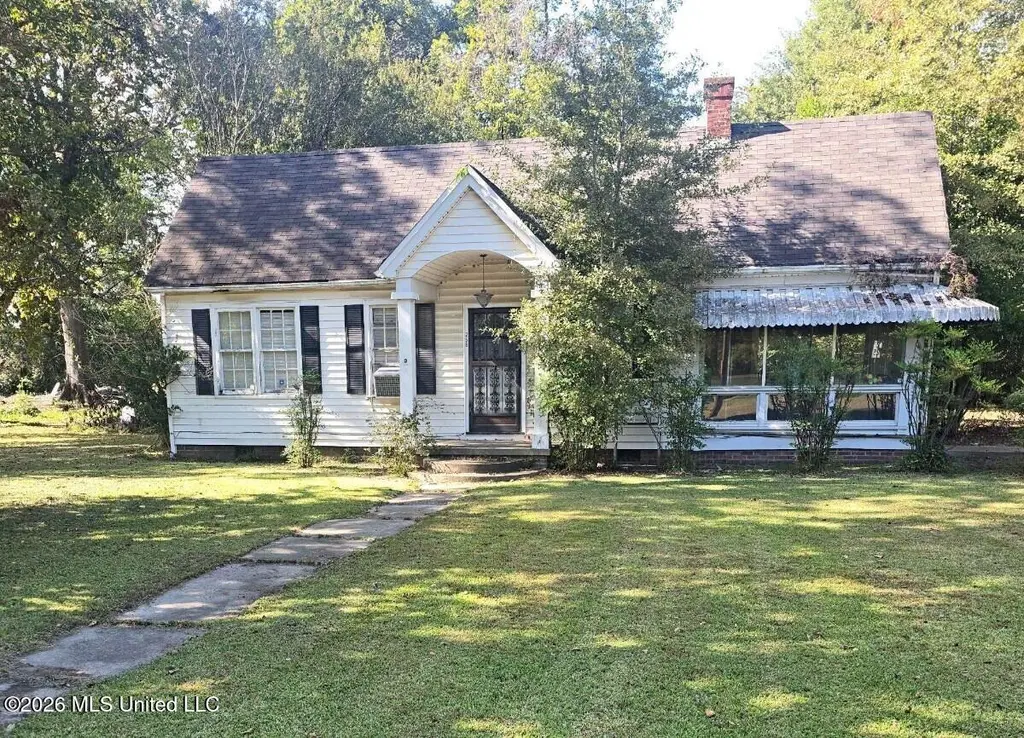
256 W Main St · Webb, MS
Flood risk 1/10 · Minimal
- FEMA flood zone
- X (unshaded)
- Chance of flooding over 30 yrs
- 0.0%
- Est. flood insurance / yr
- $507 – $1,088
Fire risk 1/10 · Minimal
- Est. fire insurance / yr
- $1,241 – $2,305
Heat risk 7/10 · Major
- Hot days now (above 110°F)
- 7 days/yr
- Hot days in 30 yrs
- 20 days/yr
Wind risk 6/10 · Moderate
- Chance of severe wind over 30 yrs
- 27.0%
Air-quality risk 1/10 · Minimal
- Unhealthy air days now
- 0 days/yr
- Unhealthy air days in 30 yrs
- 0 days/yr
Risk factors via First Street. Map © Google.
Why this score? — see what drove the B grade
The composite is a weighted blend of 9 inputs, each scored 0–100. Each bar is that input's sub-score; the figure is the points it added to the 100-point composite (weight × sub-score).
- Cash flow +30.0/30.0
- 1% rule +10.0/10.0
- DSCR +10.0/10.0
- ARV discount +7.5/15.0
- Appreciation +5.0/10.0
- Livability +2.6/5.0
- Rent growth +2.5/5.0
- Condition / age +2.5/5.0
- Schools +0.5/10.0
$38,290
🖨 Deal sheet 📄 Offer letter ✓ Due diligence
Listing remarks
Located in the heart of Webb, this property offers a convenient setting with proximity to local amenities, schools, and community services. The home presents an opportunity for buyers seeking a property they can update and personalize to their preferences. With an easy layout and a manageable lot, the property provides potential for a variety of uses, whether as a primary residence, rental investment, or renovation project. Being situated along a main corridor offers easy access through town while maintaining a neighborhood feel. Property is being offered as-is.
Key facts
- Manageable lot
- 0.59 acre lot
- 2 parking spots
Tags
Property features AI
Exterior
- Parking: Attached carport with 2 carport spaces
- Utilities: Public water; Electricity available; Sewer: Unknown
- Home design: Single family residence (house); One level
- Construction: Wood siding construction; Conventional foundation; Asphalt shingle roof; Built (year source: assessor)
- Exterior features: Patio
Interior
- Kitchen: Dishwasher
- Bathrooms: 1 full bathroom
- Heating & cooling: Heating via fireplace(s); Ceiling fan(s) for cooling
- Interior features: Dishwasher; Fireplace in the living room
Neighborhood map
What this means for you Summary
Snapshot
- This is a 3-bed/1.0-bath single-family listed at $38k.
Deal economics
- At list price, monthly cash flow is $637 ($8k/yr) — positive.
- The deal already cash-flows at list — no discount required.
- Meets the 1% rule at list price ($1k rent vs $38k).
- Recommended offer: $37k (3.0% below list) — sets the bar for market timing.
Location & tenants
- Location reads 52/100 on livability (#333 in MS) — a working-class tenant base; expect higher turnover. Strengths: cost of living A+, housing B+; Watch: amenities F, commute F, employment F.
- West Tallahatchie School District (rural): math 4% / reading 11% proficiency, ranked #125 of 130 in MS (top 96%) — low school quality limits family demand, transient renter base, plan for 1-2y turnover; 98% free/reduced lunch — lower-income household profile, screen leases tightly.
- Zoned schools: R H Bearden Elementary School (math 2% / reading 8%, grade F, #356 of 375 statewide, top 98%, 253 students, 100% FRL); West Tallahatchie High School (math 2% / reading 17%, grade F, #170 of 197 statewide, top 90%, 260 students, 100% FRL) — zoned schools at 100% FRL track the district average.
- Market conditions: 3 active listings in the ZIP; 1 units permitted in Tallahatchie County in 2024 (0 in 5+ unit buildings).
Forward outlook
- In year one you build about $1k of equity ($264 loan paydown + $1k appreciation (3.0% local appreciation)).
- Tallahatchie County population projected at -19% by 2050 — secular population decline; favor cash flow + early exit over multi-decade hold.
- At projected returns (3.0% appreciation + 3.0% rent growth), your $11k cash investment doubles in ~2 years — after that, you're playing with house money.
Negotiation context
- It's been on market 55 days — a 3% lower offer ($37k) is reasonable based on typical stale-listing flexibility.
Risks & watch-outs
- Watch-outs: built in 1950 — expect roof / HVAC / electrical / plumbing capex.
- Climate carrying-cost: major wind risk, 27% chance of damaging wind over 30y; extreme-heat days projected 7→20/yr by 2055 (HVAC capex compounding) — expect insurance premiums to compound above CPI over the hold.
Questions for the listing agent
- It's been on market 55 days. Have you received any prior offers? Is the seller open to a 3% concession, seller financing, or rate buy-down credit?
- Built in 1950 — when were the roof, HVAC, electrical panel, plumbing, and water heater last replaced?
- Is there a deadline driving the sale (1031 exchange, divorce, estate, relocation)? That informs how much negotiation room exists.
- Schools are F-rated, which usually means shorter tenancies and higher turnover. Who's the typical renter profile here, and what's been the actual vacancy rate?
- What's the average days-on-market for RENTAL listings here right now (not sales)? A rising rental-DOM trend means longer vacancies and softer asking-rent achievability than the comps imply.
- What's the recent tenant-quality profile in this submarket — average credit score on applications, eviction rate, late-payment / NSF rate, and stable-employment percentage? A property-management company in the area should have these aggregated.
- How much new for-sale + rental construction is in the pipeline within 1–3 miles? Heavy new supply typically softens prices + rents 12–24 months out; constrained supply supports both.
Investment metrics
- 1% rule
- 3.05% ✓
- Cap rate
- 26.26%
- Cash-on-cash
- 71.32%
- DSCR
- 4.17
- GRM
- 2.7
CMA / ARV
- ARV (median comp)
- $141,475
- List price
- $38,290
- Delta
- -72.94%
- Verdict
- UNDERPRICED
- Comps
- 1 within 2.0 mi
Show comp detail 1 sale within ~0.75 mi
| Address | Dist | Beds/Ba | Sqft | Sold | Price | $/sf | Match |
|---|---|---|---|---|---|---|---|
| 250 1st St | 0.14mi | 3/2.0 | 1,930 (-6%) | 10mo | $139,900 | $72 | 71 |
Match score weights: distance 35% · size 25% · config 20% · recency 20%. Top-matched comps best support the ARV.
Projected returns pro-forma
3.0% appreciation · 3.0% rent growth · sell at horizon
- IRR
- 76.0%
- Equity multiple
- 5.22×
- Total profit
- $45,226
- Equity at exit
- $17,217
- IRR
- 75.5%
- Equity multiple
- 10.72×
- Total profit
- $104,173
- Equity at exit
- $26,533
Cash invested: $10,721 (down + closing). Projections, not guarantees.
Landlord ↔ Tenant lean methodology
- Overall (STATE)
- 90 Strongly Landlord-Friendly
- State Mississippi
- 90 Strongly Landlord-Friendly · R+11
- County
- — inherits STATE
- City
- — inherits STATE
ZIP-level market 38966
- Active inventory
- 3
- Price-to-rent
- 2.7×
Monthly cashflow live
- Estimated rent
- $1,168 medium interval (Pro) →
- Mortgage (P&I)
- −$201
- Tax from tax record
- −$69 /mo · $824/yr
- Insurance
- −$16
- HOA
- −$0
- Vacancy / Maint / Mgmt
- −$245
- Net cashflow
- $637
Break-even live
UW: 25.0% down · 7.5% · 30yr · 1.5% tax · 5.0% vac · 8.0% maint · 8.0% mgmt
Financing live
Cash to close
- Down payment
- $9,572
- Closing costs
- $1,149
- Reserves months
- —
- Total cash needed
- —
Loan-product check · same deal, 3 products live
Conventional
25% down · 7.5% · 30yr
- Down + closing
- —
- Monthly P&I
- —
- Monthly cashflow
- —
- DSCR
- —
- Eligible?
- —
Personal DTI + credit; lowest rate.
DSCR
20% down · 8.5% · 30yr
- Down + closing
- —
- Monthly P&I
- —
- Monthly cashflow
- —
- DSCR
- —
- Eligible?
- —
No personal income docs; deal must DSCR.
Hard money
10% down · 12.0% · 12mo
- Down + closing
- —
- Monthly P&I
- —
- Monthly cashflow
- —
- DSCR
- —
- Eligible?
- —
Short-term bridge; refi at stabilization.
Listing history 15 events
-
2026-06-18days on market $38,290 Active 55 DOM
-
2026-06-17days on market $38,290 Active 54 DOM
-
2026-06-16days on market $38,290 Active 53 DOM
-
2026-06-15days on market $38,290 Active 52 DOM
-
2026-06-13days on market $38,290 Active 50 DOM
-
2026-06-12days on market $38,290 Active 49 DOM
-
2026-06-09days on market $38,290 Active 46 DOM
-
2026-06-08days on market $38,290 Active 45 DOM
-
2026-06-07days on market $38,290 Active 44 DOM
-
2026-06-05days on market $38,290 Active 42 DOM
-
2026-06-04days on market $38,290 Active 40 DOM
-
2026-06-02days on market $38,290 Active 39 DOM
-
2026-06-01days on market $38,290 Active 38 DOM
-
2026-05-31days on market $38,290 Active 37 DOM
-
2026-04-24$41,600 Active 568-char remark
ⓘ Source: listings_history table (triggers on properties + properties_extension) + one-shot
backfill from property_details.listing_events for pre-trigger history.
Tax reassessment forecast MS · Resets to sale price
- Current annual tax
- $824 · $69/mo
- Projected year-2 tax
- $824 · $69/mo
- Expected delta
- $0/yr ($0/mo · 0.0%)
ⓘ Screening estimate from a state-policy table — verify with the county assessor before closing.
Climate risk First Street
- Flood 1/10 Low FEMA zone X (unshaded) · 0% chance over 30 yrs
- Wildfire 1/10 Low
- Heat 7/10 Severe 7 d/yr ≥110°F today · 20 d/yr by 30 yrs out
- Wind 6/10 Major 27% chance of damaging wind over 30 yrs
- Air quality 1/10 Low 0 unhealthy d/yr today · 0 by 30 yrs out
Nearby sold comps map
Loading sold comps map…
Walkable amenities ~0.75 mi
Loading nearby amenities…
Taxation est. · year 1
- Rental income
- $14,014
- − Mortgage interest
- −$2,145
- − Property taxes
- −$824
- − Insurance
- −$191
- − Repairs & maintenance
- −$1,121
- − Management
- −$1,121
- − Depreciation
- −$1,114
- Taxable income
- $7,498
- Est. tax owed @ 24.0%
- −$1,799
- After-tax cash flow
- $5,847/yr
For passive investors: Depreciation is non-cash, so a rental often shows a tax loss while cash-flowing — sheltering income. Rental losses are passive: they offset passive income freely, and up to $25,000/yr can offset ordinary (W-2) income if you actively participate and your MAGI is under $100k (phasing out to $0 by $150k); unused losses carry forward. On sale, claimed depreciation is recaptured at up to 25%, and gains may owe capital-gains tax (a 1031 exchange can defer both). Figures are a year-1 estimate at your 24.0% rate — not tax advice; consult a CPA.
Schools (NCES district)
- District
- West Tallahatchie School District
- NCES district ID
- 2804650
- Math proficiency
- 4% ▼ -24.00%
- Reading proficiency
- 11% ▼ -9.00%
- Median HH income
- $27,543
- Composite
- 5.38/100
- National rank
- #10029
- State rank
- #125 of 130 in MS
Livability — Webb
- Score
- 52/100
- State rank
- #333
- US rank
- #24775
Category grades
Schools grade is shown separately in the Schools card above.
Census & demographics
- Census place
- Webb, MS
- Population (ZIP)
- 747
Population outlook (Tallahatchie County) Hauer SSP2
- Today (2025)
- 13,680 people
- By 2030
- 13,261 · -3.1%
- By 2040
- 12,205 · -10.8%
- By 2050
- 11,028 · -19.4%
- By 2075
- 8,367 · -38.8%
- By 2100
- 6,277 · -54.1%
Race, ethnicity, and origin ACS 2023
- Neighborhood character
- Predominantly Black (97%)
- Race & ethnicity
- Black 97% White 3%
Political lean MEDSL · Tallahatchie
- 2024 margin
- Lean D (+5.9) · D 52.5% · R 46.5%
- 2008→2024 swing
- -13.1pp toward R · 2008: 19.0pp · 2024: 5.9pp
- All cycles
- 2024: D+5.9 2020: D+10.8 2016: D+14.9 2012: D+21.3 2008: D+19.0
Not yet ingested
- Civics
- —
Market trends
- HPI YoY
- —
- Current HPI
- —
- Rent YoY
- —
- Metro
- —
- State GDP YoY
- —
- F500 in state
- 0
Price history
-8.0% since first listed2 events — show timeline
- 2026-05-26 Price Changed $38,290 MLSU
- 2026-04-24 Listed $41,600 MLSU
Property tax history
+3.3%/yrLatest (2025): $824 · +38.4% YoY. Source: county tax records.
Cash-flow waterfall
monthlySold comps — $/sqft
last 12 mo · ≤1 miLoading sold comps…