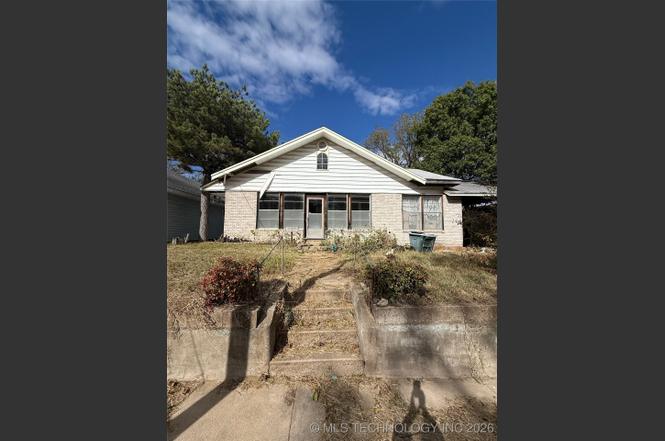
914 W Wyandotte · Sulphur, OK
Flood risk 1/10 · Minimal
- FEMA flood zone
- X (unshaded)
- Chance of flooding over 30 yrs
- 0.0%
- Est. flood insurance / yr
- $507 – $1,088
Fire risk 7/10 · Major
- Est. fire insurance / yr
- $2,463 – $4,575
Heat risk 6/10 · Moderate
- Hot days now (above 108°F)
- 7 days/yr
- Hot days in 30 yrs
- 19 days/yr
Wind risk 3/10 · Minor
- Chance of severe wind over 30 yrs
- 8.0%
Air-quality risk 2/10 · Minimal
- Unhealthy air days now
- 1 days/yr
- Unhealthy air days in 30 yrs
- 1 days/yr
Risk factors via First Street. Map © Google.
Why this score? — see what drove the B+ grade
The composite is a weighted blend of 9 inputs, each scored 0–100. Each bar is that input's sub-score; the figure is the points it added to the 100-point composite (weight × sub-score).
- Cash flow +30.0/30.0
- 1% rule +10.0/10.0
- DSCR +10.0/10.0
- Appreciation +8.0/10.0
- ARV discount +7.5/15.0
- Livability +3.4/5.0
- Schools +2.6/10.0
- Rent growth +2.5/5.0
- Condition / age +2.5/5.0
$25,000
🖨 Deal sheet 📄 Offer letter ✓ Due diligence
Listing remarks
Bring your vision and tools — this 2 bedroom, 1 bath home is a total gut job waiting for the right investor to bring it back to life! This property features an enclosed front porch, a spacious laundry room, and solid bones ready for your next flip or rental project. With a full renovation, you can design every detail to your liking — from layout to finishes. Key Features: 2 Bedrooms / 1 Bathroom Enclosed Front Porch Laundry Room Total Rehab Needed – Endless Possibilities! Excellent Fix & Flip or Rental Opportunity Priced to sell
Key facts
- Laundry room
- Enclosed front porch
- 9,090 sq ft lot
Tags
Property features AI
Exterior
- Security: No safety shelter
- Utilities: Electricity available; Natural gas available; Public water; Public sewer
- Home design: Single-story; Faces south
- Construction: Wood frame construction; Asphalt/fiberglass roof; Built per public records
- Exterior features: Enclosed porch; Porch
Interior
- Flooring: Carpet
- Bathrooms: 1 full bathroom
- Interior features: Laminate countertops; Carpet flooring
Neighborhood map
What this means for you Summary
Snapshot
- This is a 2-bed/1.0-bath single-family listed at $25k.
Deal economics
- At list price, monthly cash flow is $630 ($8k/yr) — positive.
- The deal already cash-flows at list — no discount required.
- Meets the 1% rule at list price ($994 rent vs $25k).
- Recommended offer: $22k (12.0% below list) — sets the bar for market timing.
- Cap rate 36.6% vs local median 3.4% in Sulphur — top-decile yield for the area; either an underpriced asset or a hidden risk that comps aren't pricing in. Stress-test before assuming the spread holds.
Location & tenants
- Location reads 68/100 on livability (#60 in OK) — a middle-class / working-renter tenant base. Strengths: cost of living A+, housing A+, crime B+; Watch: employment C-, schools D-, amenities F.
- Sulphur (town): math 30% / reading 32% proficiency, ranked #56 of 270 in OK (top 21%) — families likely to look elsewhere, expect single-tenant / working-renter base with shorter leases.
- Market conditions: 147 active listings in the ZIP; 20 units permitted in Murray County in 2024 (0 in 5+ unit buildings).
Forward outlook
- In year one you build about $2k of equity ($173 loan paydown + $1k appreciation (5.9% local appreciation)).
- Murray County population projected at +16% by 2050 — long-run rental-demand tailwind backs the buy-and-hold thesis.
- At projected returns (5.9% appreciation + 3.0% rent growth), your $7k cash investment doubles in ~1 year — after that, you're playing with house money.
Negotiation context
- It's been on market 228 days — a 12% lower offer ($22k) is reasonable based on typical stale-listing flexibility.
- 2 sale attempts; this cycle's ask has dropped $4k (14%) from the opening price — seller is motivated, your offer sets the floor, not the list.
Risks & watch-outs
- Climate carrying-cost: major wildfire risk; extreme-heat days projected 7→19/yr by 2055 (HVAC capex compounding) — expect insurance premiums to compound above CPI over the hold.
Questions for the listing agent
- It's been on market 228 days. Have you received any prior offers? Is the seller open to a 12% concession, seller financing, or rate buy-down credit?
- Built in 1965 — when were the roof, HVAC, electrical panel, plumbing, and water heater last replaced?
- Why hasn't it sold? Are there any deal-killer items the seller is aware of (foundation, flood, title, zoning, code violations)?
- Is there a deadline driving the sale (1031 exchange, divorce, estate, relocation)? That informs how much negotiation room exists.
- Schools are D-rated, which usually means shorter tenancies and higher turnover. Who's the typical renter profile here, and what's been the actual vacancy rate?
- What's the average days-on-market for RENTAL listings here right now (not sales)? A rising rental-DOM trend means longer vacancies and softer asking-rent achievability than the comps imply.
- What's the recent tenant-quality profile in this submarket — average credit score on applications, eviction rate, late-payment / NSF rate, and stable-employment percentage? A property-management company in the area should have these aggregated.
- How much new for-sale + rental construction is in the pipeline within 1–3 miles? Heavy new supply typically softens prices + rents 12–24 months out; constrained supply supports both.
Investment metrics
- 1% rule
- 3.98% ✓
- Cap rate
- 36.55%
- Cash-on-cash
- 108.07%
- DSCR
- 5.81
- GRM
- 2.1
CMA / ARV
- ARV (on-the-fly)
- $135,660
- Comps found
- 12
Show comp detail 12 sales within ~0.75 mi
| Address | Dist | Beds/Ba | Sqft | Sold | Price | $/sf | Match |
|---|---|---|---|---|---|---|---|
| 1412 W Vinita | 0.44mi | 2/1.0 | 1,120 (-2%) | 5mo | $100,000 | $89 | 72 |
| 1113 W 11th St | 0.28mi | 2/1.0 | 1,060 (-7%) | 7mo | $81,370 | $77 | 70 |
| 1514 W Mcalester | 0.47mi | 3/1.0 (+1) | 1,092 (-4%) | 4mo | $130,000 | $119 | 62 |
| 1402 W 10th | 0.49mi | 3/1.0 (+1) | 1,194 (+5%) | 3mo | $171,000 | $143 | 62 |
| 1122 W 15th St | 0.50mi | 3/1.0 (+1) | 1,144 (+0%) | 12mo | $169,000 | $148 | 62 |
| 1320 W Oklahoma | 0.50mi | 3/1.0 (+1) | 1,152 (+1%) | 12mo | $96,250 | $84 | 60 |
| 1301 W 8th | 0.42mi | 3/1.0 (+1) | 1,248 (+10%) | 1mo | $25,000 | $20 | 59 |
| 917 Fairway | 0.58mi | 3/2.0 (+1) | 1,120 (-2%) | 9mo | $175,000 | $156 | 54 |
| 918 W Wyandotte | 0.01mi | 3/2.0 (+1) | 1,301 (+14%) | 20mo | $135,500 | $104 | 50 |
| 1609 W Ardmore | 0.57mi | 3/2.0 (+1) | 1,226 (+8%) | 10mo | $169,000 | $138 | 44 |
| 1220 W 14th | 0.47mi | 3/1.0 (+1) | 1,288 (+13%) | 12mo | $29,000 | $23 | 41 |
| 1306 W 17th | 0.73mi | 3/2.0 (+1) | 1,090 (-4%) | 18mo | $137,000 | $126 | 35 |
Match score weights: distance 35% · size 25% · config 20% · recency 20%. Top-matched comps best support the ARV.
Projected returns pro-forma
5.9% appreciation · 3.0% rent growth · sell at horizon
- IRR
- —
- Equity multiple
- 7.75×
- Total profit
- $47,227
- Equity at exit
- $15,560
- IRR
- —
- Equity multiple
- 16.36×
- Total profit
- $107,524
- Equity at exit
- $28,083
Cash invested: $7,000 (down + closing). Projections, not guarantees.
Landlord ↔ Tenant lean methodology
- Overall (STATE)
- 83 Strongly Landlord-Friendly
- State Oklahoma
- 83 Strongly Landlord-Friendly · R+20
- County
- — inherits STATE
- City
- — inherits STATE
ZIP-level market 73086
- Home prices YoY
- 1.8%
- Active inventory
- 147
- Price-to-rent
- 2.1×
Monthly cashflow live
- Estimated rent
- $994 medium interval (Pro) →
- Mortgage (P&I)
- −$131
- Tax from tax record
- −$13 /mo · $159/yr
- Insurance
- −$10
- HOA
- −$0
- Vacancy / Maint / Mgmt
- −$209
- Net cashflow
- $630
Break-even live
UW: 25.0% down · 7.5% · 30yr · 1.5% tax · 5.0% vac · 8.0% maint · 8.0% mgmt
Financing live
Cash to close
- Down payment
- $6,250
- Closing costs
- $750
- Reserves months
- —
- Total cash needed
- —
Loan-product check · same deal, 3 products live
Conventional
25% down · 7.5% · 30yr
- Down + closing
- —
- Monthly P&I
- —
- Monthly cashflow
- —
- DSCR
- —
- Eligible?
- —
Personal DTI + credit; lowest rate.
DSCR
20% down · 8.5% · 30yr
- Down + closing
- —
- Monthly P&I
- —
- Monthly cashflow
- —
- DSCR
- —
- Eligible?
- —
No personal income docs; deal must DSCR.
Hard money
10% down · 12.0% · 12mo
- Down + closing
- —
- Monthly P&I
- —
- Monthly cashflow
- —
- DSCR
- —
- Eligible?
- —
Short-term bridge; refi at stabilization.
Listing history 19 events
-
2026-06-19days on market $25,000 Active 228 DOM
-
2026-06-18days on market $25,000 Active 227 DOM
-
2026-06-17days on market $25,000 Active 226 DOM
-
2026-06-16days on market $25,000 Active 225 DOM
-
2026-06-15days on market $25,000 Active 224 DOM
-
2026-06-14days on market $25,000 Active 222 DOM
-
2026-06-12days on market $25,000 Active 221 DOM
-
2026-06-09days on market $25,000 Active 218 DOM
-
2026-06-08days on market $25,000 Active 217 DOM
-
2026-06-07days on market $25,000 Active 216 DOM
-
2026-06-03days on market $25,000 Active 212 DOM
-
2026-06-02days on market $25,000 Active 211 DOM
-
2026-06-01days on market $25,000 Active 210 DOM
-
2026-05-31days on market $25,000 Active 209 DOM
-
2026-05-30days on market $25,000 Active 208 DOM
-
2026-04-01price $25,000
-
2026-02-20status Active
-
2026-02-16status Pending
-
2025-10-31$29,000 Active
ⓘ Source: listings_history table (triggers on properties + properties_extension) + one-shot
backfill from property_details.listing_events for pre-trigger history.
Tax reassessment forecast OK · Resets to sale price
- Current annual tax
- $159 · $13/mo
- Projected year-2 tax
- $225 · $19/mo
- Expected delta
- +$66/yr (+$5/mo · 41.5%)
ⓘ Screening estimate from a state-policy table — verify with the county assessor before closing.
Climate risk First Street
- Flood 1/10 Low FEMA zone X (unshaded) · 0% chance over 30 yrs
- Wildfire 7/10 Severe
- Heat 6/10 Major 7 d/yr ≥108°F today · 19 d/yr by 30 yrs out
- Wind 3/10 Moderate 8% chance of damaging wind over 30 yrs
- Air quality 2/10 Low 1 unhealthy d/yr today · 1 by 30 yrs out
Nearby sold comps map
Loading sold comps map…
Walkable amenities ~0.75 mi
Loading nearby amenities…
Taxation est. · year 1
- Rental income
- $11,927
- − Mortgage interest
- −$1,400
- − Property taxes
- −$159
- − Insurance
- −$125
- − Repairs & maintenance
- −$954
- − Management
- −$954
- − Depreciation
- −$727
- Taxable income
- $7,607
- Est. tax owed @ 24.0%
- −$1,826
- After-tax cash flow
- $5,739/yr
For passive investors: Depreciation is non-cash, so a rental often shows a tax loss while cash-flowing — sheltering income. Rental losses are passive: they offset passive income freely, and up to $25,000/yr can offset ordinary (W-2) income if you actively participate and your MAGI is under $100k (phasing out to $0 by $150k); unused losses carry forward. On sale, claimed depreciation is recaptured at up to 25%, and gains may owe capital-gains tax (a 1031 exchange can defer both). Figures are a year-1 estimate at your 24.0% rate — not tax advice; consult a CPA.
Schools (NCES district)
- District
- Sulphur
- NCES district ID
- 4029160
- Math proficiency
- 30% ▼ -11.00%
- Reading proficiency
- 32% ▼ -9.00%
- Median HH income
- $44,116
- Composite
- 26.47/100
- National rank
- #7214
- State rank
- #56 of 270 in OK
Livability — Sulphur
- Score
- 68/100
- State rank
- #60
- US rank
- #9249
Category grades
Schools grade is shown separately in the Schools card above.
Census & demographics
- Census place
- Sulphur, OK
- City population
- 8,504
- Population (ZIP)
- 8,504
Population outlook (Murray County) Hauer SSP2
- Today (2025)
- 14,976 people
- By 2030
- 15,487 · +3.4%
- By 2040
- 16,455 · +9.9%
- By 2050
- 17,308 · +15.6%
- By 2075
- 19,421 · +29.7%
- By 2100
- 20,335 · +35.8%
Race, ethnicity, and origin ACS 2023
- Neighborhood character
- Predominantly White (68%)
- Race & ethnicity
- White 68% Two or more races 14% Native American 12% Hispanic / Latino 8%
- Hispanic origin (detail)
- Mexican 6%
- Common ancestry
- Slovak 4% Portuguese 2% Italian 1%
- Foreign-born
- 2% · Canada
- Languages at home
- 97% English-only · Spanish 2%
Political lean MEDSL · Murray
- 2024 margin
- Solid R (+61.3) · D 18.4% · R 79.7% · Other 2.0%
- 2008→2024 swing
- -21.0pp toward R · 2008: -40.4pp · 2024: -61.3pp
- All cycles
- 2024: R+61.3 2020: R+58.6 2016: R+55.9 2012: R+40.1 2008: R+40.4
Not yet ingested
- Civics
- —
Market trends
- HPI YoY
- ▲ 5.90%
- Current HPI
- 331.8646
- Rent YoY
- —
- Metro
- —
- State GDP YoY
- ▲ 1.55%
- F500 in state
- 6
Industry mix (Fortune 500 HQ in OK)
| Industry | F500 HQs | Revenue |
|---|---|---|
| Energy | 3 | $48B |
|
||
Price history
-13.8% since first listed4 events — show timeline
- 2026-04-01 Price Changed $25,000 MLS Technology, Inc.
- 2026-02-20 Relisted — MLS Technology, Inc.
- 2026-02-16 Pending — MLS Technology, Inc.
- 2025-10-31 Listed $29,000 MLS Technology, Inc.
Property tax history
+5.3%/yrLatest (2025): $159 · +4.6% YoY. Source: county tax records.
Cash-flow waterfall
monthlySold comps — $/sqft
last 12 mo · ≤1 miLoading sold comps…